{ DOWNLOAD AS PDF }
 ABOUT AUTHORS
S. Ashutosh Kumar*, Manidipa Debnath,Vaddi Pavan Krishna Kumar
Department of Pharmaceutical Analysis and Quality Assurance,
A.K.R.G College of Pharmacy,
Nallajerla, West Godavari, A.P
* ashu.mpharm2007@gmail.com
ABSTRACT
Purpose: A simple, precise, accurate, rapid and economical reverse phase high-pressure liquid chromatographic method has been developed as per ICH norms for the estimation of Naproxen from pharmaceutical formulation.
Methods: The method was carried out on a Kromosil-C18 ODS column (150 mm X 4.6 mm; 5 µ) with a mobile phase consists of ammonium acetate buffer (adjusted to pH 4.0 with 1 % Triethyl amine): methanol (40:60 v/v) and filtered through a 0.45 µ cellulose nitrate filters. The flow rate was maintained in isocratic mode at 1.0 mL/min. The detection was carried out at 210 nm. The run time was 7.0 min.
Results: The retention time was 3.063 min for Naproxen. The developed method was validated in terms of accuracy, precision, linearity, limit of detection, limit of quantification and solution stability.
Conclusion: The proposed method was adequate sensitive, reproducible, and specific for the determination of Naproxen in bulk as well as in tablet dosage forms.
[adsense:336x280:8701650588]
REFERENCE ID: PHARMATUTOR-ART-2432
|
PharmaTutor (Print-ISSN: 2394 - 6679; e-ISSN: 2347 - 7881) Volume 4, Issue 9 Received On: 17/03/2016; Accepted On: 19/04/2016; Published On: 01/09/2016 How to cite this article: Kumar SA, Debnath M, Kumar VPK; Method development and validation for estimation of Naproxen in bulk samples as well as in tablet dosage forms by using RP-HPLC; PharmaTutor; 2016; 4(9); 33-39 |
INTRODUCTION
Naproxen [(S)-6-methoxy-α-methyl-2-naphthaleneacetic acid], (Fig. 1) is a non-steroidal anti-inflammatory drug (NSAID) commonly used for the reduction of moderate to severe pain, fever, inflammation and stiffness. “It works by inhibiting both the COX-1 and COX-2 enzymes. Like other NSAIDs” [1-3]. Stability indicating simultaneous estimation of assay method for naproxen and Esomeprazole in pharmaceutical formulations by RP-HPLC is reported in literature [4]. Several chromatographic methods were reported for estimation of naproxen in raw materials, solid dosage forms mainly tablet and blood-plasma by RP-HPLC [5- 8]. Although literature survey reveals that various methods were reported for naproxen for single estimation and in combination with others drugs. However, the preparation of mobile phase was difficult and expensive; retention time was more; detection done at higher wavelength. Considering all these fact a successful attempt has been made to estimate naproxen by RP- HPLC with photo diode array detector.
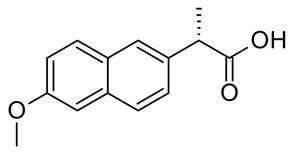
Fig. 1: Chemical Structure of Naproxen
MATERIALS AND METHOD [9-10]
Chemicals and Reagents Used: The following chemicals were used for the process: Water [HPLC Grade], Naproxen [working standards], Methanol [HPLC Grade], Ammonium acetate and Triethyl amine. All the chemicals were procured from Standard Solutions, Hyderabad, Andhra Pradesh.
0.45 µ membrane filters (Advanced Micro Devices Pvt. Ltd., Chandigarh, India) were used for filtration of various solvents and solutions intended for injection into the column.
Apparatus and Chromatographic Conditions: The equipment used was High Performance Liquid Chromatography Equipped with Auto Sampler and DAD or UV Detector. The column Kromosil-C18 ODS column (150 mm X 4.6 mm; 5 µ) was selected. The flow rate was monitored at 1.0 mL/min. The detection was carried out at 210 nm. The injection volume selected 20 µL, the temperature of the column oven was maintained at 25 °C, the detector used was Photo diode array and the run time was 7.0 min.
The ultra violet spectra of the drugs used for the investigation were taken on a Lab India UV 3000 spectrophotometer for finding out their λmax values.
Solubility of the compounds was enhanced by sonication on an ultra sonicator (Power Sonic 510, (Hwashin Technology).
All the weighings in the experiments were done with an Afcoset electronic balance. The HermLe microlitre centrifuge Z100 (model no 292 P01) was used for the centrifugation process and Remi equipments (model no- CM101DX) Cyclomixer was used.
Glassware: All the volumetric glassware used in the study was of Grade A quality Borosil.
Preparation of buffer solution [11]: The buffer solution was prepared by weighing accurately 3.85 gm of ammonium acetate and transferred in a 1000 mL beaker. Initially about 900 mL water [HPLC grade] was added for the dissolution of the buffer. Finally, the volume was made upto the mark with the diluent. The pH was adjusted to 4.0 with triethyl amine.
Preparation of mobile phase: The mobile phase was prepared by mixing a mixture of above buffer 400 mL (40 %) and 600 mL of methanol HPLC (60 %) and degas in ultrasonic water bath for 5 minutes. Then, the solution was filtered through a 0.45 µ filter under vacuum.
Preparation of standard solution of Naproxen: About 100 mg naproxen was weighed accurately and transferred into a 100 mL clean and dry volumetric flask. Initially, the drug was mixed with 7 mL of diluent. The solution was sonicated for 15 min for complete dissolution of the drug. The final volume was made up to the mark with the same solvent. From the above prepared solution, about 5 mL was pipetted out and transferred into a 100 mL clean and dry volumetric flask. Initially, the solution was mixed with 70 mL of diluent. The solution was sonicated for 15 min for complete dissolution of the drug. The final volume was made up to the mark with the same solvent to get a concentration of 50 µg/mL of Naproxen.
Preparation of sample solution of Naproxen: Twenty tablets were weighed accurately and a quantity of tablet powder equivalent to 100 mg of Naproxen was weighed and dissolved in the 70 mL mobile phase with the aid of ultra sonication for 20 min. The content was diluted with 100 mL mobile phase to furnish the preparation of stock solution. The stock solution was filtered through a 0.45 µm Nylon syringe filter and 5.0 mL of the filtrate was diluted into a 100.0 mL volumetric flask to get the desired concentration of 50.0 µg/mL of Naproxen.
System Suitability: The tailing factor for the peaks due to Naproxen in Standard solution should not be more than 2.0. The Theoretical plates for Naproxen peaks in Standard solution should not be less than 2000. The system suitability of the method was checked by injecting five different preparations of Naproxen. The parameters of system suitability were checked.
[adsense:468x15:2204050025]
VALIDATION DEVELOPMENT [12-21]
1. System Suitability: A Standard solution was prepared by using Naproxen working standards as per test method and was injected five times into the HPLC system. The system suitability parameters were evaluated from standard chromatograms by calculating the % RSD from five replicate injections for Naproxen sodium, retention times and peak areas. The data are represented in table no. 1.
Table no. 1: System Suitability data for Naproxen
|
Injection |
RT |
Peak Area |
USP Plate count |
USP Tailing
|
|
1 |
3.063 |
4437.5151 |
10168 |
1.106 |
|
2 |
3.064 |
4439.6279 |
10214 |
1.109 |
|
3 |
3.061 |
4437.5151 |
10200 |
1.110 |
|
4 |
3.059 |
4440.1612 |
10198 |
1.107 |
|
5 |
3.054 |
4446.1712 |
10210 |
1.108 |
|
Mean |
3.0602 |
4440.198 |
10198 |
1.108 |
|
SD |
0.003962 |
3.1749 |
------- |
------- |
|
% RSD |
0.129479 |
0.0715 |
------- |
------- |
2. Specificity: Solutions of standard and sample are prepared as per the test method and are injected into chromatographic system. The chromatograms of standard and sample should be identical with near retention time. The specificity is represented in fig.no.2 and 3.
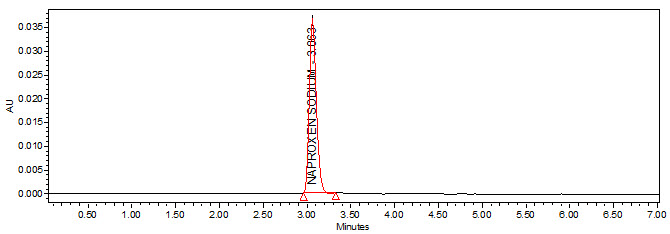
Fig. No. 2 A typical chromatogram for standard drug
NOW YOU CAN ALSO PUBLISH YOUR ARTICLE ONLINE.
SUBMIT YOUR ARTICLE/PROJECT AT editor-in-chief@pharmatutor.org
Subscribe to Pharmatutor Alerts by Email
FIND OUT MORE ARTICLES AT OUR DATABASE

Fig. No. 3 A typical chromatogram for sample drug
3. Precision: It is a measure of degree of repeatability of an analytical method under normal operation and it is normally expressed as % of relative standard deviation (% RSD). The standard solution was injected for five times and measured the area for all five injections in HPLC. The % RSD for the area of five replicate injections was found to within the specified limits. The data are represented in table no. 2 and 3.
Table no. 2: Precision results for Naproxen (System Precision)
|
Injection |
Peak Areas |
% Assay |
|
1 |
4435.56 |
100.56 |
|
2 |
4437.58 |
100.88 |
|
3 |
4435.56 |
100.78 |
|
4 |
4440.15 |
100.06 |
|
5 |
4445.13 |
101.02 |
|
Mean |
4438.796 |
100.06 |
|
SD |
62.64 |
52.3 |
|
% RSD |
1.23 |
0.09 |
Table no. 3: Precision results for Naproxen (Method Precision)
|
Injection |
Peak Areas |
% Assay |
|
1 |
4437.5151 |
100.86 |
|
2 |
4439.6279 |
100.91 |
|
3 |
4437.5151 |
100.86 |
|
4 |
4440.1612 |
100.92 |
|
5 |
4446.1712 |
100.06 |
|
6 |
4445.1312 |
101.03 |
|
Mean |
4448.67 |
100.77 |
|
SD |
58.90 |
44.5 |
|
% RSD |
1.56 |
0.08 |
4. Intermediate Precision/Ruggedness: To evaluate the intermediate precision (also known as Ruggedness) of the method, precision was performed on different day by using different make column of same dimensions. The standard solution was injected for five times and measured the area for all five injections in HPLC. The % RSD for the area of five replicate injections was found within the specified limits. The data are represented in table no. 4.
Table no. 4: Ruggedness results for Naproxen
|
Injection |
Peak Areas |
% Assay |
|
1 |
4434.01 |
100.54 |
|
2 |
4436.79 |
100.86 |
|
3 |
4439.451 |
100.12 |
|
4 |
4442.512 |
100.56 |
|
5 |
4448.112 |
100.04 |
|
6 |
4461.012 |
101.26 |
|
Mean |
4448.98 |
100.88 |
|
SD |
78.90 |
67.0 |
|
% RSD |
1.5 |
0.8 |
5. Accuracy: The accuracy of an analytical procedure expresses the closeness of agreement between the value which is accepted either as a conventional true value or an accepted reference value and value found. The standard solution with Accuracy -50, 100 and 150 % were injected into chromatographic system and calculated the amount found and amount added for Naproxen and further calculated the individual recovery and mean recovery values. The data are represented in table no. 5.
Table No. 5: Accuracy results for Naproxen
|
Concentration % of spiked level |
Amount added (mg) |
Amount found (mg) |
% Recovery |
Statistical Analysis of % Recovery |
|
|
50% Sample 1 |
24.98 |
25.02 |
99.82 |
MEAN |
99.82 |
|
50% Sample 2 |
23.89 |
24.15 |
98.89 |
|
|
|
50% Sample 3 |
24.89 |
25.14 |
98.98 |
%RSD |
0.82 |
|
100 % Sample 1 |
50.47 |
49.54 |
100.92 |
MEAN |
100.3 |
|
100 % Sample 2 |
50.45 |
50.03 |
100.83 |
|
|
|
100% Sample 3 |
51.46 |
51.2 |
100.56 |
%RSD |
1.62 |
|
150% Sample 1 |
76.03 |
74.99 |
101.38 |
MEAN |
101.5 |
|
150% Sample 2 |
75.78 |
74.66 |
101.50 |
|
|
|
150% Sample 3 |
75.86 |
74.79 |
101.42 |
%RSD |
0.62 |
6. Linearity: It is the ability of the method to elicit test result that is directly proportional to analytic concentration within a given range. It is generally reported as variance of slope or regression line. It is determined by series of three to six injections of five of more standards. Different levels of solution were prepared and injected to the chromatographic system and the peak area was measured. Plotted a graph of peak area versus concentration (on X-axis concentration and on Y-axis Peak area) and calculate the correlation coefficient. The calibration curve was represented in fig. no. 4. The data are represented in table no. 6.
Table no. 6: Linearity results for Naproxen
|
Concentration (µg/mL) |
Average Area |
Statistical Analysis |
|
|
20 |
1621.89 |
Slope y-Intercept Correlation Coefficient |
190.9x -2361 0.999 |
|
40 |
5141.73 |
||
|
50 |
7066.67 |
||
|
60 |
9054.19 |
||
|
70 |
10980.2 |
||
|
80 |
13060.1 |
||

Fig. No. 4 Calibration curve for Naproxen
Limit of Detection: The detection limit of an individual analytical procedure is the lowest amount of analyte in a sample which can be detected but not necessarily quantities as an exact value.
Limit of Detection for Naproxen: The lowest concentration of the sample was prepared with respect to the base line noise and measured the signal to noise ratio. Limit of detection is the lowest concentration of the substance that can be detected, not necessarily quantified by the method. (Regression statistics) The minimum concentration at which the analyte can be detected is determined from the linearity curve by applying the following formula.
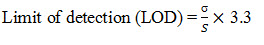
Where S - slope of the calibration curve
σ - Residual standard deviation

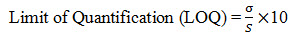
8. Limit of Quantification: It is defined as lowest concentration of analyte in a sample that can be determined with acceptable precision and accuracy and reliability by a given method under stated experimental conditions. LOQ is expressed as a concentration at a specified signal to noise ratio.
Limit of Quantification for Naproxen: The lowest concentration of the sample was prepared with respect to the base line noise and measured the signal to noise ratio. Limit of Quantification is the lowest concentration of the substance that can be estimated quantitatively. It can be determined from linearity curve by applying the following formula
9. Robustness: As part of the Robustness, deliberate change in the flow rate, mobile phase composition, temperature variation was made to evaluate the impact on the method. The standard and samples of Naproxen were injected by changing the conditions of chromatography. There was no significant change in the parameters like resolution, tailing factor, asymmetric factor, and plate count. The data are represented in table no. 7 and fig. no. 5, 6 and 7.
Table No. 7: System Suitability Results for Naproxen (Change in Flow Rate)
|
Flow 0.8 mL/min. |
Std. Area |
Tailing factor |
Flow 1.0 mL/min. |
Std. Area |
Tailing factor |
Flow 1.2 mL/min. |
Std. Area |
Tailing factor |
|
|
|
6079.40 |
1.106 |
|
4882.35 |
1.110 |
|
4076.02 |
1.123 |
|
|
5895.63 |
1.110 |
4970.64 |
1.112 |
4167.62 |
1.125 |
||||
|
5935.37 |
1.112 |
4900.20 |
1.110 |
4138.32 |
1.124 |
||||
|
6056.36 |
1.118 |
4924.73 |
1.111 |
4140.31 |
1.124 |
||||
|
6059.63 |
1.117 |
4781.37 |
1.112 |
4098.21 |
1.123 |
||||
|
Avg |
6005.081 |
1.112 |
Avg |
4891.86 |
1.111 |
Avg |
4124.10 |
1.1238 |
|
|
SD |
74.977 |
0.0044 |
SD |
62.697 |
0.00089 |
SD |
32.683 |
0.0007 |
|
|
% RSD |
1.248 |
0.4003 |
% RSD |
1.281 |
0.0804 |
% RSD |
0.7925 |
0.0065 |
|
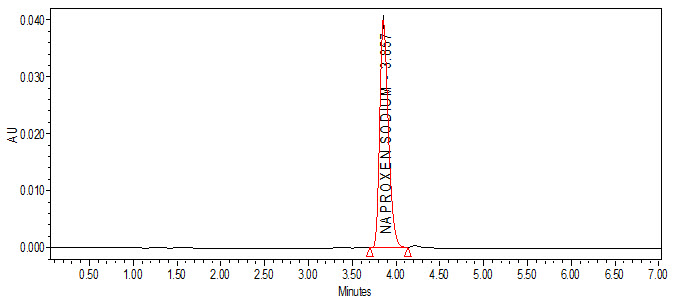
Fig. no. 5: A typical chromatogram for robustness with flow rate (for 0.8 mL/min flow)
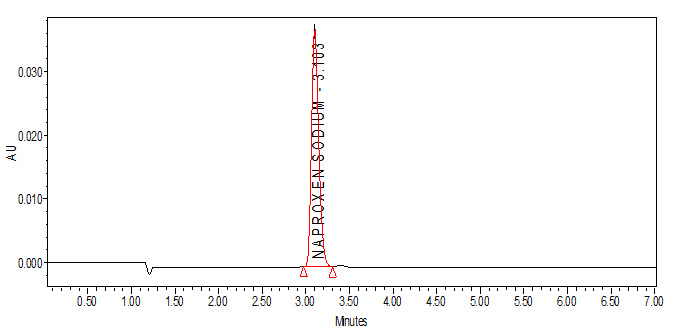
Fig. no. 6: A typical chromatogram for robustness with flow rate (for 1.0 mL/min flow)
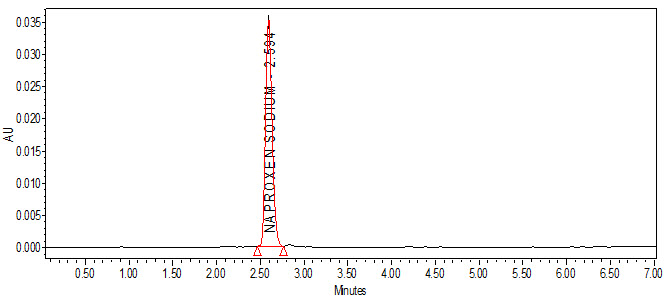
Fig. no. 7: A typical chromatogram for robustness with flow rate (for 1.2 mL/min flow)
RESULTS AND DISCUSSION
To optimize the mobile phase, various proportions of buffer (pH 4.0) with methanol [HPLC Grade] were tested. The use of buffer (pH 4.0) and methanol [HPLC Grade] in the ratio of 40:60 (v/v) resulted in peak with good shapes and resolution. A flow rate of 1.0 mL /min was found to be optimum in the 0.4-1.5 mL/min range resulting in short retention time, baseline stability and minimum noise.
By applying the proposed method, the retention time of Naproxen was observed at 3.063 min at 210 nm. Quantitative linearity was obeyed in the concentration ranges of 20-80 µg/mL for Naproxen. The relevant regression equation was y = 86.83x + 57.31
(R² = 0.999) (where y is the peak area ratio and x is the concentration of Naproxen (µg/mL)). The intra-day and inter-day drugs variations by the proposed method showed an RSD less than 2 %, indicating that the method is precise. The corresponding mean recovery was 98.89- 101.50 %. This reveals that the method is quite accurate. The tailing factor and USP plate count were 1.108 and 10198; which were within the acceptance limits. The limits of detection for Naproxen obtained by the proposed method was 0.13 µg/mL and limits of quantification for Naproxen obtained by the proposed method was 0.40 µg /mL, which indicate the sensitivity of the method. The method tolerated minor variations in optimized chromatographic conditions indicating good robustness, which indicate the efficient performance of the column.
No interfering peaks were found in the chromatograms indicating that the excipients used in tablet formulations did not interfere with the estimation of the drug by the proposed HPLC method.
CONCLUSION
The proposed HPLC method was found to be simple, precise, accurate and sensitive for the determination of Naproxen. The method was validated as per ICH guidelines and all the parameters met within the acceptance criteria. Applicability of this method for simultaneous estimation of Naproxen from tablet dosage forms was confirmed. Hence, this method is specific and can be successfully used for the estimation of Naproxen in bulk drug samples, pharmaceutical dosage forms. Hence, this method can be easily and conveniently adopted for routine quality control analysis of the above drug.
ACKNOWLEDGEMENT: The authors greatly acknowledge M/s. Pharma Train, Hyderabad, Telagana, India for providing the gift sample of Naproxen.
REFERENCES
1. http://www.drugs.com/naproxen.html.
2. http://en.wikipedia.org/wiki/Naproxen.
3. http://www.medicinenet.com/naproxen/article.htm.
4. Sripal Reddy P, Sait S, Vasudevmurthy G, Vishwanath B, Prasad V, and Jayapal Reddy S; Stability indicating simultaneous estimation of assay method for naproxen and Esomeprazole in pharmaceutical formulations by RP-HPLC; Der Pharma Chemical; 2011; 3(6); 553–564.
5. Ekpe A, Tong JH, Rodriguez L; High-performance liquid chromatographic method development and validation for the simultaneous quantitation of naproxen sodium and pseudoephedrine hydrochloride impurities; J Chromatogr Sci.; 2001; 39; 81-86.
6. Monser L, Darghouth F; Simultaneous determination of naproxen and related compounds by HPLC using porous graphitic carbon column; J Pharm Biomed Anal.; 2003; 32(4-5); 1087-1092.
7. Tashtoush B M, Al-Taani B M; HPLC determination of naproxen in plasma; Pharmazie; 2003; 58(9); 614-615.
8. Phillips T M, Wellner E F; Measurement of naproxen in human plasma by chip-based immuno affinity capillary electrophoresis; Biomed Chromatogr.; 2006; 20(6-7); 662-667.
9. Ashutosh Kumar S, Manidipa Debnath and Dr. Seshagiri Rao J. V. L. N; Simultaneous estimation of Esomeprazole and Naproxen in bulk as well as in pharmaceutical formulations by using RP-HPLC. Int J Pharm Sci Res.; 2013; 4(8); 2988-2999
10. Ashutosh Kumar S, Manidipa Debnath and Dr. Seshagiri Rao J. V. L. N.; Stability Indicating Simultaneous Estimation of Assay Method for Esomeprazole and Naproxen in Bulk as well as in Pharmaceutical Formulation by using RP-HPLC. World Journal of Pharmacy and Pharmaceutical Sciences. 2013; 2(4); 1897-1920.
11. Indian Pharmacopeia 2007, Volume I, Published by The Indian Pharmacopoeia Commission; 477-478.
12. Validation of analytical procedure: Methodology Q2B, ICH Harmonized Tripartite Guidelines; 1996; 1-8.
13. International Conference on Harmonization of Technical Requirements for Registration of Pharmaceuticals for Human Use ICH Harmonized tripartite guideline Validation of analytical procedures: Text and Methodology Q2 (R1) 6 November; 1996.
14. Ravichandran V, Shalini S, Sundram K. M and Harish Rajak; Validation of analytical methods– strategies & importance; International Journal of Pharmacy and Pharmaceutical Sciences; 2010; 2(3); 18-22
15. Tangri Pranshu, Rawat Prakash Singh, Jakhmola Vikash; Validation: A Critical Parameter for Quality Control of Pharmaceuticals; Journal of Drug Delivery & Therapeutics; 2012; 2(3); 34-40.
16. ICH harmonized tripartite guideline. Impurities in New Drug products Q3B (R2) current step 4 versions dated 2 June 2006.
17. Sharma Ajay, Sharma Rohit; Validation of analytical procedures: a comparison of ICH VS PHARMACOPOIEA (USP) and FDA; Inter National Research Journal of Pharmacy; 2012; 3(6); 39-42.
18. ICH, Validation of Analytical Procedure, Text and Methodology Q2 (R1), International conference on Harmonization, IFPMA, Geneve, Switzerland, 2005.
19. ICH harmonized tripartite guideline. Impurities in New Drug products Q3B (R2) current step 4 versions dated 2 June 2006.
20. International Conference on Harmonization, ICH Q1 A(R2); Stability Testing of New Drug Substances and Products 2003.
21. http://www.fda.gov/regulatoryinformation/guidances/ucm122049.htm.
NOW YOU CAN ALSO PUBLISH YOUR ARTICLE ONLINE.
SUBMIT YOUR ARTICLE/PROJECT AT editor-in-chief@pharmatutor.org
Subscribe to Pharmatutor Alerts by Email
FIND OUT MORE ARTICLES AT OUR DATABASE