About Authors:
Jatin Patel1*, Prof. Rajesh Kumar Dholpuria2, Dhiren Shah1
2(Professor, Head of Department of pharmacognosy),
1Seth G.L. Bihani S.D. College of Technical Education,
Institute of Pharmaceutical Sciences and Drug Research,
Sri Ganganagar, Rajasthan, INDIA
*Patelj313@yahoo.com
ABSTRACT:
Liquid chromatography is a fundamental separation technique in the life sciences and related fields of chemistry. Unlike gas chromatography, which is unsuitable for nonvolatile and thermally fragile molecules, liquid chromatography can safely separate a very wide range of organic compounds, from small-molecule drug metabolites to peptides and proteins. Traditional detectors for liquid chromatography include refractive index, electrochemical, fluorescence, and ultraviolet-visible (UV-Vis) detectors. Some of these generate two- dimensional data; that is, data representing signal strength as a function of time. Others, including fluorescence and diode- array UV-Vis detectors, generate three-dimensional data. Three-dimensional data include not only signal strength but spectral data for each point in time. Mass spectrometers also generate three- dimensional data. In addition to signal strength, they generate mass spectral data that can provide valuable information about the molecular weight, structure, identity, quantity, and purity of a sample. Mass spectral data add specificity that increases confidence in the results of both qualitative and quantitative analyses. For most compounds, a mass spectrometer is more sensitive and far more specific than all other LC detectors. It can analyze compounds that lack a suitable chromophore. It can also identify components in unresolved chromatographic peaks, reducing the need for perfect chromatography. Mass spectral data complements data from other LC detectors. While two compounds may have similar UV spectra or similar mass spectra, it is uncommon for them to have both. The two orthogonal sets of data can be used to confidently identify, confirm, and quantify compounds.
[adsense:336x280:8701650588]
Reference Id: PHARMATUTOR-ART-1502
INTRODUCTION:
The separation power of modern chromatography combined with the selectivity and very low detection limits of modern mass spectrometers enables us to analyze very complex samples with a high degree of confidence.
The development of combinations of liquid chromatography with mass spectroemtry in an on line fashion has come to a stage where such combinations become part of routine procedures for the analysis of a broad variety of samples. Since several technically very different interfaces have been devised in recent years, the major types arebriefly discussed, even though it becomes more and more clear that only a few will survive.
The most outstanding device appears to be the atmospheric pressure sources with electrospray and chemical ionization, since it covers many areas of chemical analysis in terms of polarity, lability and molecular weights.[Michael Linscheid, Westmorel, D.G,]
Why Liquid Chromatography/ Mass Spectrometryfi
Liquid chromatography is a fundamental separation technique in the life sciences and related fields of chemistry. Unlike gas chromatography, which is unsuitable for nonvolatile and thermally fragile molecules, liquid chromatography can safely separate a very wide range of organic compounds, from small-molecule drug metabolites to peptides and proteins.
Traditional detectors for liquid chromatography include refractive index, electrochemical, fluorescence, and ultraviolet-visible (UV-Vis) detectors. Some of these generate two- dimensional data; that is, data representing signal strength as a function of time. Others, including fluorescence and diode- array UV-Vis detectors, generate three-dimensional data. Three-dimensional data include not only signal strength but spectral data for each point in time.
Mass spectrometers also generate three- dimensional data. In addition to signal strength, they generate mass spectral data that can provide valuable information about the molecular weight, structure, identity, quantity, and purity of a sample. Mass spectral data add specificity that increases confidence in the results of both qualitative and quantitative analyses.
For most compounds, a mass spectrometer is more sensitive and far more specific than all other LC detectors. It can analyze compounds that lack a suitable chromophore. It can also identify components in unresolved chromatographic peaks, reducing the need for perfect chromatography. Mass spectral data complements data from other LC detectors. While two compounds may have similar UV spectra or similar mass spectra, it is uncommon for them to have both. The two orthogonal sets of data can be used to confidently identify, confirm, and quantify compounds.
Some mass spectrometers have the ability to perform multiple steps of mass spectrometry on a single sample. They can generate a mass spectrum, select a specific ion from that spectrum, fragment the ion, and generate another mass spectrum; repeating the entire cycle many times. Such mass spectrometers can literally deconstruct a complex molecule piece by piece until its structure is determined. [agilent.com]
Who Uses MSfi
Researchers and practitioners from various disciplines and sub disciplines within chemistry, biochemistry, and physics regularly depend upon MS analysis. Pharmaceutical industry workers involved in drug discovery and development rely on the specificity, dynamic range, and sensitivity of MS to differentiate closely related metabolites in a complex matrix and, thus, identify and quantify metabolites. Particularly in drug discovery, where compound identification and purity from synthesis and early pharmacokinetics are determined, MS has proved indispensable.
Biochemists expand the use of MS to protein, peptide, and oligonucleotide analysis. Using mass spectrometers, they monitor enzyme reactions, confirm amino acid sequences, and identify large proteins from databases that include samples derived from proteolytic fragments. They also monitor protein folding, carried out by means of hydrogen–deuterium exchange studies, and important protein–ligand complex formation under physiological conditions.
Clinical chemists, too, are adopting MS, replacing the less-certain results of immunoassays for drug testing and neonatal screening. So are food safety and environmental researchers. They and their allied industrial counterparts have turned to MS for some of the same reasons: PAH and PCB analysis, water quality studies, and to measure pesticide residues in foods. Determining oil composition, a complex and costly prospect, fueled the development of some of the earliest mass spectrometers and continues to drive significant advances in the technology.
Interface between LC/MS:
The combination of high-performance liquid chromatography and mass spectrometry (LC/MS) has had a significant impact on drug development over the past decade. Continual improve- ments in LC/MS interface technologies combined with powerful features for structure analysis, qualitative and quantitative, have resulted in a widened scope of application. These improvements coincided with breakthroughs in combinatorial chemistry, molecular biology, and an overall industry trend of accelerated development.
The interfacing of a liquid chromatograph to a mass spectrometer proved much more difficult than interfacing a gas chromatograph since each mol of solvent introduce into the instrument produce 22.4 l of solvent vapour, even at atmospheric pressure. The techenique has made huge advance in the last 10 years and there are many types of interface available , the most successful of which are the electrospray and atmospheric pressure ionization. [Watson, D.G]
The Interface MS detectors manipulate and detect ions in the gaseous phase; so for the MS to be useful as an HPLC detector, the mobile phase must be evaporated and sample ions must be generated. This is the function of the MS inter- face. The mobile phase must be converted from liquid to gas, an expansion in volume of 1000-fold; at the same time, the pressure must be reduced from atmos- pheric pressure (760 torr) to 10-5 to 10-6torr in the 10–20 cm fiow path of the inter- face. Pressure is reduced by pumping most of the vaporized sample and mobile phase to waste (no concentration takes place); only a tiny fraction of the sample is drawn into the MS itself.
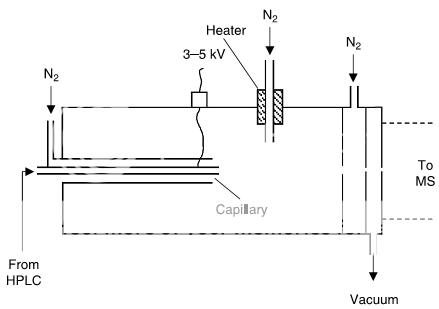
The two most popular interfaces are electrospray ionization (ESI) and atmospheric pressure chemical ionization (APCI).
The ESI interface (Fig. 1) adds a charge to analytes in the mobile phase by placing a potential (e.g., 3–5 kV) on the stainless-steel nebulizer-spray-tip (“capillary” in Fig. 1). Mobile phase is sprayed into the heated interface, where solvent evaporates, leaving ions in the gaseous state. ESI is the most commonly used interface for bioanalytical applications because it is a “softer” ionization technique and it is less likely to cause undesirable analyte degradation.
NOW YOU CAN ALSO PUBLISH YOUR ARTICLE ONLINE.
SUBMIT YOUR ARTICLE/PROJECT AT articles@pharmatutor.org
Subscribe to Pharmatutor Alerts by Email
FIND OUT MORE ARTICLES AT OUR DATABASE
The APCI interface (Fig. 2) vaporizes the mobile phase first, then uses a corona discharge to add a charge to the analyte in the gas phase. This technique isused for compounds that do not ionize well with ESI (often more stable, smaller- molecular-weight compounds and some nonpolar compounds), but uses harsher conditions, so it is more likely than ESI to cause sample degradation, especially with heat-labile compounds.
Also, APCI has been shown to have fewer matrix ion- ization problems than ESI. APCI and ESI have different ionization mechanisms, so the response and selectivity may vary significantly between the two interfaces. Either interface can be operated in the positive or negative ion mode, resulting in the generation of positively or negatively charged sample ions (most commonly achieved by adding or removing a proton from
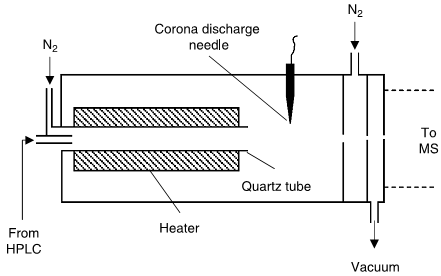
the analyte molecule.[Snyder, L.R, Dolan, J.W]
Table summaries major type of lcms interface which is used:
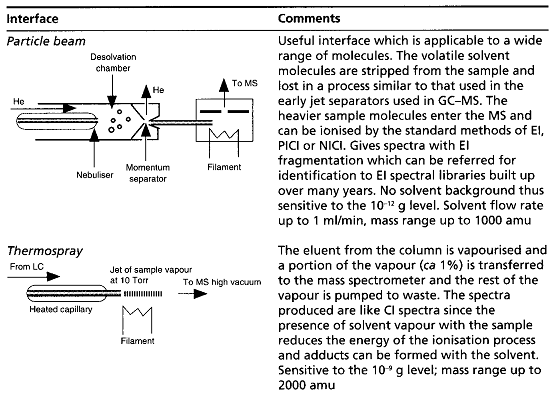
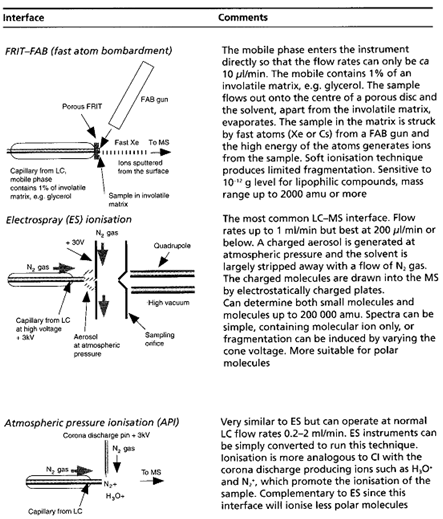
[Watson D. G]
APPLICATION:
LC/MS plays a key role in the drug discovery and drug development process. Since the introduction of electrospray ionization a variety of LC/MS applications for the pharmaceutical industry have been developed for compound identification and quantification.
LC/MS is suitable for many applications, from pharmaceutical development to environmental analysis. Its ability to detect a wide range of compounds with great sensitivity and speci- ficity has made it popular in a variety of fields.
LCMS is always the method of choice when liquid chromatography is an essential step in an analytical procedure anyway, namely for the determination of highly polar, chemically or thermally labile compounds. It is also the best method, when the detector has to be more sensitive, more specific or unknowns have to be identified. An advantage is that, at least for some of the LC/MS techniques, the development of a method needs no compromise for adaptation to mass spectrometry.
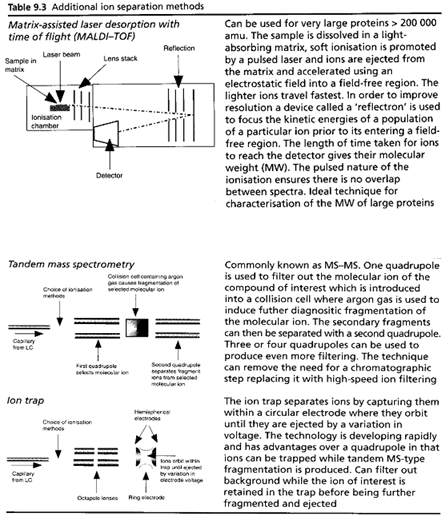
Molecular Weight Determination
One fundamental application of LC/MS is the determination of molecular weights. This information is key to determining identity.
NOW YOU CAN ALSO PUBLISH YOUR ARTICLE ONLINE.
SUBMIT YOUR ARTICLE/PROJECT AT articles@pharmatutor.org
Subscribe to Pharmatutor Alerts by Email
FIND OUT MORE ARTICLES AT OUR DATABASE
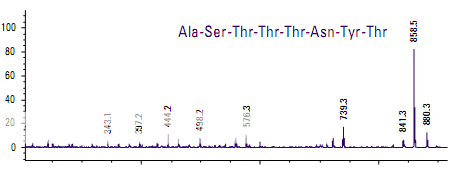
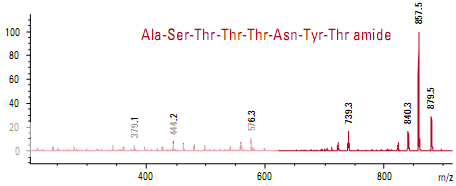
Differentiation of similar octapeptides
Figure shows the spectra of two peptides whose mass-to-charge ratios differ by only 1 m/z. The only difference in the sequence is at the C-terminus where one peptide has threonine and the other has threonine amide. The smaller fragments are identical in the two spectra, indicating that large portions of the two peptides are very similar. The larger frag- ments contain the differentiating peptides.
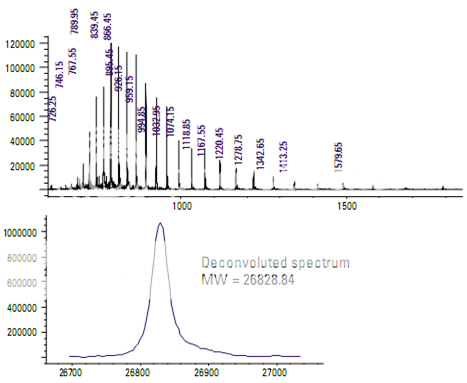
Determining the molecular weight of green fluorescent protein
Green fluorescent protein (GFP) is a 27,000- Dalton protein with 238 amino acids. It emits a green light when excited by ultraviolet light.
During electrospray ionization, GFP acquires multiple charges. This allows it to be analyzed by a mass spectrometer with a relatively limited mass (mass-to-charge) range. Mass deconvolution is then used to determine the molecular weight of the protein.
The upper part of the display in Figure shows the full scan mass spectrum of GFP. The pattern of mass spectral peaks is charac- teristic of a multiply charged analyte. Each peak represents the molecule with a different number of charges. The lower display is a deconvoluted mass spectrum generated by the data system for the singly charged analyte.
Structural Determination
Another fundamental application of LC/MS is the determination of information about molecular structure. This can be in addition to molecular weight information or instead of molecular weight information if the identity of the analyte is already known.
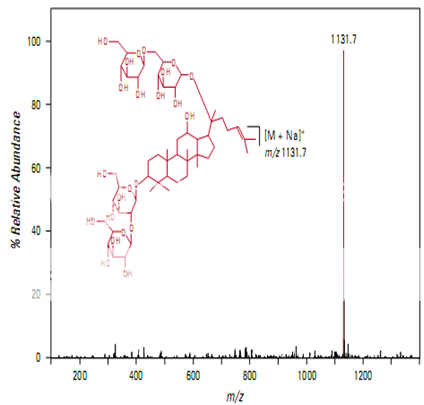
Structural determination of ginsenosides using MSanalysis
Ginseng root, a traditional Chinese herbal remedy, contains more than a dozen biologically active saponins called ginseno- sides. Since most ginsenosides contain multiple oligosaccharide chains at different positions in the molecule, structural elucidation of these compounds can be quite complicated.
MS analysis in an ion trap mass spectrometer permits multiple stages of precursor ion isolation and fragmentation. This stepwise fragmentation permits individual fragmentation pathways to be followed and provides a great deal of structural information.
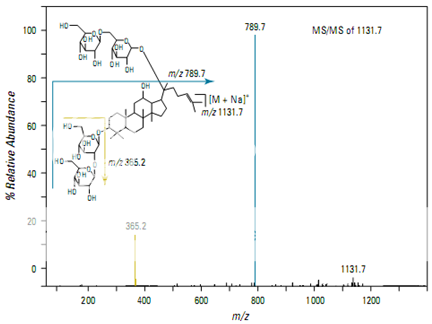
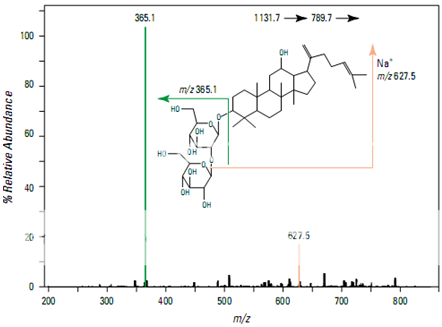
Figure shows the full scan mass spectrum from a direct infusion of the ginsenoside Rb1. The most prominent feature is the sodium adduct ion [M + Na]+ at m/z 1131.7. MS/MS of m/z 1131.7 yields a product ion at m/z 789.7 corresponding to cleavage of a single glyco- sidic bond (Figure 2). Subsequent isolation and fragmentation of m/z 789.7 (Figure 3) yields two products: a more abundant ion at m/z 365.1 corresponding to loss of the oligo- saccharide chain (–Glc 2 –Glc), and a less abundant ion at m/z 627.5 representing the loss of a deoxyhexose sugar.
Pharmaceutical Applications
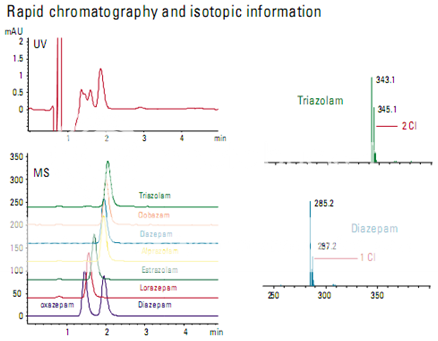
Rapid chromatography of benzodiazepines
The information available in a mass spectrum allows some compounds to be separated even though they are chromatographically unresolved. In this example, a series of benzo- diazepines was analyzed using both UV and MS detectors. The UV trace could not be used for quantitation, but the extracted ion chromatograms from the MS could be used.
The mass spectral information provides addi- tional confirmation of identity. Chlorine has a characteristic pattern because of the relative abundance of the two most abundant isotopes. In Figure , the triazolam spectrum shows that triazolam has two chlorines and the diazepam spectrum shows that diazepam has only one.
Identification of bile acid metabolites
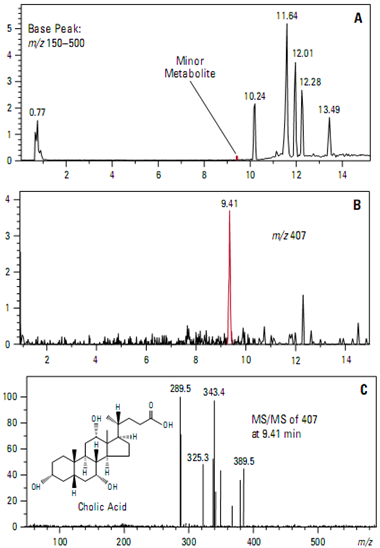
The MS capabilities of the ion trap mass spectrometer make it a powerful tool for the structural analysis of complex mixtures. Intelligent, data-dependent acquisition tech- niques can increase ion trap effectiveness and productivity. They permit the identification of minor metabolites at very low abundances from a single analysis. One application is the identification of metabolic products of drug candidates.
This example uses the in vitro incubation of the bile acid deoxycholic acid with rat liver microsomes to simulate metabolism of a drug candidate. Intelligent, data-dependent acquisition was used to select the two most abundant, relevant ions in each MS scan. These precursor ions were automatically fragmented and full scan product ion spectra collected.
Figure A shows the base peak chromato- gram. Figure B shows the extracted ion chromatogram of the [M-H]– ion at m/z 407 corresponding to a predicted minor metabolite (cholic acid) that eluted at 9.41 minutes. The full scan MS/MS product spectrum (Figure 28C) from the ion at m/z 407 confirms the identity.
Significant time was saved because the confirming MS/MS product ion spectra were acquired automatically in the same run as the full scan MS data.
NOW YOU CAN ALSO PUBLISH YOUR ARTICLE ONLINE.
SUBMIT YOUR ARTICLE/PROJECT AT articles@pharmatutor.org
Subscribe to Pharmatutor Alerts by Email
FIND OUT MORE ARTICLES AT OUR DATABASE
Biochemical Applications
Rapid protein identification using capillary LC/MS/MS and database searching
Traditional methods of protein identification generally require the isolation of individual proteins by two-dimensional gel electro- phoresis. The combination of capillary LC/MS/MS with intelligent, data-dependent acquisition and probability-based database searching makes it possible to rapidly identify as many as 100 proteins in a single analysis.
In this example, a capillary LC and ion trap mass spectrometer were used to acquire data from a mixture of five tryptically digested proteins at a concentration of 1 pmol/µl each (Figure ). Using intelligent, automated data- dependent acquisition, a full scan product ion (MS/MS) spectrum was acquire from the most abundant relevant ion in each mass scan throughout the entire run. All MS and MS/MS data were acquire from a single analysis.
Protein identification was accomplished using MASCOT software that correlated the uninterpreted MS/MS data with sequences in a database. Figure demonstrates the excellent match between the observed MS/MS spectrum from the most abundant ion (m/z 807.2) in the chromatographic peak at 17.55 minutes and the theoretical y-ion series predicted for a tryptic peptide from human apolipoprotein, one of the proteins in the sample mixture.
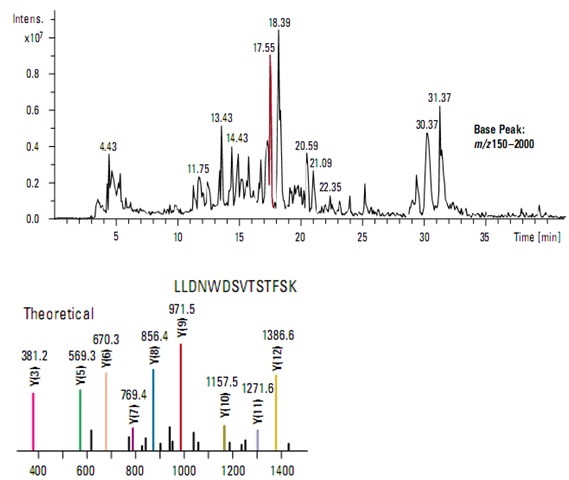
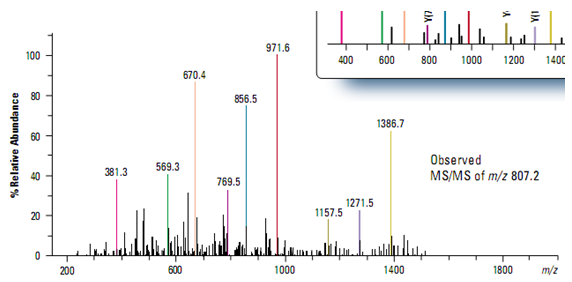
[agilent.com& Michael Linscheid. Westmorel, D.G]
Clinical Applications
Metabolite Identification
Metabolite identification is central to many of the activities in preclinical development. A more complete characterization of pharmacokinetic properties is per- formed in animals (typically, rats and dogs) during this stage. The knowledge of the biotransformation pathways of the lead candidate to its metabolites is used to indicate the magnitude and duration of activity. Metabolite identification is critical to many of these activities, and plays an important role in establishing the dose and toxicity levels. The identification of metabolite structures with LC/ MS and LC/MS/MS techniques are an effective approach due to their ability to analyze trace mixtures from complex samples of urine, bile, and plasma. The key to structure identification approaches is based on the fact that metabolites generally retain most of the core structure of the parent drug (Perchalski et al., 1982). Therefore, the parent drug and its corresponding metabolites would be expected to undergo similar fragmentations and to produce mass spectra that indicate major substructures.
Impurity Identification
Synthetic impurities are of particular concern during process research and safety evaluation activities. Often, impurities are the result of synthetic by-products or starting materials of the scale-up process. Impurities provide a comprehensive indicator of the chemical process and are diagnostic of overall quality. The resulting information is used by process chemists to guide process optimization. Knowledge of the identity and relative amount of impurities is used to diagnose process reactions so that changes in reagents and reaction conditions lead to better yields and higher quality material. Although it is often difficult to assign an exact time period for the completion of chemical process research activities, it is usually the rate-determining step for preclinical develop- ment activities. With an increasing number of novel lead candidates that enter into preclinical development, considerable resources are needed to identify impurities. LC/MS-based approaches provide integrated sample clean-up and structure analysis procedures for the rapid analysis of impurities. This advantage was demonstrated during the preclinical development of TAXOL.
LC/MS played an important role for the identification of impurities con- tained in extracts and process intermediates from Taxus brevifolia and T. baccata biomass. Because drugs derived from natural sources often have a very diverse set of structural analogs, it is important to determine which analogs are carried through the purification process and ultimately appear as impurities. This task presents a unique challenge during the preclinical stage of drug development due to the highly complex nature of the samples.
The spectrum contains abundant molecular ions atm/z 854, 871, and 912, which correspond to [M H], [M NH]4, and [M NH4CHCN]3, respectively. This distinct molecular ion pattern is used to determine the molecular weight of the resulting impuritie.[Lee, M.S, Kerns, E.H]
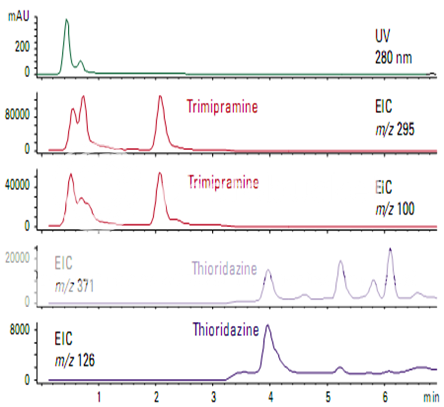
High-sensitivity detection of trimipramine and thioridazine
For most compounds, MS is more sensitive than other LC detectors. Trimipramine is a tricyclic antidepressant with sedative properties. Thioridazine is a tranquilizer. Figure shows these compounds in a urine extract at a level that could not be detected by UV. To get the maximum sensitivity from a single-quadrupole mass spectrometer, the analysis was done by selected ion monitoring.
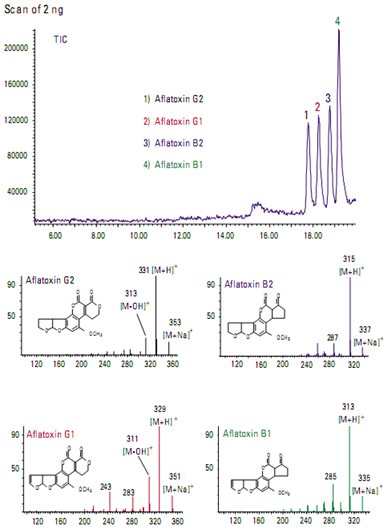
Food ApplicationsIdentification of aflatoxins in food
Aflatoxins are toxic metabolites produced in foods by certain fungi. Figure shows the total ion chromatogram from a mixture of four aflatoxins. Even though they are structurally very similar, each aflatoxin can be uniquely identified by its mass spectrum.
NOW YOU CAN ALSO PUBLISH YOUR ARTICLE ONLINE.
SUBMIT YOUR ARTICLE/PROJECT AT articles@pharmatutor.org
Subscribe to Pharmatutor Alerts by Email
FIND OUT MORE ARTICLES AT OUR DATABASE
Determination of vitamin D3in poultry feed supplements using MS
Vitamin D is an essential constituent in human and animal nutrition. Livestock diets deficient in vitamin D can cause growth abnormalities.
Traditional GC/MS analysis methods for vitamin D in feed extracts require extensive and time-consuming sample preparation and derivatization prior to analysis. Atmospheric pressure chemical ionization with ion trap detection provides a sensitive analytical method without the need for extensive sample preparation and derivatization. Further, the multiple-stage MS capability of the ion trap eliminates the need for chromatographic separation, greatly speeding analyses.
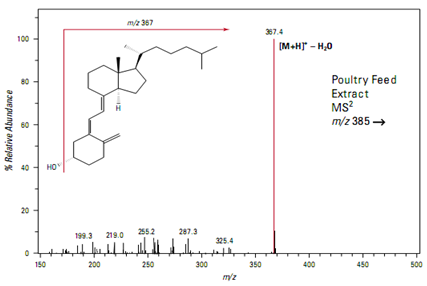
Flow injection analysis of a poultry feed extract yields a peak at m/z 385 suggesting the presence of vitamin D
Isolation and fragmentation of the precursor ion at m/z 385 is inconclusive. The full scan product ion spectrum shows a prominent peak at m/z 367 representing the loss of a single water mole- cule but little other fragmentation (Figure)
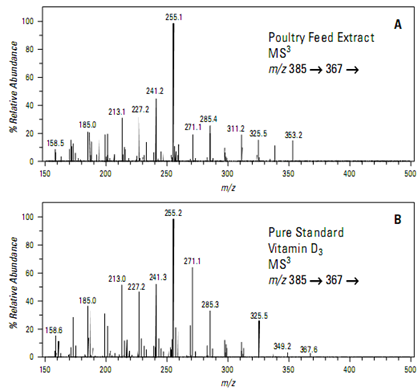
Isolation and fragmentation of the ion at m/z 367 yields a full scan MSspectrum (Figure A) rich in structurally specific product ions. This spectrum is an excellent. match with a similar analysis of a pure standard (Figure B) and conclusively confirms the presence of vitamin D3
Environmental Applications
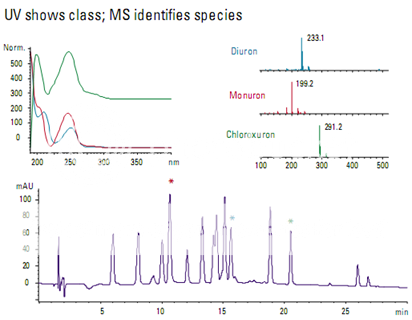
Detection of phenylurea herbicides
Many of the phenylurea herbicides are very similar and difficult to distinguish with a UV detector (Figure ). Monuron and diuron have one benzene ring and differ by a single chlorine. Chloroxuron has two chlorines and a second benzene ring attached to the first by an oxygen. The UV-Vis spectra are similar for diuron and monuron, but different for chloroxuron. When analyzed using electrospray ionization on an LC/MS system, each compound has a uniquely identifiable mass spectrum.
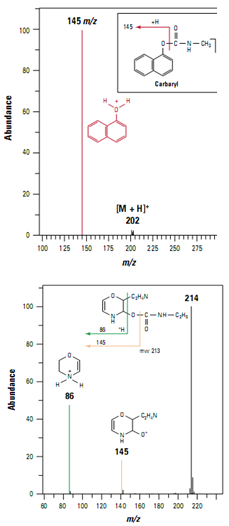
Detection of low levels of carbaryl in food
Pesticides in foods and beverages can be a significant route to human exposure. Analysis of the carbamate pesticide carbaryl in extracts of whole food by ion trap LC/MS/MS proved more specific than previous analyses by HPLC fluorescence and single-quadrupole mass spectrometry. The protonated carbaryl molecule (m/z 202) was detected in full scan mode using positive ion electrospray. A product ionat m/z 145 (Figure ) generated by collision- induced dissociation provided confirmation of carbaryl and was used for subsequent quanti- tative analysis. Ion trap analysis was more sensitive than previous analysis using a single-quadrupole mass spectrometer operating in scanning mode and more sensitive than fluorescence detection.
Ion trap LC/MS/MS also con- firmed false positives in the HPLC fluorescence analysis caused by a co eluting compound. Based on the MS/MS spectrum of the co eluting compound, a possible structure was assigned as shown in Figure .
[agilent.com& Michael Linscheid. Westmorel, D.G]
BIBLIOGRAPHY:
- Basics of LC/MS by Agilent technology available at URL agilent.com accessed on 15/7/2011. Pg.no:4-6; 20-32.
- Lee, M.S. Kerns, E.H. LC/MS application in drug development. New Jersey: Milestone Development Services Pennington. Pg.no:235-242
- Michael Linscheid. Westmorel, D.G. International union of pure and applied chemistry. vol-66. No: 9. Printed in Great Britain.
- Snyder, L.R. Dolan, J.W. High performance gradient elution the practical application of the linear-solvent-strength model. A john Wiley & sons publication. Pg.no:326-328
- Watson, D.G. Pharmaceutical analysis a text book for pharmacy student and pharmaceutical chemist. Published by Churchill Livingstone. Pg.no:186-188.
NOW YOU CAN ALSO PUBLISH YOUR ARTICLE ONLINE.
SUBMIT YOUR ARTICLE/PROJECT AT articles@pharmatutor.org
Subscribe to Pharmatutor Alerts by Email
FIND OUT MORE ARTICLES AT OUR DATABASE