{ DOWNLOAD AS PDF }
ABOUT AUTHORS:
Jadhav Santosh1*, Kharat Rekha1, Ansari Afaque2, Tamboli Ashpak3
1Department of Pharmaceutics, Sahyadri College of Pharmacy, Methwade, Sangola-413307, Solapur, Maharashtra, India.
2Department of Pharmaceutic’s, D. S. T. S Mandal’s College Of Pharmacy Solapur, Maharashtra India.
3Department of Pharmaceutical chemistry, Sahyadri College of Pharmacy, Methwade,
Sangola-413307, Solapur, Maharashtra, India.
*jadhavsan88@gmail.com
ABSTRACT:
Simple, fast and reliable spectrophotometric methods were developed for determination of Ondansetron Hydrochloride in bulk and pharmaceutical dosage forms. The solutions of standard and the sample were prepared in Distilled Water. The quantitative determination of the drug was carried out using the second order Derivative Area under Curve method values measured at 248-254nm. Calibration graphs constructed at their wavelengths of determination were linear in the concentration range of Ondansetron Hydrochloride using 2-10μg/ml (r²=0.9986) for second order Derivative Area under Curve spectrophotometric method. All the proposed methods have been extensively validated as per ICH guidelines. There was no significant difference between the performance of the proposed methods regarding the mean values and standard deviations. The developed methods were successfully applied to estimate the amount of Ondansetron Hydrochloride in pharmaceutical formulations.
INTRODUCTION
Ondansetron hydrochloride [1-2] is chemically named as 9-methyl-3-[(2-methyl-1H-imidazol-1-yl) methyl]-2, 3, 4, 9-tetrahydro-1H-carbazol-4-one, is official in IP, BP and USP [3-5]. It is 5-HT3 receptor antagonist used mainly as an antiemetic (to treat nausea and vomiting) [6]. The antiemetic activity of the drug is brought about through the inhibition of 5-HT3 receptors present both centrally (medullary chemoreceptor zone) and peripherally (GI tract) [7-8]. Literature review shows that there are developed methods including spectrophotometric, HPLC and HPTLC methods for the estimation of Ondansetron alone and in combination of other drugs like Omeprazole, Rabeprazole etc. There are developed Spectrophotometric methods [9-10] of analysis in single or in combination.
To our notice, no UV- spectrophotometric method using Second Order Derivative Area under Curve has been reported for the determination of Ondansetron Hydrochloride in bulk and tablets. Hence an attempt has been made to develop new Second Order Derivative Area under Curve spectrophotometric method for estimation of Ondansetron Hydrochloride in bulk and pharmaceutical formulations with good accuracy simplicity, precision and economy.
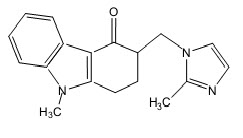
Fig. 1: Chemical structure of Ondansetron hydrochloride.
MATERIALS AND METHODS:
Derivative Spectrophotometric Methods.
Derivative spectrophotometry is a useful means of resolving two overlapping spectra and eliminating matrix interferences or interferences due to an indistinct shoulder on side of an absorption band. Derivative spectrophotometry involves the conversion of a normal spectrum to its first, second or higher derivative spectrum. In the context of derivative spectrophotometry, the normal absorption spectrum is referred to as the fundamental, zeroth order or D0 spectrum. The absorbance of a sample is differentiated with respect to wavelength λ to generate first, second or higher order derivative.
[A]= f(λ): zero order
[dA/dλ= f(λ ): first order
[d2A/dλ2]= f(λ): second order
The first derivative spectrum of an absorption band is characterized by a maximum, a minimum, and a cross-over point at the λ max of the absorption band. The second derivative spectrum is characterized by two satellite maxima and an inverted band of which the minimum corresponds to the λ max of the fundamental band.[11]
Area under curve (Area calculation)
Area under curve method involves the calculation of integrated value of absorbance with respect to the wavelength between two selected wavelengths such as λ1 and λ2 representing start and end point of curve region. The area under curve between λ1 and λ2 was calculated using UV probe software. In this study area was integrated between wavelength ranges from 248 to 254 nm.
Area calculation: 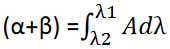
Where, α is area of portion bounded by curve data and a straight line connecting the start and end point, β is the area of portion bounded by a straight line connecting the start and end point on curve data and horizontal axis, λ1 and λ2 are wavelength range start and end point of curve region[12].
Apparatus and instrumentation:
A shimadzu 1800 UV/VIS double beam spectrophotometer with 1cm matched quartz cells was used for all spectral measurements.Single Pan Electronic balance (CONTECH, CA 223, India) was used for weighing purpose. Sonication of the solutions was carried out using an Ultrasonic Cleaning Bath (Spectra lab UCB 40, India). Calibrated volumetric glassware (Borosil®) was used for the validation study.
Materials:
Reference standard of Ondansetron HydrochlorideAPI was supplied as gift sample by Lupin Laboratory Park, Aurangabad. Tablet sample with label claim 10 mg per tablet were purchased from local market Pune.
Method development:
Preparation of Standard and Sample Solutions:
Stock solution of 10μg/ml of Ondansetron Hydrochloride was prepared in Distilled Water, Second Order Derivative Area under Curve spectrophotometric analysis. The standard solutions were prepared by dilution of the stock solution with Distilled water in a concentration range of 2, 4, 6, 8, and 10μg/ml with Distilled water for Second Order Derivative Area under Curve spectrophotometric methods. Distilled water was used as a blank solution.
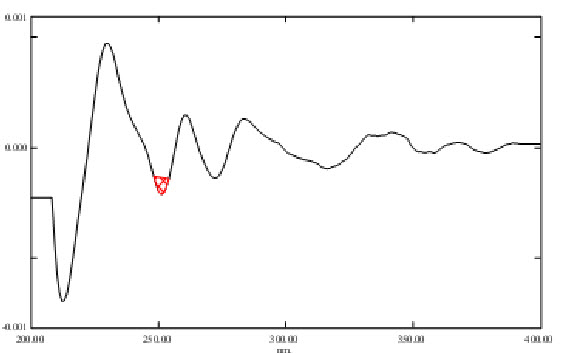
Fig. 2 Second order derivative Area under Curve spectrum of Ondansetron Hydrochloride in Distilled water (10µg/ml).
Calibration curve for Ondansetron Hydrochloride.
The dilutions were made from Standard Stock solution to get concentration of 2, 4, 6, 8, and 10µg/ml respectively. These solutions were scanned from 400 to 200 nm and Second Order Derivative Area under Curve values was integrated in the range of 248-254 nm. The calibration curve was plotted between areas under curve values against concentration.
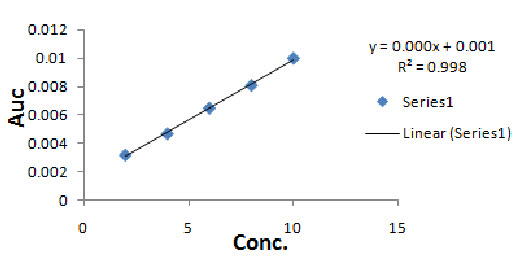
Fig. 3 Linearity of Ondansetron Hydrochloride.
Assay of tablet formulation
Twenty tablets each containing 10 mg of Ondansetron Hydrochloride were weighed crushed to powder and average weight was calculated. Powder equivalent to 10 mg of Ondansetron Hydrochloride was transferred in 100 ml of volumetric flask. A 50 ml of distilled water was added and sonicated for 15 minutes. Then solution was further diluted up to the mark with distilled water. The solution was filtered using Whatmann filter paper no. 41, first 5 ml of filtrate was discarded. This solution was further diluted to obtain 10µg/mL solution with water, subjected for UV analysis using distilled water as blank. This procedure was repeated three times.
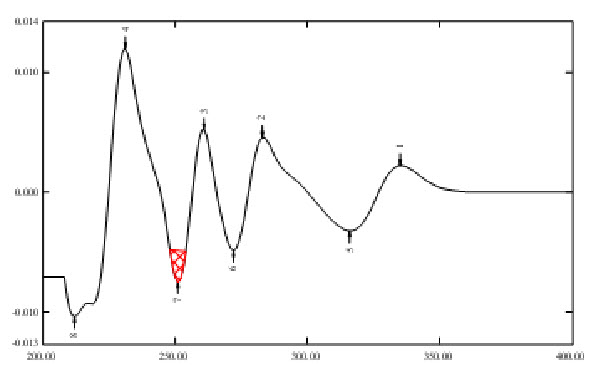
Fig. 4 Second order derivative Area under Curve spectrum of Ondansetron Hydrochloride of dosage form in Distilled water (10µg/ml).
Table 1: Assay of tablet dosage form
|
Sr.No. |
Sample Solution Concentration (µg/ml) |
Amount found (%) |
Mean % found |
%RSD |
|
1 |
10 |
98.13 |
|
|
|
2 |
10 |
98.17 |
98.14 |
0.0212 |
|
3 |
10 |
98.14 |
|
|
*n=3, SD=Standard Deviation, % RSD = % Relative Standard Deviation.
Method validation
The above method was validated for various parameters such as Accuracy, Linearity, Precision, Limit of detection (LOD) and Limit of Quantitation (LOQ) according to ICH guideline.
Accuracy
The accuracy for the analytical method was evaluated at 80%, 100% and 120% levels of 15µg/ml Sample solution. Second Order Derivative Area under curve (AUC) was measured in wavelength range 248-254 nm and results were obtained in terms of percent recovery. Three determinations at each level were performed and % RSD was calculated for each level.
Table 2: Accuracy results for Ondansetron Hydrochloride.
|
Accuracy level |
Sample conc (µg/ml) |
Std. conc |
Total amount. Added (µg/ml) |
% Recovery |
Mean % Recovery |
% RSD |
|
80 |
15 |
12 |
27 |
98.17 |
|
|
|
100 |
15 |
15 |
30 |
98.36 |
98.32 |
0.1410 |
|
120 |
15 |
18 |
33 |
98.44 |
|
|
Precision
The precision of an analytical procedure expresses the closeness of an agreement (degree of scatter) between a series of measurements obtained from multiple sampling of the same homogeneous sample under the prescribed conditions intraday precision was studied by integrating area of standard solution of 10µg/ml concentration at six independent series in the same day. Interday precission studies were performed by integrating area of standard solution of 10µg/ml concentration on three consequent days. The %RSD Was calculated.
Table 3: Precission Study.
|
Parameter |
Intra day |
Inter-day |
|
Sample sol conc. µg/ml |
10 |
10 |
|
AUC (mean) |
0.0001 |
5.7735 |
|
%RSD |
1.5604 |
0.4824 |
Limit of Detection and Limit of Quantification:
The Limit of Detection (LOD) is the smallest concentration of the analyte that gives the measurable response. LOD was calculated using the following formula
LOD = 3.3 σ /S
The Limit of Quantification (LOQ) is the smallest concentration of the analyte, which gives response that can be accurately quantified. LOQ was calculated using the following formula
LOQ = 10 σ/S
Where, σ is standard deviation of the response and
S is the slope of the calibration curve.
LO& LOQ of Ondansetron Hydrochloridewas found to be 0.4482µg/ml &1.3584µg/ml respectively.
Table 4: Summary of validation parameters
|
Parameter |
Result |
|
λ range |
248-254 |
|
Regression Equation (y=mx+c) |
Y=0.0009x+0.0014 |
|
Measured wavelength |
250nm |
|
Linearity range |
2-10µg/ml |
|
Slope |
0.0009 |
|
Intercept |
0.0014 |
|
Correlation coefficient (R2) |
0.9986 |
|
Limit of Detection (LOD)µg/ml |
0.4482 |
|
Limit of Quantitation (LOQ)µg/ml |
1.3584 |
|
Accuracy (Mean % Recovery) |
98.32 |
|
Precission (%RSD) |
1.5604 |
RESULTS AND DISCUSSION
The UV visible spectroscopic method for the Ondansetron Hydrochloride by Second order derivative Area under Curve was found to be simple, accurate, economical and reproducible. The drug concentrations were found to be linear in the range of 02-10 µg/ml and the correlation coefficient value of 0.9986 indicates that developed method was linear. For Precision the percent relative standard deviation (% RSD) was found to be 1.5604while, intra-day and inter-day precision results in terms of percent relative standard deviation values were found to be 1.5604 and 0.4824 respectively thus the method is observed as precise. The accuracy of the method was assessed by recovery studies at three different levels i.e. 80%, 100%, 120%. The values of standard deviation were satisfactory and the recovery studies were close to 100%. The % RSD value is ≤ 2 indicates the accuracy of the method. The Limit of Detection and Limit of Quantitation values were found to be 0.4482µg/ml &1.3584µg/ml respectively. The result of the analysis for pharmaceutical formulation by the developed method was consistent with the label claim, highly reproducible and reliable. The method can be used for routine quality control analysis of Ondansetron Hydrochloride in bulk and pharmaceutical formulations.
CONCLUSION
The UV spectroscopic AUC method for the analysis of Ondansetron Hydrochloride by Second order derivative Area under Curve was found to be simple, precise, and accurate, can be used for assay of bulk drug and pharmaceutical dosage formulations.
ACKNOWLEDGEMENT:
The authors are highly thankful to the Sahyadri College of Pharmacy, Methwade, Sangola, Solapur, Maharashtra, India for proving all the facilities to carry out the research work.
REFERENCES:
1. The Merck Index - An Encyclopedia of Chemicals, Drugs and Biological 2001; 13th Edn, Merck and Company, Inc., pg. 1224.
2. Patra S, Choudhury AA, Kar RK, Barik BB.; Spectrophotometric method for ondansetron hydrochloride.; Indian J Pharm Sci 2007; 69(6): 840-41.
3. Raza A, Ijaz AS, Atta-ur-Rehman, Rasheed.; Spectrophotometric determination of ondansetron hydrochloride in pharmaceutical bulk and dosage forms.; J Chin Chem Soc 2007; 54: 223-27.
4. Patel SR, Patel LJ.; Development and validation of first derivative spectroscopy method for simultaneous determination of ondansetron and metoclopramide in combined dosage form.; Int J Pharm Pharm Sci 2011; 3(4): 8588.
5. Ravi kumar P, Murali Krishna M, Bhanu prakash P, Anil kumar B and Madhusudhan P.; Derivative Spectrophotometric Estimation of Ondansetron and Paracetamol. E-J Chem 2006; 3(12): 134-36.
6. Varvara A, Crina-Maria Monciu, Corina arama, Popescu C.; Ionpair reversed-phase high performance liquid chromatography of ondansetron hydrochloride using sodium heptanesulphonate as a counterion. Farmacia. 2009; 57(4): 442-51.
7. Lin Ye and Stewart JT.; HPLC Determination of an Ondansetron and Diphenhydramine Mixture in 0.9% Sodium Chloride Injection.; J Liq Chrom Relat Tech 1996; 19(5): 711-18.
8. Ding P, Xu H, Wei G, Zheng J.; Microdialysis sampling coupled to HPLC for transdermal delivery study of ondansetron hydrochloride in rats.; Biomed Chromatogr 2000; 14(3):141-43.
9. Patel SR, Patel LJ, Thakkar YP, Patel ND.; Development and Validation of analytical method for the determination of Rabeprazole and Ondansetron in pharmaceutical dosage form by Reversed-phase HPLC.; Int J Chem Tech Res 2010; 2(3): 1531-36.
10. Venkateshwaran TG, Stewart JT, King DT.; HPLC Determination of Morphineondansetron and Meperidine Ondansetron Mixtures in 0.9% Sodium Chloride Injection.; J Liq Chrom Relat Tech 1996; 19(8): 1329-1338.
11. Shiga T, Shiga K, Kuroda M.; An online differential converter, for obtaining the first derivative of absorption spectra.; Anal Biochem 1971; 44:291-7.
12. International Conference on Harmonization (ICH) of Technical Requirements for the registration of Pharmaceuticals for Human use, Validation of Analytical Procedures Methodology; ICH-Q2(R1), Geneva, 1996; pp.1-8.
REFERENCE ID: PHARMATUTOR-ART-2353
|
PharmaTutor (Print-ISSN: 2394 - 6679; e-ISSN: 2347 - 7881) Volume 3, Issue 8 Received On: 03/04/2015; Accepted On: 10/04/2015; Published On: 01/07/2015How to cite this article: S Jadhav, R Kharat, A Ansari, A Tamboli; Middle East Respiratory Syndrome Coronavirus: An Emerging Infection; PharmaTutor; 2015; 3(8); 42-46 |
NOW YOU CAN ALSO PUBLISH YOUR ARTICLE ONLINE.
SUBMIT YOUR ARTICLE/PROJECT AT editor-in-chief@pharmatutor.org
Subscribe to Pharmatutor Alerts by Email
FIND OUT MORE ARTICLES AT OUR DATABASE