{ DOWNLOAD AS PDF }
ABOUT AUTHOR
Babu Lal
Department of Pharmacognosy,
Indo-Soviet Friendship College of Pharmacy, Moga, Punjab, India.
Babulalgughria@gmail.com
ABSTRACT
A simple, selective, precise and robust high performance thin layer chromatography (HPTLC) method was developed and validated for the determination of scopolin, in Convolvulus pluricaulis, commonly known as shankhpushpi. Aluminium backed pre-coated TLC plates (Silica gel 60F-254) of 0.2 mm thickness, were utilized to perform chromatography. The plates were developed up to 90 mm distance in twin trough glass chamber, saturated for 10 min with mobile phase system (Chloroform: methanol, 8.5:1.5, v/v). The system produces a sharp and well-defined peak for scopolin (Rf value; 0.30 ± 0.02). Scopolin was quantified in various test samples (extracts and marketed formulation) at absorbance maxima of 340 nm with the help of CAMAG TLC scanner III. The linear regression analysis data for the calibration plots (concentration Vs peak area) showed good linearity (r2 = 0.9992 ± 0.0002) in the concentration range of 20-160 ng spot−1. The method was validated in accordance with International Conference on Harmonization (ICH) guidelines. The statistical analysis of the results, indicate that the proposed method is specific, accurate and precise. Further, this method can be used for the standardization of shankhpushpi and its formulations.
INTRODUCTION
Convolvulus pluricaulis Chois., (CP) [syn. Convolvulus prostratus, Convolvulus microphyllus (Convolvulaceae)], well known as shankhpushpi, is widely used in Ayurveda, the Traditional system of medicine in India. It is considered to be one of the best Medhya Rasyana (Nervine tonic) in comparison to other rasyanas of ayurveda. The whole plant of CP has been reported for its use as brain tonic, memory enhancer, hair tonic, sedative, anti-inflammatory, antistress and hypolipidemic agent [1]. The plant also has been pharmacologically reported for its various, hypotensive [2,3], CNS depressant [4], hypnotic [5-7], anxiolytic [8], antifungal [9]and antiulcerogenic activities [10]. The different extracts (alcoholic, ethyl acetate and aqueous) of CP showed significant memory enhancing activity when tested by using Cook and Weidley’s pole climbing apparatus and active avoidance models in rodents [11].
The plant is reported to contain several constituents such as alkaloids (shankhpushpine), coumarins (scopolin, scopoletin), flavonoids (kaempferol), steroids (β-sitosterol), their glycosides [12-14] and fatty acids [15]. Recently, scopolin (Fig.1)
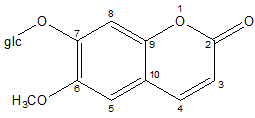
Fig. 1 Chemical structure of scopolin
7-glucoside of scopoletin has been reported for the first time from CPand the identity of the compound was confirmed by comparing the spectral data with the published values (Malik, 2010).
CP has a very important place in the herbal drug industries as it is one of the major ingredient in more than 40 herbal formulations used for enhancing memory and to treat CNS disorders. Scopoletin and scopolin, both possesses significant acetyl-cholinesterase inhibitory activity and was found to be helpful in improving the memory in case of dementia especially of Alzheimer’s type [16]. Till date, CP and its preparations are standardized only on the basis of scopoletin [17] but no method has been reported to quantify scopolin in this commercially important herb. Therefore, in the present investigation, we are proposing a validated HPTLC method for standardizing the valuable drug on the basis of another bio-active marker, scopolin which may further support the standardisation process of the plant. The proposed method was validated in compliance with ICH guidelines [18].
HPTLC is a powerful analytical tool used for the quick reference due to its reliability, simplicity and reproducibility. Moreover, the technique is cost effective as it utilizes smaller amounts of solvents with minimum sample clean up and it requires short duration of sample analysis time in comparison to high-pressure liquid chromatography (HPLC). Furthermore, it permits a simultaneous assay of several components in a multi component formulations or herbal extracts.
EXPERIMENTAL
Materials and Methods
The standard scopolin was purchased from Natural Remedies, Bangalore (India). The CP collected as a fresh material from the local areas of Risalia Khera, Dist Sirsa (Haryana) and was authenticated by Dr. H. B. Singh, National Institute of Science Communication and Information Resources (NISCAIR), New Delhi- 110067 (certificate no. 2010-11/ 1540/138). All other solvents used during the study were of analytical grade and obtained from Rankem, India.
Instrumentation and chromatographic conditions
The chromatographic analysis was performed using complete HPTLC equipment from CAMAG, Switzerland equipped with win CATS 4.02, integration software. The samples were spotted with the help of Linomat V (automatic sample applicator) in the form of bands of 8 mm width, 10 mm apart from each other on the aluminium backed (Silica gel 60F-254) pre-coated TLC plate of 0.2 mm thickness (20 × 10 cm) from (E. Merck, Germany). The constant application rate of 110 nL s-1 was employed for the sample applications. The plates were developed up to a distance of 90 mm in a twin trough glass chamber (20 × 10 cm) pre-saturated with a mobile phase (Chloroform: methanol, 8.5:1.5 v/v) for a time period of ten minute at room temperature (25 ± 2°C) with relative humidity of 55 ± 5%. The plates were carefully dried in a current of air with an hair-dryer (Philips, India) and were scanned by CAMAG TLC scanner III. The spots of the marker (scopolin) were scanned in absorbance/remission mode (with slit dimension 6 × 0.30 mm and scanning speed of 20 mm s-1) at the wavelength range of 200 to 700 nm in order to obtain its maximum wavelength. The deuterium lamp was utilized as an source of radiation.
Preparation of stock solution and calibration curve of scopolin
A stock solution of standard scopolin (1 mg mL-1) was prepared by dissolving accurately weighed 5 mg of scopolin in 5 mL methanol. The stock solution was further diluted with methanol to achieve the final concentration of 0.01 mg mL-1 of scopolin. The calibration curve for scopolin was investigated for its wide concentration range in order to cover the large variations in its concentration in the different formulations as well as in the extracts. Different volumes of final solution viz., 2, 4, 6, 8, 10, 12, 16 µL were spotted in triplicate on the TLC plate to obtain concentrations of 20, 40, 60, 80, 100, 120, 160 ng spot−1 of scopolin, respectively. The data of peak area was plotted against the corresponding concentrations of the marker and treated by least-square regression analysis method.
Preparation of test solutions
Preparation of test solution from crude drug
The shade dried coarsely powdered drug (5 g) of CP was extracted with 50 mL methanol for 6 h using Soxhlet. The extracted filtrate was concentrated under vacuum, and a final volume made (up to 50 mL) with methanol. The sample stock solution (10 µL), was applied on the TLC plate followed by development and scanning as described in the section 'Instrumentation and chromatographic conditions'. The analysis was repeated in triplicate.
Preparation of test solution for formulation(s)
Marketed formulation of Shankhpushpi under the trade name Brento® (Zandu Pharmaceutical Pvt. Ltd., Gujarat) was used in the present study. The tablets (20, 500 mg each) were powdered and 5 g of the powdered tablets was extracted with methanol (50 mL) for 6 h by soxhelation. The resultant extract filtered and concentrated to obtain a final volume of 10 mL test sample. The test solution (10 µL) was applied on the TLC plate and chromatograms allowed to develop under same chromatographic conditions as specified under the section 'Instrumentation and chromatographic conditions'.
METHOD VALIDATION
Precision
The evaluation of instrument, performed for its precision using two parameters, repeatability, and inter-mediate precision (intra and inter-day studies). In the repeatability study, the same concentration for scopolin (100 ng spot-1) was applied in nine replicas using the same syringe. Each spot was scanned nine times without changing the position of the plate. The peak area was measured and the results expressed in terms of relative standard deviation (% R.S.D) and standard error (S.E).
The intermediate precision analyzed by evaluating the sample at different concentrations using intra- and inter-day readings. Intra-day precision studies were done by applying three different concentrations of the scopolin (40, 80 and 160 ng spot-1) in triplicates and each spot was scanned three times at 4 h interval (0, 4, and 8 h), on the same day. Inter-day studies were performed by scanning the above three concentrations (of freshly prepared sample solution) at 24 and 48 h intervals.
Limit of detection and limit of quantification
In order to estimate the limit of detection (LOD) and limit of quantitation (LOQ), blank methanol was spotted three times following the same chromatographic condition as explained in section 'Instrumentation and chromatographic conditions' and the signal-to-noise ratio was determined.
Recovery studies
The pre-analyzed sample was spiked with extra 50, 100 and 150 % of the standard scopolin and the mixtures were reanalyzed by the proposed method. The experiment was conducted in triplicates. The study was performed to evaluate the accuracy and extraction efficiency of the proposed method for the determination of scopolin at different concentration levels in the different samples.
Robustness
In this study, freshly prepared standard scopolin solution was spotted (120 ng spot−1) in triplicates. The effects of slight modification in the mobile phase constitution, its volume and duration of saturation times were studied. Furthermore, the same study under three different analysts, in the same laboratory conditions was performed and percent R.S.D calculated.
Specificity
The specificity of the method was ascertained by analyzing the scopolin (standard marker) and scopolin present in the test samples. The peak at the same Rf for the scopolin marker in the samples were analyzed for their UV (ultraviolet) spectra. The peak purity of the scopolin present in the sample was analyzed by overlain spectra at three different levels, viz. peak start (S), peak apex (M) and peak end (E) positions of the spot, respectively.
RESULT AND DISCUSSION
Development and optimization of the chromatographic conditions
The TLC procedure was optimized with a view to quantify scopolin in the herbal extract and market formulation(s) containing CP as an ingredient. The development tank (twin trough chamber), presaturated for 10 min with optimized mobile phase (Chloroform : methanol ; 8.5 : 1.5 v/v) at room temperature reflects a sharp and well-defined peak at Rf = 0.30 ± 0.02 (Fig. 2).
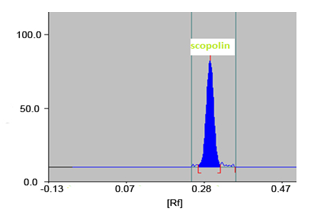
Fig. 2 Standard scopolin peak (Rf0.30 ± 0.02)
Calibration curve
The estimation of scopolin by the developed HPTLC method, showed a good correlation coefficient (r² = 0.9992 ± 0.0002) in the concentration range of 20–160 ng spot -1with respect to the peak area. The linear regression analysis showed the mean value of slope and intercept 21.386and 93.320,respectively (Fig. 3). No significant difference was observed in the slopes of standard curves (ANOVA, P < 0.05).

Fig. 3 Calibration curve of standard scopolin at different concentrations at 340 nm
Method validation
Precision
The %R.S.D and S.E for repeatability study for scopolin (100 ng spot−1) of peak areas were found to be 0.11 and 0.94%, respectively (Table 1).
Table. 1. Repeatability studies of scopolin at 100 ng spot -1concentration at 340 nm
|
Track No. |
Amount fraction (ng band-¹) |
AUC |
% R.S.D. |
S.E. |
|
1 |
100 |
2183 |
|
|
|
2 |
100 |
2225 |
||
|
3 |
100 |
2152 |
||
|
4 |
100 |
2148 |
0.11 |
0.94 |
|
5 |
100 |
2082 |
|
|
|
6 |
100 |
2200 |
AUC: area under curve; RSD: relative standard deviation; SE: standard error
The measurement of the peak area at three different concentration levels showed low values of S.E. and %R.S.D. (<1%) for inter and intra-day variation (Table 2), suggesting an excellent precision of the Instrument.
Table. 2. Results of intra- and inter-day precision studies at three different concentrations (340 nm)
|
Intra-day precision |
Inter-day precision |
||||||
|
Amount (ng spot−1) |
Mean area |
% R.S.D. |
S.E. |
Mean area |
% R.S.D. |
S.E. |
|
|
40 |
1107 |
0.060 |
0.32 |
1071 |
0.234 |
1.45 |
|
|
80 |
1795 |
0.019 |
0.02 |
1701 |
0.061 |
0.60 |
|
|
160 |
3042 |
0.148 |
2.60 |
2943 |
0.058 |
1.00 |
|
AUC: area under curve; RSD: relative standard deviation; SE: standard error
Specificity
The specificity of the method was ascertained by analyzing the spectral comparison of the peak of standard marker with the peak at same Rf in the test samples (plant extract). The overlaying spectra confirmed the specificity of the proposed method (Fig. 4)

Fig. 4. Two dimensional chromatogram of standard scopolin with test sample (plant extract) at 340 nm
Robustness
In robustness study, no major effects on the peak area was observed when changes were made (as mentioned in the section 3.4). The change in the composition of mobile phase only shifted the Rf of the peak with no significant effect on the peak area and peak purity. The low values of %R.S.D. and S.E. obtained indicates the robustness of the method (Table 3)
Table. 3. Results of robustness studies at the concentration of 120 ng spot-1
|
Parameter |
% R.S.D. |
S.E. |
|
Mobile phase composition (8 : 2 ; 8.25 : 1.75; 8.40:1.60) |
0.0297 |
0.814 |
|
Mobile phase volume (8, 10, 12) |
0.0134 |
0.375 |
|
Saturation time (10, 20, 30 min.) |
0.0282 |
0.772 |
|
Different analyst (n = 3) |
0.008 |
0.567 |
RSD: relative standard deviation; SE: standard error
Recovery studies
The proposed method had shown recovery of scopolin in the range of 98.67 to 99.34 % w/w. This shows the effective extraction efficiency and accuracy of the developed method (Table 4).
Table. 4. Results of recovery study of scopolin at 340 nm.
|
Excess of (%) analyte added |
Theoretical content (ng) |
Amount found (ng) |
Recovery (%) |
%R.S.D. |
S.E. |
|
0 |
77 |
75.90 |
98.57 |
0.091 |
0.59 |
|
50 |
115 |
113.7 |
98.89 |
0.042 |
0.41 |
|
100 |
153 |
151.9 |
99.34 |
0.017 |
0.22 |
|
150 |
230 |
226.9 |
98.67 |
0.020 |
0.29 |
RSD: relative standard deviation; SE: standard error
LOD and LOQ
LOD and LOQ of the scopolin for the purposed method were found to be 5 and 15 ng spot-1, respectively.
Scopolin content in extract and formulations
A distinguished peak at Rf = 0.30 ± 0.02 (corresponding to the Rf for standard scopolin) was observed in the chromatogram of the extract and marketed formulation along with several other peaks (Fig. 5). There was no interference in the analysis from the other components present in the extracts and formulation. The total scopolin content was found to be 0.0031 and 0.0010 (% w/w) in the crude CP extract and marketed preparation, respectively.
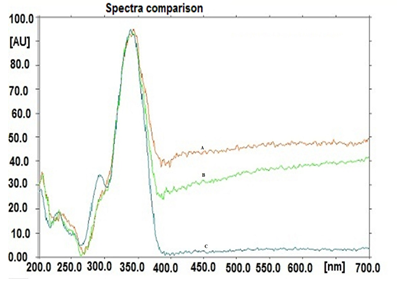
Fig. 5 Spectral comparisons of standard scopolin and scopolin presentin the test samples (200-700 nm) A: Spectra of scopolin in formulation (red color); B: Spectra of scopolin in plant extract (green color); C: Spectra of standard scopolin (blue color)
CONCLUSION
The developed HPTLC method is a precise, specific, accurate and robust for the determination of scopolin. Statistical analysis proves that the method is reproducible and selective for the analysis of scopolin. Since, the proposed mobile phase effectively resolves scopolin, the method can be used for qualitative as well as quantitative analysis of scopolin in herbal extracts and in the various preparations containing Convolvulus pluricaulis as one of its ingredient. Furthermore, the proposed method can be extended for the degradation study of scopolin under different stress conditions, as per the recommendations of ICH guidelines.
Acknowledgement
Research facilities provided by Mr. Praveen Garg, Chairman, ISF College of Pharmacy, Moga, Punjab are highly acknowledged.
REFERENCES
1. Chunekar K.C., Pandey G.S., Bhavaprakasa Nighantu - Indian Materia Medica of Sri Bhavamisra, Chaukhambha Bharati Academy, Varanasi, 2002.
2. Rakhit S., Basu N.K., Investigation on Convulvulus pluricaulis Choisy. Indian Journal of Pharmacy, 1958:20; 357-359.
3. Chaturvedi G.N., Sharma R.K., Sen S.P. Hypotensive effect of certain indigenous drugs with special reference to Shankhapuspi. Journal Research Indian Med, 1966:1(1); 57-67.
4. Sharma V.N., Barar F.S.K., Khanna N.K., Mahawar M.M. Some pharmacological actions of Convolvulus pluricaulis. An Indian indigenous herb. Indian Journal of Medical Research, 1965:53; 871-876.
5. Deshpande P.J., Prasad L. Role of indigenous drugs before anaesthesia. Journal Research Indian Med Yoga Homeo, 1978:13; 9-13.
6. Shukla S.P. A comparative study on the barbiturate hypnosis potentiation effect of medhya rasayana drugs Shankhapushpi. Bull Medic-Ethno Bot Res, 1980:1(4); 554-558.
7. Singh R.H., Mehta A.K. Studies on the psychotropic effect of the Medhya Rasayana drug. Journal Research Indian Med Yoga Homeo, 1977:12; 18-25.
8. Gupta R.C., Mudgal V. Anti-fungal effect of Convulvulus pluricaulis. Journal Research Indian Med, 1974:9; 67-69.
9. Sairam K., Rao C.V., Goel R.K.. Effect of Convulvulus pluricaulis Chois on gastric ulceration and secretion in rats. Indian Journal of Experimental Biology, 2001:39(4); 350-354.
10. Nahata A.,. Patil U.K, Dixit V.K.. Effect of Convulvulus pluricaulis Choisy. on learning behavior and memory enhancement activity in rodents. Nat Prod Res, 2008:22; 1472-1482.
11. Deshpande S.M., Srivastava D.N. Chemical studies of Convulvulus pluricaulis Choisy. Journal Indian Chem Soc, 1969:46; 759-760.
12. Chowdhary M.R., Kapoor R.C. Chemical constituents of Convolvulus microphyllus. Curr Sci, 1986:55; 917-918.
13. Bisht N.P.S., Ranbir S. Chemical studies of Convulvulus microphyllus Sieb. Planta Med, 1978:34(2); 222-223.
14. Srivastava D.N., Deshpande S.M. Gas chromatographic identification of fatty acids, fatty alcohols, and hydrocarbons of Convulvulus pluricaulis. Journal Am Oil Chem Soc, 1975:52; 318-319.
15. Rollinger J.M., Hornick A., Langer T., Stuppner H., Prast H. Acetylcholinesterase inhibitory activity of scopolin and scopoletin discovered by virtual screening of natural products. Journal Nat Prod, 2004:47; 6248-6254.
16. Kapadia N.S., Acharya N.S., Acharya S.A., Shah M.S. Use of HPTLC to establish a distinct chemical profile for Shankhpushpi and for quantification of scopoletin in Convulvulus pluricaulis Choisy and in commercial formulations of Shankhpushpi. Journal of Planar Chromatography, 2007:19; 195-199.
17. Anonymous, ICH Topic Q 2 (R1) Validation of Analytical Procedures: Text and Methodology, 2006.
REFERENCE ID: PHARMATUTOR-ART-2273
|
PharmaTutor (ISSN: 2347 - 7881) Volume 2, Issue 11 Received On: 10/09/2014; Accepted On: 14/09/2014; Published On: 01/11/2014How to cite this article: B Lal; Development of High Performance Thin Layer Chromatography Method for the Determination of Scopolin in Convolvulus Pluricaulis Chois; PharmaTutor; 2014; 2(11); 77-83 |
NOW YOU CAN ALSO PUBLISH YOUR ARTICLE ONLINE.
SUBMIT YOUR ARTICLE/PROJECT AT editor-in-chief@pharmatutor.org
Subscribe to Pharmatutor Alerts by Email
FIND OUT MORE ARTICLES AT OUR DATABASE