About Authors:
Bhupender Kumar*, Prof. Sudeep Bhardwaj, Monish Sharma, Ramchandra
Seth G.L. Bihani S.D. College of Technical Education (Institute Of Pharmaceutical Sciences
And Drug Research), Sri Ganganagar, Rajasthan, 335001
*bhupendra.nimiwal@gmail.com
ABSTRACT:
In a typical crossover design, each subject takes each of the treatments under investigation on different occasions. Comparative bioavailability or bioequivalence studies, in which two or more formulations of the same drug are compared, are usually designed as crossover studies. Perhaps the greatest appeal of the crossover design is that each patient acts as his or her own control. This feature allows for the direct comparison of treatments, and is particularly efficient in the presence of large inter individual variation. However, caution should be used when considering this design in studies where carryover effects or other interactions are anticipated. Under these circumstances, a parallel design may be more appropriate.
[adsense:336x280:8701650588]
Reference Id: PHARMATUTOR-ART-1603
1. CROSSOVER DESIGNS:
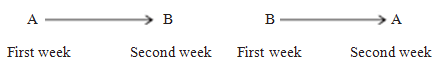
The crossover (or changeover) design is a very popular, and often desirable, design in clinical experiments. In these designs, typically, two treatments are compared, with each patient or subject taking each treatment in turn. The treatments are typically taken on two occasions, often called visits, periods, or legs. The order of treatment is randomized; that is, either A is followed by B or B is followed by A, where A and B are the two treatments. Certain situations exist where the treatments are not separated by time, e.g., in two visits or periods.
For example, comparing the effect of topical products, locations of applications on the body may serve as the visits or periods. Product may be applied to each of two arms, left and right. Individuals will be separated into two groups, (1) those with Product A applied on the left arm and Product B on the right arm, and (2) those with Product B applied on the left arm and Product A on the right arm.
This design may also be used for the comparison of more than two treatments. Crossover designs have great appeal when the experimental objective is the comparison of the performance, or effects, of two drugs or product formulations. Since each patient takes each product, the comparison of the products is based on within-patient variation. The within or intrasubject variability will be smaller than the between or intersubject variability used for the comparison of treatments in the one-way or parallel groups design. Thus crossover experiments usually result in greater precision than the parallel-groups design, where different patients comprise the two groups. The crossover design is more powerful than a parallel design in detecting product differences [Bolton Sanford]. The basic cross-over or simple reversal trial can be defined as one in which two treatments (A and B) are studied, and each animal (cow, experimental unit) receives both treatments in either of the sequences A, B or B, A.
[adsense:468x15:2204050025]
[animsci.agrenv.mcgill.ca/servers/anbreed/statisticsII/crossovr/index.html]
The crossover design is a type of Latin square. In a Latin square the number of treatments equals the number of patients. In addition, another factor, such as order of treatment, is included in the experiment in a balanced way. The net result is an N X N array (where N is the number of treatments or patients) of N letters such that a given letter appears only once in a given row or column. This is most easily shown pictorially. A Latin square for four subjects taking four drugs is shown in table 2. For randomizations of treatments in Latin squares, For the comparison of two formulations, a 2 X 2 Latin square as in table 1 (N = 2) consists of two patients each taking two formulations (A and B) on two different occasions in two “orders”.
Table 1. 2 X 2 Latin square
|
Occasion period |
||
|
Patient |
First |
Second |
|
1 |
A |
B |
|
2 |
B |
A |
The balancing of order (A-B or B-A) takes care of time trends or other ‘‘period’’ effects, if present. (A period effect is a difference in response due to the occasion on which the treatment is given, independent of the effect due to the treatment).
The 2 X 2 Latin square shown above is familiar to all who have been involved in bioavailability/bioequivalence studies. In these studies, the 2 X 2 Latin square is repeated several times to include a sufficient number of patients. Thus the crossover design can be thought of as a repetition of the 2 X 2 Latin square.
Table 2.4 X 4 Latin Square: Four Subjects Take Four Drugs
|
Order in which drugs are taken |
||||
|
Subject |
First |
Second |
Third |
Fourth |
|
1 |
A |
B |
C |
D |
|
2 |
B |
C |
D |
A |
|
3 |
C |
D |
A |
B |
|
4 |
D |
A |
B |
C |
Drugs are designated as A, B, C, D.[Bolton Sanford]
NOW YOU CAN ALSO PUBLISH YOUR ARTICLE ONLINE.
SUBMIT YOUR ARTICLE/PROJECT AT articles@pharmatutor.org
Subscribe to Pharmatutor Alerts by Email
FIND OUT MORE ARTICLES AT OUR DATABASE
1.1 Advantages:
(i) all subjects serve as own controls and error variance is reduced thus reducing sample size needed;
(ii) all subjects receive treatment (at least some of the time);
(iii) statistical tests assuming randomization can be used;
(iv) blinding can be maintained. [http://www.cebm.net]
(v) The crossover design has an advantage of increased precision relative to a parallel-groups design. Also, the crossover is usually more economical
One-half the number of patients or subjects have to be recruited to obtain the same number of observations as in a parallel design. (Note that each patient takes two drugs in the crossover.)
Often, a significant part of the expense in terms of both time and money is spent recruiting and processing patients or volunteers. The advantage of the crossover design in terms of cost depends on the economics of patient recruiting, cost of experimental observations, as well as the relative within-patient/between-patient variation. The smaller the within-patient variation relative to the between-patient variation, the more efficient will be the crossover design. Hence, if a repeat observation on the same patient is very variable.[www.cebm.net]
1.2. Disadvantages:
There are also some problems associated with crossover designs. A crossover study may take longer to complete than a parallel study because of the extra testing period. It should be noted, however, that if recruitment of patients is difficult, the crossover design may actually save time, because fewer patients are needed to obtain equal power compared to the parallel design. Another disadvantage of the crossover design is that missing data pose a more serious problem than in the parallel design. If an observation is lost in one of the legs of a two-period crossover, the data for that person carries very little information. [Bolton Sanford]
Participant variability is introduced in the comparison of the mean response between AB and BA by inflating the error term in the statistical test. [www.mail.cmu.edu.tw]
Since each subject must supply data on two occasions (compared to a single occasion in the parallel design), the chances of observations being lost to the analysis are greater in the crossover study. If an observation is lost in one of the legs of a two-period crossover, the data for that person carries very little information. When data are missing in the crossover design, the statistical analysis is more difficult and the design loses some efficiency.
Finally, the administration of crossover designs in terms of management and patient compliance is somewhat more difficult than that of parallel studies.
Perhaps the most serious problem with the use of crossover designs is one common to all Latin square designs, the possibility of interactions. The most common interaction that may be present in crossover design is a differential carryover or residual effect. This effect occurs when the response on the second period (leg) is dependent on the response in the first period, and this dependency differs depending on which of the two treatments is given during the first period.[Bolton Sanford]
1.3. Limitations :
The main limitation of crossover trials is that they pose greater inconvenience to the subjects because multiple treatments are given and the subjects will therefore be exposed to various transitions between treatment phases. This longer period of study involvement increases the chance of subject withdrawal from the study. Censored observations due to subject withdrawal have a higher impact in a crossover design study, particularly if unequal numbers of subjects have completed different phases of the trial, meaning that even partially complete data could produce biased results.
For crossover studies, it is essential that subjects are in a comparable condition at the start of each treatment period, otherwise the validity of treatment comparisons is compromised. Crossover design is therefore more appropriate for chronic diseases that have a stable set of symptoms (such as rheumatoid arthritis), while acute conditions (such as heart attacks) are less appropriate. Similarly, the crossover design is not suitable either for primary outcomes that are permanent or for terminal events (such as pregnancy or death).[www.richmondpharmacology.com]
Carryover is illustrated in Fig. 1A, where the short interval between administration of dosage forms X and Y is not sufficient to rid the body of drug when formulation X is given first. This results in an apparent larger blood level for formulation Y when it is given subsequent to formulation X. In the presence of differential carryover, the data cannot be properly analyzed except by the use of more complex designs.

Fig.1A Carryover in a bioequivalence study

Fig.1B Carryover in a bioequivalence study
Figure 1B illustrates an example where a sufficiently long washout period ensures that carryover of blood concentration of drug is absent. The results depicted in Fig.1A show a carryover effect which could easily have been avoided if the study had been carefully planned. This example only illustrates the problem; often, carryover effects are not as obvious. These effects can be caused by such uncontrolled factors as psychological or physiological states of the patients, or by external factors such as the weather, clinical setting, assay techniques, and so on. Grizzle has published an analysis to detect carryover (residual) effects. When differential carryover effects are present, the usual interpretation and statistical analysis of crossover studies are invalid. Only the first period results can be used, resulting in a smaller, less sensitive experiment.[Bolton Sanford]
That most of the time, in these cases, the parallel design is probably more efficient. Therefore, if differential carryover effects are suspected prior to implementation of the study, an alternative to the crossover design should be considered.
Because of the “built-in” individual-by-individual comparisons of products provided by the crossover design, the use of such designs in comparative clinical studies often seems very attractive. However, in many situations, where patients are being treated for a disease state, the design is either inappropriate or difficult to implement. In acute diseases, patients may be cured or so much improved after the first treatment that a “different” condition or state of illness is being treated during the second leg of the cross-over. Also, psychological carryover has been observed, particularly in cases of testing psychotropic drugs.
The longer study time necessary to test two drugs in the crossover design can be critical if the testing period of each leg is of long duration. Including a possible washout period to avoid possible carryover effects, the crossover study will take at least twice as long as a parallel study to complete. In a study of long duration, there will be more difficulty in recruiting and maintaining patients in the study. One of the most frustrating (albeit challenging) facets of data analysis is data with “holes”, missing data. Long-term crossover studies will inevitably have such problems.[Bolton Sanford]
NOW YOU CAN ALSO PUBLISH YOUR ARTICLE ONLINE.
SUBMIT YOUR ARTICLE/PROJECT AT articles@pharmatutor.org
Subscribe to Pharmatutor Alerts by Email
FIND OUT MORE ARTICLES AT OUR DATABASE
2. BIOAVAILABILITY STUDIES:
Bioavailability/Bioequivalence Studies are particularly amenable to crossover designs. “Bioequivalence” refers to a procedure that compares the bioavailability of a drug from different formulations.
Bioavailability is defined as the rate and extent to which the active ingredient or active moiety is absorbed from a drug product and becomes available at the site of action.
The rate and extent to which the active ingredient or active moiety is absorbed from a drug product and becomes available at the site of action. (21 CFR 320.1. US)
For drug products that are not intended to be absorbed into the bloodstream, bioavailability may be assessed by measurements intended to reflect the rate and extent to which the active ingredient or active moiety becomes available at the site of action. Products containing such drugs are usually assessed using a clinical end point, using parallel designs. [Lachman Leon, 1991]
Statistical methodology, In general, methods presented for drugs that are absorbed. Thus, concerned with measures of the release of drug from a formulation and its availability to the body. Bioequivalence can be simply defined by the relative bioavailability of two or more formulations of the same drug entity.Bioequivalence is an important part of an NDA in which formulation changes have been made during and after pivotal clinical trials. Bioequivalence studies, as part of ANDA submissions, in which a generic product is compared to a marketed, reference product, are critical parts of the submission. Bioequivalence studies may also be necessary when formulations for approved marketed products are modified. In general, most bioequivalence studies depend on accumulation of pharmacokinetic (PK) data that provide concentrations of drug in the bloodstream at specified time points following administration of the drug. These studies are typically performed, using oral dosage forms, on volunteers who are incarcerated (housed) during the study to ensure compliance with regard to dosing schedule as well as other protocol requirements. This does not mean that BE studies are limited to oral dosage forms. Any drug formulation that results in measurable blood concentrations after administration can be treated and analyzed in a manner similar to drugs taken orally. For drugs that act locally and are not appreciably absorbed, either a surrogate endpoint may be utilized in place of blood concentrations of drug (e.g., a pharmacodynamic response) or a clinical study using a therapeutic outcome may be necessary. Also, in some cases where assay methodology in blood is limited, or for other relevant reasons, measurements of drug in the urine over time may be used to assess equivalence. To measure rate and extent of absorption for oral products, pharmacokinetic (PK) measures are used. In particular, model independent measures used are (a) area under the blood concentration versus time curve (AUC) and the maximum concentration (Cmax), which are measures of the amount of drug absorbed and the rate of absorption, respectively. The time at which the maximum concentration occurs (Tmax) is a more direct measure as an indicator of absorption rate, but is a very variable estimate.
Thus the disadvantages of the crossover design in long term, chronic dosing studies are not apparent in bioavailability studies. With an appropriate washout period between doses, the crossover is ideally suited for comparative bioavailability studies.
Statistical applications are essential for the evaluation of bioequivalence studies. Study designs are typically two-period, two-treatment (tttp) crossover studies with single or multiple (steady state) dosing, fasting or fed. Designs with more than two periods are now becoming more common, and are recommended in certain cases by the FDA. For long half-life drugs, where time is crucial, parallel designs may be desirable, but these studies use more subjects than would be used in the crossover design, and the implementation of parallel studies may be difficult and expensive. The final evaluation is based on parameter averages derived from the blood level curves, AUC, Cmax and tmax. Statistical analyses that have been recommended are varied, and the analyses presented here are typical of those recommended by regulatory agencies.
Carryover may be observed if administration of a drug affects the blood levels of subsequent doses. Although possible, a carryover effect would be very unusual, particularly in single dose studies with an adequate wash-out period. A wash-out period of 7 half-lives is recommended.
A differential carryover effect can invalidate the second period results in a two-period Crossover. Because bioequivalence studies compare the same drug in different formulations, if a carryover exists at all, the carryover of two different formulations would not be expected to differ.
In the typical two-period, two-treatment (tttp) design,
The features of the tttp design follow:
1. N subjects recruited for the study are separated into two groups, or two treatment sequences. N1 subjects take the treatments in the order AB, and N2 in the order BA, where N1+ N2 = N. For example, 24 (N) subjects are recruited and 12 (N1) take the Generic followed by the Brand product, and 12 (N2) take the Brand followed by the Generic. Note that the product may be taken as a single dose, in multiple doses, fasted or fed.
2. After administration of the product in the first period, blood levels of drug are determined at suitable intervals.
3. A wash-out period follows, which is of sufficient duration to ensure the “total” elimination of the drug given during the first period. An interval of at least nine drug half-lives should be sufficient to ensure virtually total elimination of the drug. Often, a minimum of 7 half-lives is recommended.
4. The alternate product is administered in the second period and blood levels determined as during Period 1.

Crossover designs are planned so that each treatment is given an equal number of times in each period. This is most efficient and yields unbiased estimates of treatment differences if a period effect is present.
The blood is analyzed for each subject with both first and second periods analyzed concurrently (the same day). To detect possible analytical errors, the samples are usually analyzed chronologically (starting from the time 0 sample to the final sample), but with the identity of the product assayed unknown (sample blinding).
After the blood assays are complete, the blood level vs. time curves are analyzed for the derived parameters, AUCt (also noted as AUCo-t), AUCo -∞, Cmax, and tmax, for each analyte. AUCt is the area to the last quantifiable concentration, and AUCinf is AUCt augmented by an estimate of the area from time t to infinity (Ct/ke).
According to Fig.2. The analysis of the data consists of first determining the maximum blood drug concentration (Cmax) and the area under the blood level vs. time curve (AUC) for each subject, for each product. Often, more than one analyte is observed, e.g., metabolites or multiple ingredients, all of which may need to be separately analyzed.

Fig.2 Derived parameters from bioequivalence study.
The present FDA requirement for equivalence is based on product ratios using a symmetric 90%confidence interval for the difference of the average parameters, after a log transformation.
According to FDA Guidelines, the AUC and Cmax were analyzed using the untransformed values of these derived parameters. Note that when using a clinical or pharmacodynamic endpoint (such as may be used in a parallel study when drug is not absorbed).
3. STATISTICAL ANALYSIS
The results of a typical single-dose bioequivalence study are shown in Table 3. These data were obtained from drug plasma level versus time determinations similar to those illustrated in Fig.1B. Area under the plasma level versus time curve (AUC, a measure of absorption), time to peak plasma concentration (tp), and the maximum concentration (Cmax) are the parameters which are usually of most interest in the comparison of the bioavailability of different formulations of the same drug moiety.
The typical ANOVA for crossover studies will be applied to the AUC data to illustrate the procedure used to analyze the experimental results. In these analyses, the residual error term is used in statistical computations, e.g., to construct confidence intervals. An analysis of variance (ANOVA) is computed for each parameter based on the model. A critical assumption for the correct interpretation of the analysis is the absence of differential carryover effects. Otherwise, the usual assumptions for ANOVA should hold. FDA statisticians encourage a careful statistical analysis of crossover designs. In particular, the use of a simple t test which ignores the possible presence of period and/or carryover effects is not acceptable. If period effects are present, and not accounted for in the statistical analysis, the analysis will be less sensitive. The error mean square in the ANOVA will be inflated due to inclusion of the period variance, and the width of the confidence interval will be increased. If differential carryover effects are present, the estimate of treatment differences will be biased.
The usual analysis of variance separates the total sum of squares into four components: subjects, periods, treatments, and error (residual). In the absence of differential carryover effects, the statistical test of interest is for treatment differences. The subject and period sum of squares are separated from the error term which then represents ‘‘intrasubject’’ variation. The Subjects sum of squares (SS) can be separated into Sequence SS and Subject within Sequence SS to test for the sequence effect.
The AUC data from Table 3 are analyzed below. To ease the explanation, the computations for the untransformed data are detailed. The log-transformed data are analyzed identically, and these results follow the untransformed data analysis. The sums of squares for treatments and subjects are computed exactly the same way as in the two-way analysis of variance. The new calculations are for the ‘‘period’’ (1 d.f.) and ‘‘sequence’’ (1 d.f.) sums of squares.
Table 3 Data for the Bioequivalence Study Comparing Drugs A and B
|
Subject |
Order |
AUC |
Peak concentration |
Time to peak |
|||
|
A |
B |
A |
B |
A |
B |
||
|
1 |
AB |
290 |
210 |
30 |
18 |
8 |
8 |
|
2 |
BA |
201 |
163 |
22 |
19 |
10 |
4 |
|
3 |
AB |
187 |
116 |
18 |
11 |
6 |
6 |
|
4 |
AB |
168 |
77 |
20 |
14 |
10 |
3 |
|
5 |
BA |
200 |
220 |
18 |
21 |
3 |
3 |
|
6 |
BA |
151 |
133 |
25 |
16 |
4 |
6 |
|
7 |
AB |
294 |
140 |
27 |
14 |
4 |
10 |
|
8 |
BA |
97 |
190 |
16 |
23 |
6 |
6 |
|
9 |
BA |
228 |
168 |
20 |
14 |
6 |
6 |
|
10 |
AB |
250 |
161 |
28 |
19 |
6 |
4 |
|
11 |
AB |
293 |
240 |
28 |
18 |
6 |
12 |
|
12 |
BA |
154 |
188 |
16 |
20 |
8 |
8 |
|
|
Mean |
209.4 |
167.2 |
22.3 |
17.3 |
6.4 |
6.3 |
|
|
Sum |
2513 |
2006 |
268 |
207 |
77 |
76 |
NOW YOU CAN ALSO PUBLISH YOUR ARTICLE ONLINE.
SUBMIT YOUR ARTICLE/PROJECT AT articles@pharmatutor.org
Subscribe to Pharmatutor Alerts by Email
FIND OUT MORE ARTICLES AT OUR DATABASE
We first show the analysis for periods. The analysis for sequence is shown when discussing the test for differential carryover. Two new columns are prepared for the ‘‘period’’ calculation. One column contains the data from the first period, and the second column contains data from the second period. For example, for the AUC data in Table 3, the data for the first period are obtained by noting the order of administration. Subject 1 took product A during the first period (290); subject 2 took B during the first period (163); and so on. Therefore, the first period observations are
290, 163, 187, 168, 220, 133, 294, 190, 168, 250, 293 & 188 (sum = 2544)
The second period observations are
210, 201, 116, 77, 200, 151, 140, 97, 228, 161, 240 & 154 (sum = 1975)
The ‘‘period’’ sum of squares may be calculated as follows:
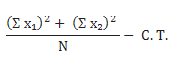
where and Σ X1 and Σ X2 are the sums of observations in the first and second periods, respectively, N is the number of subjects, and C.T. is the correction term. The following analysis of variance and Table 3 will help clarify the calculations.
Calculations for ANOVA:
Σ Xt is the sum of all observations = 4519
Σ XA is the sum of observations for product A = 2513
Σ XB is the sum of observations for product B = 2006
Σ P1 is the sum of observations for period 1 = 2544
Σ P2 is the sum of observations for period 2 = 1975
ΣX2t is the sum of the squared observations = 929321
C.T. is the correction term (Σ Xt)2/Nt =
(4519)2
-------- = 850890.04
24
Σ Si is the sum of the observations for subject i (e.g., 500 for first subject)
Total sum of squares = ΣX2t - C.T. = 78430.96
Table 4 Data for AUC for the Bioequivalence Study Comparing Drugs A and B
|
Group I (Treatment A first, B second) |
Group II (Treatment B first, A second) |
||||||
|
Subject |
A |
B |
Total |
Subject |
A |
B |
Total |
|
1 |
290 |
210 |
500 |
2 |
201 |
163 |
364 |
|
3 |
187 |
116 |
303 |
5 |
200 |
220 |
420 |
|
4 |
168 |
77 |
245 |
6 |
151 |
133 |
284 |
|
7 |
294 |
140 |
434 |
8 |
97 |
190 |
287 |
|
10 |
250 |
161 |
411 |
9 |
228 |
168 |
396 |
|
11 |
293 |
| |||||