

About Author:
Hardik Patel*, Sagar Solanki
Department of Pharmaceutical Chemistry,
K.B.Raval College of Pharmacy, Shertha,
Gandhinagar-382423, Gujarat, India.
*patel1928@yahoo.in
ABSTRACT
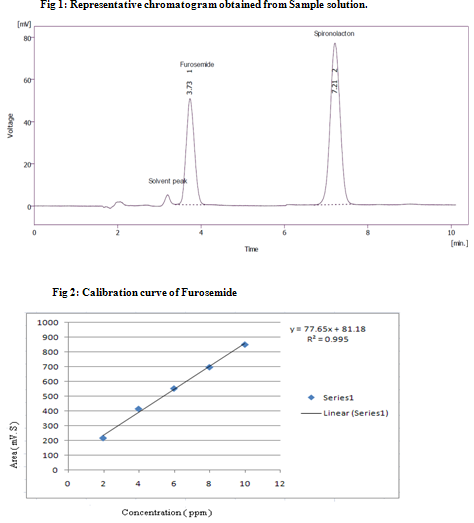
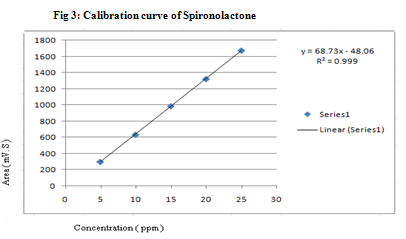
A new, simple, rapid, accurate, precise and sensitive method has been developed for the simultaneous estimation of Furosemide and Spironolactone in their combined tablet dosage form. The method was carried out on a Hiber C18 column (250 mm×4.6mm, i.d.5 μm) with a mobile phase consisting of acetonitrile: water at a flow rate of 1 ml/min and the detection was carried out at 237 nm. The retention time of Furosemide and Spironolactone was 3.81 min and 7.28 min. respectively. Linearity for Furosemide and Spironolactone were found in the range of 2-10 μg/ml and 5-25 μg/ml respectively. The developed method was validated in terms of linearity, accuracy, and precision, limit of detection (LOD) and limit of quantification (LOQ). The proposed method can be used for estimation of both drugs in their combined dosage form.
Reference Id: PHARMATUTOR-ART-1379
[adsense:336x280:8701650588]
INTRODUCTION
Furosemide is chemically 4-Chloro-2-(furan-2-ylmethylamino)-5-sulfa Moylbenzoic acid. Furosemide, an anthranilic acid derivative, is a potent diuretic that inhibits the active reabsorption of chloride in the diluting segment of the loop of Henle, thus preventing the reabsorption of sodium, which passively follows chloride. It is an official drug in IP & BP. Few analytical methods by RP-HPLCand spectrophotometric methodsusing pharmaceutical dosage forms have been reported for the estimation of Furosemide. Spironolactone is a synthetic 17-lactone drug that is a renal competitive aldosterone antagonist in a class of pharmaceuticals called potassium-sparing diuretics, used primarily to treat heart failure, ascites in patients with liver disease, low-renin hypertension, hypokalemia and Conn's syndrome. It is an official drug in IPand BP. There are very few analytical methods reported for the estimation of Spironolactone which includesHPLC, Spectrophotometry.
The combination of Furosemide and Spironolactone is very useful in the treatment of heart failure. Spironolactone prevents hypokalaemia due to Furosemide in their combined dosage forms.On literature survey, it was found that only Ratio Spectra Derivative Spectrophotometry methodhas been reported for the simultaneous estimation of Furosemide and Spironolactone in combined dosage form and no method is available in the pharmacopoeias.
[adsense:468x15:2204050025]
MATERIAL AND METHOD
Chemicals and reagents
Tablet used for analysis was Spiromide manufacturedby RPG Life sciences, Ankleshwar, India containingFurosemide 20mg and Spironolactone 50 mg per tablet. API of Furosemide was kindly supplied as a gift sample by Nucleus Heem- Deep organics, Ankleshwar, Gujarat. Spironolactone was gifted by Torrent RPG life sciences, Ankleshwar, Gujarat.
Instrumentation and chromatographic condition
The LC system (YL-9100) consisted of following components: YL9160 PDA detector, YL9101 vacuum degasser and YL9110 quaternary solvent delivery pump. Chromatographic analysis was carried out on a Hiber C18 column (250 mm×4.6mm, i.d.5 μm) using mobile phase acetonitrile: water with flow rate of 1ml/min. Detection of eluent was made at 237 nm by PDA detector.The column was maintained at room temperature and injection volume of 20μl was used. The mobile phase was filtered through 0.45μm Chrom Tech Nylon-66 filter paper.
Preparation of standard solution
Standard stock solution of pure drugs were prepared separately by dissolving 10 mg of each drug with Acetonitrile in 10 ml of volumetric flask and made up to volume to get concentration of 1000 μg/ml. 1 ml from stock solution of Furosemide and 1 ml from stock solution of Spironolactone were transferred in 10 ml of volumetric flask and made up to volume with Acetonitrile separately to get a concentration of 100 μg/ml. 0.4 ml stock solution of furosemide And 1 ml stock solution of spironolactone were mixed in 10 ml volumetric flask and made up to volume with Acetonitrile to get concentration of 4 μg/ml of Furosemide and 10 μg/ml of Spironolactone.
Preparation of sample solution
Twenty tablets were weighed accurately and powdered. A quantity of tablet powder equivalent to 50 mg of Spironolactone was transferred to 50 ml volumetric flask containing 40 ml of mobile Acetonitrile, gentle shaking was carried out for 5min and ultrasonicated for 5 min. The volume was made up to the mark with Acetonitrile. The tablet sample solution was filtered through Whatman filter paper no.41. 1 ml of filtrate was further diluted to 10 ml with Acetonitrile to get 100 μg/ml concentrations. From the above solution 1 ml was further diluted to 10 ml with mobile Acetonitrile to get the final concentration 10 μg/ml. After setting the chromatographic conditions and stabilizing the instrument to obtain a steady baseline, the tablet sample solution was injected, chromatogram was obtained and the peak areas were recorded. The injections were repeated six times and the amount of each drug present in tablet was estimated from their respective calibration curve (Table-1).
Method validation
The method was validated for linearity, accuracy, intraday and interday precision, LOD and LOQ, in accordance with ICH guidelines.
Linearity
Aliquots of 0.2,0.4,0.6,0.8 and 1 ml from100 μg/ml standard solution of Furosemide and aliquots 0.5, 1, 1.5, 2 and 2.5 ml from 100 μg/ml standard solution of Spironolactone transferred to series of 10 ml volumetric flasks and made up to volume with Acetonitrile. Each solution was injected and chromatogram was recorded. Retention time (mean ± s.da) of Furosemide and Spironolactone were found to be and min respectively. The peak area of Furosemide and Spironolactone in each chromatogram was recorded.
s.da= standard deviation.
Accuracy
To study accuracy of the method, recovery studies were carried out by addition of standard drug sample in a tablet sample at 50%, 100% and 150%. The percentage of recovery was calculated (Table-3).
Precision
It was carried out by preparing 3 replicates of 3 different concentrations within the linearity range and then injecting each solution. The peak area of Furosemide and Spironolactone in each chromatogram was recorded in order to record any intra day variation. To record inter day variation, 3 different concentration solution within the linearity range were analyzed for 3 different days. The peak area of each drug was recorded and % RSD (% relative standard deviation) was calculated for both series of analysis.
Limit of detection (LOD) and limit of quantification (LOQ)
They were calculated as 3.3 σ/S and 10 σ/S respectively. Where σ is the standard deviation of the response (y- intercept) and S is the mean of the slope of calibration plot.
NOW YOU CAN ALSO PUBLISH YOUR ARTICLE ONLINE.
SUBMIT YOUR ARTICLE/PROJECT AT articles@pharmatutor.org
Subscribe to PharmaTutor Alerts by Email
FIND OUT MORE ARTICLES AT OUR DATABASE
RESULTS AND DISCUSSION
For RP-HPLC method, several different mobile phases were tried and finally mobile phase containing acetonitrile: water was found to be optimized and well defined. Resolved peaks of Furosemide and Spironolactone with retention time (mean ± s.d.)3.81 min and 7.28 min were obtained for Furosemide and Spironolactone respectively. The representative chromatogram of sample solution of Furosemide (4 μg/ml) and Spironolactone (10 μg/ml) is shown in Fig 1. The calibration curve for each drug was obtained separately by plotting as peak area → concentration over the range of 2-10 μg/ml for Furosemide and 5 -25 μg/ml for Spironolactone. From, calibration curve of Furosemide (Fig 2), it was found to linear with r2= 0.995 and from calibration curve of Spironolactone (Fig 3) it was found to linear with r2= 0.999. The % recoveries for Furosemide and Spironolactone were found to be 99.25%-101.45% and 99.1%-100.26% respectively, which were satisfactory (Table-3). The precision is usually expressed as % RSD. The intraday precision for Furosemide and Spironolactone were found to be 0.09-1.181 and 0.863-1.585 respectively. The inter day precision for Furosemide and Spironolactone were found to be 0.096-1.623 and 0.044-1.22 respectively. The limit of detection (LOD) for Furosemide and Spironolactone were 0.0025μg/ml and 0.00099 μg/ml respectively. The limit of quantification (LOQ) for Furosemide and Spironolactone were 0.00033 μg/ml and 0.00302 μg/ml respectively.
CONCLUSION
The validated RP-HPLC method employed here is simple, rapid, accurate, precise, sensitive and cost effective which can be used for routine analysis of Furosemide and Spironolactone in combined pharmaceutical dosage form.
ACKNOWLEDGEMENT
The authors are thankful to the Principal and management, K.B.Raval college of Pharmacy, Shertha, Gandhinagar (Gujarat), India for providing the required facilities to carry out this research work. Also thankful to Heem-deep organics, Ankleshwar and RPG Life sciences, Ankleshwar to providing Furosemide and Spironolactone API.
REFERENCES
1. en.wikipedia.org/wiki/Furosemide.
2. Dimock K; Rang HD, Dale MM, Rithel SM, Flower RJ. Rang and Dale’s pharmacology. 6th ed. London: Elsevier; 2007. p. 375.
3. Indian Pharmacopoeia. Indian Pharmacopoeia Commission, Ghaziabad; 2010 vol 2. P.1391.
4. British Pharmacopoeia. Ph Euro monograph 1590. London, Medicines and health care products regulatory agency (MHRA); 2003 vol 1. p.854.
5. en.wikipedia.org/wiki/Spironolactone.
6. Joel GH, Lee EL, Alfred GG. Goodman and Gilman’s the pharmacological basis of therapeutics. 11th Ed. New York: Mc Graw Hill; 2001. p. 743,853.
7. Indian Pharmacopoeia. Indian Pharmacopoeia Commission, Ghaziabad; 2010 vol 3. p.2147.
8. British Pharmacopoeia. Ph Euro monograph 1590. London, Medicines and Health care products Regulatory Agency (MHRA); 2003 vol 2. p.1742.
9. O’Neil MJ. The Merck index- an encyclopedia of chemicals, drugs and biological. 13th Ed. New Jersy: Merck and Co., INC. p.764, 1562.
10. Sweetman SC. Martindale; the complete drug reference. 33rd ed. London: Pharmaceutical press; 2002. P.893-6,973-5.
11. Dias ILT, Martins JLS, Neto GO. Determination of furosemide by first-derivative spectrophotometric method. Anal Lett. 2005; 38:1159-66.
12. Carda-Broch S, Esteve-Romero J, Ruiz-Angel MJ, García-Alvarez-Coque MC. Determination of furosemide in urine samples by direct injection in a micellar liquid chromatographic system. Analyst. 2002 Jan; 127(1):29-34.
13. Nagori BP, Renu S. RP-HPLC method for simultaneous estimation of furosemide and amiloride hydrochloride in tablet formulation. Indian J Pharm Sci. 2010; 72:384-7.
14. Semaan FL, Cavalheiro EDG. Spectrophotometric determination of furosemide based on its complexation with Fe (iii) in ethanolic medium using a flow injection procedure. Anal Lett. 2006; 39:2557-67.
15. Ferraro MC, Castellano PM, Kaufman TS. A spectrophotometric-partial least squares (PLS-1) method for the simultaneous determination of furosemide and amiloride hydrochloride in pharmaceutical formulations. J Pharm Biomed Anal. 2001 Oct; 26(3):443-51.
16. Dinc E, Ustundag O. Spectophotometric quantitative resolution of hydrochlorothiazide and spironolactone in tablets by chemometric analysis methods. Farmaco. 2003; 58; 1151-61.
17. Kaukonen AM, Vuorela P, Vuorela H, Mannermaa JP. High-performance liquid chromatography methods for the separation and quantitation of spironolactone and its degradation products in aqueous formulations and of its metabolites in rat serum. J Chromatogram A. 1998; 797:271-81.
18. Dinc E, Baleanu D, Ustundag O. An approach to quantitative two-component analysis of a mixture containing hydrochlorothiazide and spironolactone in tablets by one dimensional continuous daubechies and biorthogonal wavelet analysis of UV spectra. Spectroscopy letters. 2003; 36:341-55.
19. Millership JS. Ratio spectra derivative spectrophotometry for the determination of furosemide and spironolactone in a capsule formulation. Farmaco. 2005; 60:333-8.
20. Baranowska I, Wilczek A, Baranowski J. Rapid UHPLC method for simultaneous determination of Vancomycin, Terbinafine, Spironolactone, Furosemide and their metabolites. Anal sci. 2010; 26(7):755-9.
Table 1: Assay results of combined dosage form
|
Drug |
Label claim (mg) |
Amount found (mg)* |
% Label claim
|
|
Furosemide |
20 |
20.29 |
101.45 |
|
Spironolactone |
50 |
49.55 |
99.1 |
*Each value is a mean of six observations
Table 2: System suitability parameters for RP-HPLC
|
Sr no. |
Parameter |
Furosemide |
Spironolactone
|
|
1 |
Asymmetry |
1.327 |
1.043 |
|
2 |
Resolution |
8.350 |
8.350 |
|
3 |
Tailing |
1.184 |
0.994 |
Table-3: Recovery studies of Furosemide and Spironolactone
|
Formulation studies |
Recovery Level |
Recovery of |
Amount taken (μg/ml) |
Amount added (μg/ml |
Total amount found (μg/ml)* |
% Mean Recovery, |
|
RP- HPLC |
50% |
Furosemide |
4 |
2 |
6.082 |
101.33 |
|
Spironolactone |
10 |
5 |
15.04 |
100.26 |
||
|
100% |
Furosemide |
4 |
4 |
7.946 |
99.25 |
|
|
Spironolactone |
10 |
10 |
19.93 |
99.65 |
||
|
150% |
Furosemide |
4 |
6 |
9.917 |
99.17 |
|
|
Spironolactone |
10 |
15 |
25.04 |
100.19 |
*Each value is a mean of six observations
Table 4: Summary of validation parameters of proposed RP-HPLC
|
Parameters |
Furosemide |
Spironolactone |
|
Beer’s law range |
2-10 μg/ml |
5-25 μg/ml |
|
Wavelength (nm) |
237 |
237 |
|
Correlation Coefficient |
0.996 |
0.999 |
|
Slope |
0.075 |
68.73 |
|
Intercept |
-0.017 |
-48.06 |
|
LOD (μg/ml) |
0.0025 |
0.00099 |
|
LOQ (μg/ml) |
0.0076 |
0.00302 |
|
% RSD Intraday precision Interday precision |
0.09-1.181 0.096-1.623 |
0.863-1.585 0.044-1.22
|
LOD= limit of detection; LOQ=limit of quantification; (%RSD)= % relative
NOW YOU CAN ALSO PUBLISH YOUR ARTICLE ONLINE.
SUBMIT YOUR ARTICLE/PROJECT AT articles@pharmatutor.org
Subscribe to PharmaTutor Alerts by Email
FIND OUT MORE ARTICLES AT OUR DATABASE


