

ABOUT AUTHORS:
Sudha Talasila*1, Yamini Pendyala2, Deepthi Madhu3, Dr.K.L.Senthil kumar.
1,2 Department of Pharmaceutics,
Padmavathi College of Pharmacy and Reserch institute,
periyanahalli, Tamilnadu, India.
3 Department of Pharmaceutics, Gitams university,
Visakhapatnam, India.
ABSTRACT
Aim of our present study was to formulate the Gelatin Microspheres Loaded with Lisinopril Dihydrate by using Co-acervation phase separation technique for control prolonged release of drug. Micro-particulate drug delivery of Lisinopril Dihydrate was prepared by using a blend of gelatin-carbopol 934P NF and Gelatin-Sodium alginate as release retardant.Lisinopril Dihydrate Microspheres were formulated by using different drug, gelatin-carbopol and gelatin-sodiumalginate in 6 batches was F1, F2, F3, F4, F5 & F6. All the formulations were investigated for various evaluation parameters like particle size, Bulk density, flow behavior, Entrapment efficiency, percentage yield and in vitro drug release etc. All the formulations showed good flow behavior. SEM study revealed that the spheres were almost spherical in shape with smooth surface. In-vitro drug release study showed that by increasing the polymer concentration the drug release of all the formulations were gradually decreased and the optimized formulation (F6) was able to sustain the drug release for 24 hours. So, it was concluded that gelatin microspheres loaded with Lisinopril Dihydrate can be prepared by Coacervation phase seperation technique and used for sustaining the drug release for prolonged period of time.
[adsense:336x280:8701650588]
Reference Id: PHARMATUTOR-ART-1262
Introduction
Micro sphere technology has been studied extensively for the sustained delivery of therapeutic agents1-3. Control release system includes any drug delivery system that releases the drug over an extended period of time. If it is unsuccessful in this, it is only extents the duration of actions. Advancement in drug delivery could come from innovative improvement to existing drug delivery system. This is because of reducing frequency of administration, sustained release dosage form and ambulatory patient compliance. If the system is successful in maintaining a constant drug level in the blood or target tissue4-5.The objectives in designing a controlled release system are to deliver the drug at a rate necessary to achieve and maintain a constant drug blood level. This rate should be analogous to that achieved by continuous intravenous infusion where a drug is provided to the patient at a rate just equal to its rate of elimination. This complies that the rate of delivery must be independent of the amount of drug remaining in the dosage form and constant over time. That is release from the dosage form should follow zero-order kinetics6.
Lisinopril is a potent, competitive inhibitor of angiotensin-converting enzyme (ACE) and is used to treat high blood pressure (hypertension), heart failure and to improve survival after heart attack. Lisinopril, one of the few ACE inhibitors that is not a pro-drug, compete with ATI for binding to ACE and inhibits and enzymatic proteolysis of AT-I to AT-II. Lisinopril, a synthetic peptide derivative, is chemically described as (S)-1-[N2-(1-carboxy-3- phenylpropyl)-L-lysyl]-L-proline dihydrate7.Lisinopril inhibits angiotensin-converting enzyme (ACE) in human subjects and animals. ACE is a peptidyl dipeptidase that catalyzes the conversion of angiotensin I to the vasoconstrictor substance, angiotensin II. Angiotensin II also stimulates aldosterone secretion by the adrenal cortex.
The beneficial effects of Lisinopril in hypertension and heart failure appear to result primarily from suppression of the renin-angiotensin-aldosterone system. Inhibition of ACE results in decreased plasma angiotensin II which leads to decreased vasopressor activity and to decrease aldosterone secretion. The latter decrease may result in a small increase of serum potassium. In hypertensive patients with normal renal function treated with Lisinopril alone for up to 24 weeks, the mean increase in serum potassium was approximately 0.1mEq/L however, approximately 15% of patients had increases greater than 0.5mEq/L and approximately 6% had a decrease greater than 0.5mEq/L. In the same study, patients treated with Lisinopril and hydrochlorothiazide for up to 24 weeks had a mean decrease in serum potassium of 0.1mEq/L; approximately 4% of patients had increases greater than 0.5 mEq/L and approximately 12% had a decrease greater than 0.5mEq/L.
Materials and Methods
[adsense:468x15:2204050025]
Materials Lisinopril Dihydrate (Watson Pharma Pvt. Ltd, Thane.), Gelatin B IP grade (Supra pharmaceuticals Pvt. Ltd, India), Carbopol 934P NF grade (Mclareu Bio-tech (P) Ltd, Hosur), Sodium alginate, formaldehyde, Isopropyl alcohol (S.D.Fine chemicals ltd, India).
Method of Preparation
Gelatin, gelatin-carbopol and gelatin-sodium alginate mixture containing Lisinopril dihydrate Microspheres were prepared by “coacervation phase separation technique” utilizing temperature change. In this method weighed amount of Gelatin was dissolved in 10ml of water which was previously heated to 50?C, to this Lisinopril was added and stirred approximately at 300 rpm with the help of magnetic stirrer for 15 mins to get a stable dispersion. The dispersion was poured drop wise into the 100ml of seasome oil which was also previously heated to 50? C on a water bath. The mixture was stirred with a help of magnetic stirrer for 2 hrs at 300rpm at room temperature. At the end of 2 hrs cross linking agent formaldehyde 0.5ml was added to the dispersion medium and stirring was continued for next 30 mins8. Finally it was kept in refrigerator for 24 hrs to ensure the rigidization of microspheres. Then the microspheres were washed with propylene glycol to wash off excess oil. This Procedure was followed to prepare 6 batches of Lisinopril microspheres with different ratios of gelatin and gelatin-carbopol, gelatin-sodium alginate mixtures.
Evaluation of Microspheres
Particle size analysis
The Particle size analysis was carried out by using optical microscopy. About 200 Micro spheres were selected randomly and their size was determined by using optical microscope fitted with standard micrometer scale.
Micromeritic properties of microspheres
Angle of Repose
A glass funnel is held in place with a clamp on a ring support over a glass plate. The glass plate is placed on a stand. Approximately 100 mg of a particle is transferred into funnel keeping the orifice of the funnel blocked by the lower thumb. As the thumb is removed the particles are emptied from funnel, and the angle of repose is determined.
Bulk Density
Bulk density is defined as the weight per unit volume of material.Interparticulate interaction is one of the most important parameter that affects the bulk and flow characteristics ofpowder9.The test can provide a gross measure of particle size and dispersion which can affect material flow consistency and reflect packaging quantity.
Morphological Examination
The texture of surface and shape of the microspheres were investigated by using Scanning electron microscopy (JSM 5610 LV SEM, JEOL, Datum Ltd, Tokyo, Japan). The sample (optimized formulation F6) was spread on stub and coated for 120 s with a layer of gold using a sputter coater. Afterwards, the stub containing the sample was placed in the scanning electron microscope chamber. The scanning electron photomicrograph image was taken at the acceleration voltage of 10 kV, chamber pressure of 0.6 mm Hg.
Production yield (% w/w)
The percentage yield of each batch was calculated on weight basis with respect to the weight of starting material. Thoroughly dried microspheres were collected and weighed accurately. The percentage yield was then calculated using formula
% Yield = Mass of microspheres obtained ×100
Total weight of drug and polymer
Entrapment efficiency
The entrapment efficiency of the prepared formulations was determined by the method of extraction of the drug present in the microsphere. The dried microspheres (20mg) were taken and extracted in 100 mL of phosphatebuffer (pH 6.8) for 4 hours. Then the dispersion of microspheres was sonicated for 30 min (Imeco Sonifier, Imeco Ultrasonics, India) and the solution was filteredthrough a 0.45 μm filter. Finally, the polymeric debris was washed twice with fresh solvent (phosphate buffer) to extract any adhering drug. The drug content of filtrateand washings was determined spectrophotometrically at 258 nm (UV-2450, Shimadzu, Japan).
Encapsulation efficiency was calculated using the following formula
Theoretical drug content = Amount of drug in bead ×100
Amount of bead taken
Encapsulation efficiency = Practical drug content x 100
Theoretical drug content
Drug Polymer Interaction (FTIR) Study
FTIR spectra of pure drug, pure polymers and formulations containing both drug and polymers were performed to study the drug polymer interaction. FTIR study was performed by using Fourier transformed infrared spectrophotometer (Prestige-21, Shimadzu, Japan).
In vitro drug release study
In-vitro release profile of Lisinopril Dihydrate from the microspheres was examined in phosphate buffer (pH 7.4) using USP (XXI) six stage dissolution rate test apparatus I (Thermolab®, Mumbai, India). Microspheres equivalent to 20 mg of drug was suspended in dissolution medium at 50 rpm and 37 ± 0.5°C. An aliquot of 5 ml was withdrawn periodically at intervals of one hour and same volume of fresh medium was replaced. The samples were filtered through Whatman filter paper and analyzed spectrophotometrically at 258 nm for amount of drug released10, 11.
ACCELERATED STABILITY STUDIES
The formulations were stored in a oven at 37 ± 2?C and 65% RH for a period of six weeks. The samples were analyzed for drug content every week by spectrophotometer at 258nm.
NOW YOU CAN ALSO PUBLISH YOUR ARTICLE ONLINE.
SUBMIT YOUR ARTICLE/PROJECT AT articles@pharmatutor.org
Subscribe to Pharmatutor Job Alerts by Email
FIND OUT MORE ARTICLES AT OUR DATABASE
RESULTS AND DISCUSSION
All the microspheres were prepared by Coacervation Phase Seperation process. Formaldehyde was selected as cross linking agent to prepare the microspheres. This method was selected to formulate the microspheres as because it is quick, easy and cost effective. The composition of all prepared formulations is depicted in Table-1.
Table.No.1.Formulation Design of Microparticles
|
Batch No. |
Lisinopril Dihydrate (mg) |
Gelatin (gm) |
Carbopol (gm) |
Sodium alginate (gm) |
Formaldehyde (ml) |
|
F1 |
20 |
1 |
- |
- |
0.5 |
|
F2 |
20 |
1.5 |
- |
- |
0.5 |
|
F3 |
20 |
0.75 |
0.25 |
- |
0.5 |
|
F4 |
20 |
0.50 |
0.50 |
- |
0.5 |
|
F5 |
20 |
0.75 |
- |
0.25 |
0.5 |
|
F6 |
20 |
0.50 |
- |
0.50 |
0.5 |
Micromeritic Properties of Microspheres
Flow properties of the prepared microspheres were determined by conducting Angle of repose, Bulk density determinations shown inTable No.2,3. Angle of repose of F1, F4& F6 formulations are below 25 and shows excellent flow properties remaining are having good flow properties.The prepared Lisinopril Dihydrate microspheres were subjected to bulk density test and the result indicates good packing property. Among all formulations F6 has shown good micromeritic properties.
Table.No.2 Angle of Repose of Microparticles
|
S.No |
Formulation |
Angle of repose |
|
1 |
F1 |
25º 40’ |
|
2 |
F2 |
26º 28’ |
|
3 |
F3 |
26 º44’ |
|
4 |
F4 |
24 º48’ |
|
5 |
F5 |
25º 34’ |
|
6 |
F6 |
24º 26’ |
Table.No.3 Bulk Density of Formulations
|
Batch no. |
Bulk density (gm/ml) |
|
F1 |
0.55 |
|
F2 |
0.56 |
|
F3 |
0.65 |
|
F4 |
0.46 |
|
F5 |
0.53 |
|
F6 |
0.46 |
Percentage Yield of Formulations
The percentage yield of microspheres of all the formulations was in the range of 78.90% to 88.53% shown in the Table No.4
Table No.4 Percentage yield of formulations
|
Formulation
|
Percentage yield (%) |
|
F1 |
82.64 |
|
F2 |
78.90 |
|
F3 |
80.95 |
|
F4 |
88.53 |
|
F5 |
80.50 |
|
F6 |
84.16 |
Drug Entrapment Efficiency of Microspheres
The entrapment efficiency was in the range of 60.78 to 88.24% shown in Table No.5. The formulations F6 and F5 were shown high entrapment efficiency of 83.24% & 82.76% which were made by combination of gelatin and Carbopol polymers.
Table.No.5 Drug entrapment Efficiency of Microparticles
|
Formulations |
Drug Entrapment Efficiency (%) |
|
F1 |
60.78 |
|
F2 |
65.30 |
|
F3 |
77.86 |
|
F4 |
80.23 |
|
F5 |
82.76 |
|
F6 |
83.24 |
Particle size analysis
The mean particle sizes of formulations were in the range of 67.2-76.4 µm. It was mentioned in Table No.6. The mean particle size of optimized formulation was found to be 67.2 µm.
Table.No.6 Mean Particle size of microsphere formulations
|
S.No |
Formulation |
Particle size (µm) |
|
1 |
F1 |
67.9 |
|
2 |
F2 |
76.4 |
|
3 |
F3 |
69.2 |
|
4 |
F4 |
73.7 |
|
5 |
F5 |
68.5 |
|
6 |
F6 |
67.2 |
Drug Polymer Interaction (FTIR) Study
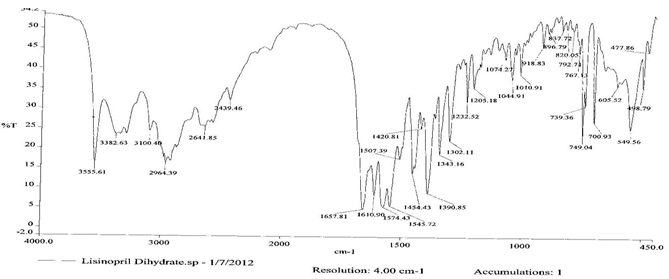
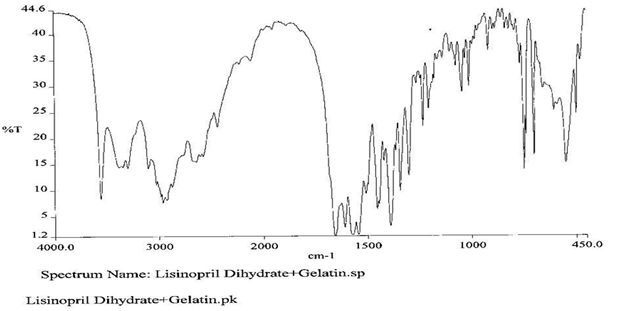
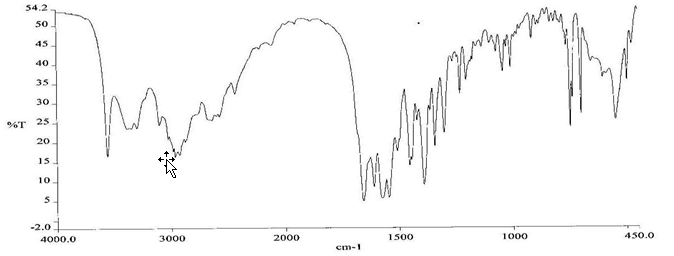
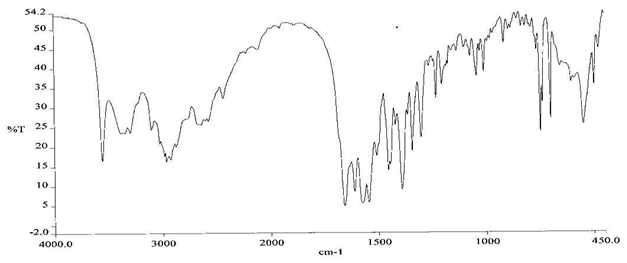
To check the compatibility of the drug with various polymers, IR spectra of the drug, polymers and combination of the drug and polymers were taken. The IR spectra of the drug and their combinations with polymers are shown in Graph No.1-4. The characteristic major peaks of Lisinopril dihydrate were obtained at 3296.32 cm-1, 3555cm-1, 1658.99cm-1, 1302.02cm-1 and 1420.69cm-1. The values of peaks of drug and its combination with polymers were shown in the Table No.7.It was observed that all the major peaks of Lisinopril dihydrate were intact when it was in combination with polymers and no considerable changes in the IR peaks were observed. So FT-IR spectra indicate the stable nature of Lisinopril in combination with polymers.
Table No.7 Comparision of IR Spectra of Lisinopril dihydrate and in combination with polymers
|
S.No. |
System |
-NH stretch (cm-1) |
-NH2 stretch (cm-1) |
-C=N stretch (cm-1) |
-COOH stretch (cm-1) |
C=C stretch (cm-1) |
|
1 |
Lisinopril dihydrate (LDH) |
3296.32 |
3555.59 |
1658.99 |
1343.12 |
2964.39 |
|
2 |
LDH + Gelatin
|
3295.51 |
3556.59 |
1658.48 |
1343.11 |
2964.02 |
|
3 |
LDH + Carbopol
|
3295.45 |
3556.48 |
1658.90 |
1343.14 |
2964.15 |
|
4 |
LDH + Sodium alginate |
3296.33 |
3555.16 |
1658.95 |
1343.10 |
2964.10 |
LDH - Lisinopril dihydrate.
Graph No.1 FT-IR graph of Lisinopril dihydrate (pure drug)
Graph No.2 FT-IR graph of Lisinopril dihydrate + Gelatin
Graph No.3 FT-IR graph of Lisinopril dihydrate+ Gelatin +carbopol
Graph No.4 FT-IR graph of Lisinopril dihydrate+ Gelatin +sodium alginate
Morphological Examination
Morphology of the microspheres was investigated by scanning electron microscopy. The photograph of formulation F6 taken by scanning electron microscope was shown in the Figure No.1. The microspheres were spherical in shape and free flowing.
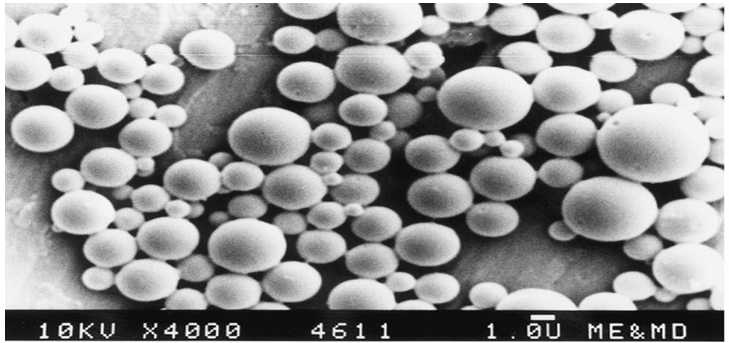
Figure No.1 SEM of Formulation F6 under Low Magnification
In vitroDrug Release Studies
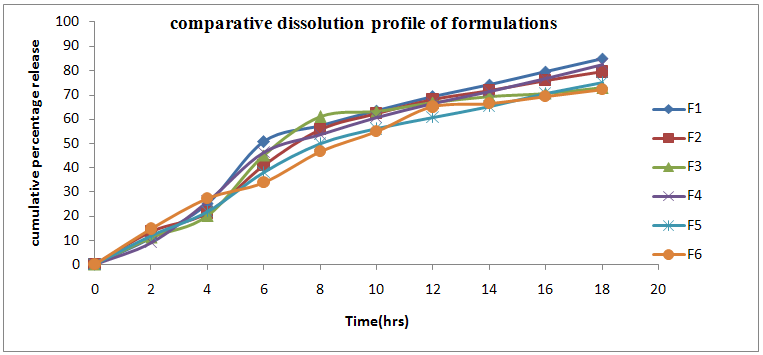
Dissolution profile of gelatin containing Lisinopril dihydrate Microspheres in Phosphate buffer pH 7.4 showed that Micro spheres with low amount of gelatin released 85.0% (F1) of Lisinopril after 18 hrs while Micro spheres prepared with high amount of gelatin released only 79.4% (F2) of Lisinopril. The dissolution profiles of all formulations upto 18 hrs were shown in the Table No.8. The In-vitro Dissolution profile of gelatin-carbopol containing Lisinopril dihydrate Microspheres in Phosphate buffer pH 7.4 showed that Microspheres with high amount of carbopol were most effective in slowing down the drug release 82.5% (F4), while the Micro spheres containing high amount of sodium alginate were released 72.1% (F6) of Lisinopril for 18 hrs at controlled rate. Comparative dissolution of all 6 formulations were sown in Figure No.2. So F6 was taken as optimized formulation for its high entrapment efficiency and controlled release.
Table.No.8 Comparative cumulative percentage release profile of formulations F1-F6
|
Time (hrs) |
Cumulative percentage drug release (%) |
|||||
|
F1 |
F2 |
F3 |
F4 |
F5 |
F6 |
|
|
2 |
11.3 |
13.8 |
11.3 |
9.2 |
12.1 |
14.7 |
|
4 |
25 |
21.3 |
20 |
26 |
21.8 |
27.4 |
|
6 |
50.5 |
40.8 |
45 |
46.3 |
38.1 |
33.8 |
|
8 |
57.3 |
55.7 |
60.8 |
53.7 |
49.7 |
46.5 |
|
10 |
63.4 |
62.3 |
63.1 |
60.5 |
55.9 |
54.9 |
|
12 |
69.1 |
68.2 |
66.7 |
66.3 |
60.7 |
65 |
|
14 |
74.2 |
71.8 |
69.3 |
71.4 |
65.3 |
66.3 |
|
16 |
79.7 |
75.9 |
70.5 |
76.8 |
70.5 |
69.2 |
|
18 |
85 |
79.4 |
72.8 |
82.5 |
75.2 |
72.1 |
Fig.No.2 Comparative dissolution profile of formulations
kinetic studies
The data obtained from the in-vitro dissolution studies was subjected for kinetic treatment to obtain the order of release and best fit model for the formulations.
The data obtained in the in-vitro dissolution studies were grouped in to modes of data treatments as follows:
*Cumulative percent drug release v/s time (Zero order).
* Cumulative percent drug release v/s square root of time (Higuchi Matrix Model).
* Log cumulative percent drug retained v/s time (first order).
*Log cumulative percent drug release v/s log time (krosmeyer peppas model).
The results of the in vitro dissolution studies of formulations F1 to F6 are shown in Table No.8. The plots of cumulative percentage drug release v/s time, log cumulative percentage drug retained v/s time and cumulative percent drug release v/s square root of time, log cumulative percent drug release v/s log time were drawn and represented graphically. All the formulations exhibited anomalous non-fickian diffusion (n value is in between 0.5 to 1.0) mechanism and it was shown in the TableNo.9. The drug release mechanism was diffusion controlled as the plot of higuchi model is linear. The kinetic graphs of F6 formulation are shown in the Graph No.5-8.
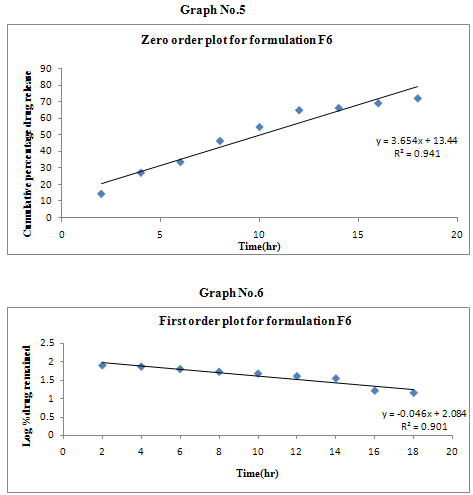
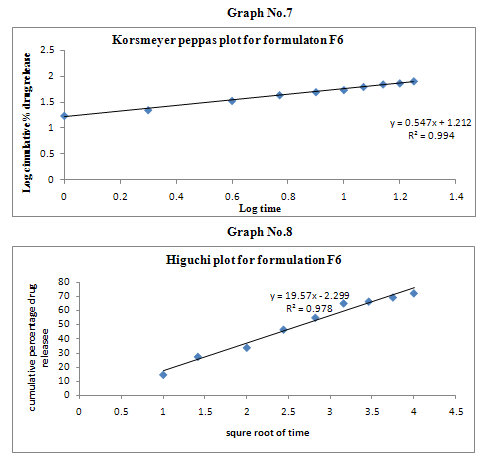
Table No.9 Kinetic Release Data of Formulations
|
Formulations |
Zero order plots |
First order plots |
Higuchi plots |
Korsmeyer-peppas plot |
Possible drug release mechanism |
|
|
R2 |
R2 |
R2 |
R2 |
n |
||
|
F1 |
0.9618 |
0.9899 |
0.9908 |
0.9836 |
0.5892 |
Non-fickian, higuchi |
|
F2 |
0.9136 |
0.8885 |
0.9701 |
0.9801 |
0.5962 |
Non-fickian, higuchi, first order. |
|
F3 |
0.9604 |
0.9913 |
0.9882 |
0.9882 |
0.5847 |
Non-fickian, first order, higuchi. |
|
F4 |
0.9414 |
0.9774 |
0.9768 |
0.9849 |
0.5834 |
Non-fickian, higuchi, first order. |
|
F5 |
0.9666 |
0.8539 |
0.9950 |
0.9877 |
0.5728 |
Non-fickian, higuchi, first order. |
|
F6 |
0.9416 |
0.9018 |
0.9782 |
0.9948 |
0.5475 |
Non-fickian, higuchi, zero order. |
ACCELERATED STABILITY STUDIES
Stability study was carried out for the formulations F1 and F5 at 37°C ± 1°C & 60°C for a period of 45 daysand the results were noted in Table No.10. The decrease in the percentage yield of formulations F1 and F5 were less, after 45 days of stability studies and they were considered as stable products
Table No.10 Stability Studies of Percentage Drug Content of Formulation F1 & F5
|
Days |
F1 |
F5 |
||
|
37?C&65%RH |
60?C |
37?C&65%RH |
60?C |
|
|
1 |
60.74 |
60.70 |
83.20 |
83.09 |
|
7 |
59.57 |
58.23 |
82.12 |
81.98 |
|
14 |
56.29 |
55.03 |
81.09 |
80.02 |
|
21 |
55.09 |
54.18 |
80.45 |
79.23 |
|
38 |
54.13 |
53.21 |
78.97 |
78.54 |
|
45 |
52.06 |
50.98 |
77.05 |
76.37 |
Conclusion
The Micro encapsulation of Lisinopril Dihydrate with gelatin, gelatin –carbopol and gelatin-Sodium alginate by co-acervation phase separation technique utilizing temperature change and cross linking with formaldehyde, was able to sustain the drug release efficacy. The microspheres having gelatine-sodium alginate and gelatin-carbopol polymers mixtures (F6&F3) provides the best sustained release formulations and other formulations (F1, F2) may be suitable for prolonged action formulations. These studies compared the release behaviour of gelatin, gelatin-sodium alginate and gelatin –carbopol controlled release system of Lisinopril microspheres. The F3 & F6 formulations had more pronounced controlled release effects compared with other formulations and F6 formulation is considered as optimised formulation among all formulations.
REFERENCES
1. Hausberger AG, DeLuca PP. Characterization of biodegradable poly (D, L-lactide-co-glycolide) polymers and micro spheres. J Pharm Bio med Anal. 1995; 13:747-760.
2. Kostanski JW, DeLuca PP. A novel in vitro release technique for peptide-containing biodegradable micro spheres. AAPS PharmSciTech [serial online]. 2000; 1: available on online pharmscitech.com.
3. Capan Y, Woo BH, Gebrekidan S, Ahmed S, DeLuca PP. Preparation and characterization of poly (D, L-lactide-co-glycolide) micro spheres for controlled release of poly (L-lysine) complexed plasmid DNA. Pharm. Res. 1999;16(4):509-513.
4. Vyas SP, Roop Khan K.Controlled drug delivery systems concepts and advances.1996; 2:531-550.
5. Vyas SP, Roop Khan K.Targeted controlled drug delivery, novel carrier systems.1998:4:417-456.
6. Thomas Wai-Yip Lee and Joseph R. Robinson, “Controlled / Release Drug delivery systems”, Chapter 47 in ‘Remington’s pharmaceutical sciences’, 20th Edition, Mack Publishimg Company, Volume-1, 2000; 903-929
7. Fohrer. Interparticulate attraction mechanisms. Alderborn G and Nystrom C Ed. Pharmaceutical Powder Technology.; Marcel Ddekker, Inc.: New York, l996, l-15.
8. S. S. Bansode and S. K. Banarjee, Microencapsulation: A Review, International Journal of Pharmaceutical Sciences Review and Research Volume 1, Issue 2, March – April 2010; Article 008 pg-38-42.
9.Tripati K.D., ‘Essentials of Medical pharmacology’, 5th Edition jaypee brothers medical publications (P) Ltd., New Delhi, 2003.
10. Nappinnai M, Kishore VS. Formulation and evaluation of microspheres of Diltiazem Hydrochloride. Ind. J. Pharm. Sci. 2007, 69, 511-514.
11. United States Pharmacopoeial Convention. United States Pharmacopoeia. USP 25: NF 20. Rockville, MD: United States Pharmacopoeial Convention; 2002.
NOW YOU CAN ALSO PUBLISH YOUR ARTICLE ONLINE.
SUBMIT YOUR ARTICLE/PROJECT AT articles@pharmatutor.org
Subscribe to Pharmatutor Job Alerts by Email
FIND OUT MORE ARTICLES AT OUR DATABASE


