 About Author: P. Sai Praveen*, G. Devala Rao, B. Anupama, V. Jagathi
K. V. S. R Siddhartha College of Pharmaceutical Sciences,
Vijayawada - 520 010.
Abstract:
A simple and sensitive spectroflourimetric method has been developed for the estimation of Darifenacin in pure and pharmaceutical dosage forms. Beers law was obeyed in the range of 1 – 5 µg/ml in methanol at an excitation wavelength (λex) of 292nm and an emission wavelength (λem) of 314nm with good correlation coefficient of 0.9995. The limit of detection (LOD) and limit of Quantification (LOQ) for this method are 0.138 and 0.418 µg/ml respectively and the relative standard deviation of intra-day precision was 0.71% and inter-day precision was 1.07%. Stability studies with respect to time and temperature were also carried out. The results obtained were in good agreement with the labelled amounts of the marketed formulations. This method has been statistically evaluated and found to be accurate and precise.
[adsense:336x280:8701650588]
Reference ID: PHARMATUTOR-ART-1112
Introduction:
Darifenacin1,2 which is chemically (S)-2-{1-[2-(2,3-dihydrobenzofuran-5yl)ethyl]3-pyrrolidinyl}-2,2-diphenyl acetamide is a novel antimuscarinic agent which has demonstrated clinical benefit in over-active bladder disease. Darifenacin is a selective M3 receptor antagonist3,4. A few number of methods such as HPLC, LC-MS were reported for the estimation of Darifenacin. Literature survey reveals that no spectroflourimetric method has been developed for the estimation of Darifenacin.
Darifenacin is a white powder soluble in water, methanol, ethanol, chloroform, 1,4 dioxan. Its molecular weight is 426.55 g/mol. The present article reports a simple spectroflourimetric method5,6 for the estimation of Darifenacin.

Structure of Darifenacin
Spectroflourimetric method:
Spectrofluorimetry has assumed a major role in drug analysis because of its greater sensitivity and selectivity than absorption spectrophotometry. Spectrophotometric technique rely upon the comparision of Incident light I0 and Transmitted light It intensity. At very low concentrations of absorbing species, the difference becomes extremely difficult to detect and becomes the factor, which limits the sensitivity of this technique. In Spectrofluorimetry, the emitted radiation is measured at right angle to the incident beam and at longer wavelength and as the concentration of the fluorescent species decreases, so the intensity of the light emitted decreases.
The sensitivity arises the requirement that two wavelengths are involved the excitation wavelength and the fluorescence emission wavelength which discriminates it from many compounds, which do not display significant fluorescence.
The emission of light by the molecules which are excited by the absorption of visible or UV radiation is the basis of fluorescence spectroscopy. Due to relatively low cost and high analytical sensitivity, this technique is widely employed in the quantitative analysis of drugs and metabolites and in the evaluation of these substances with biological macromolecules.
Molecular planarity and rigidity plays a significant role in the ability of a compound to fluoresce. A conjugated system of double bonds held in planar and rigid form that strongly absorbs in the 200-800nm region of the electromagnetic spectrum is usually a good candidate for developing fluorescence.
[adsense:468x15:2204050025]
Experimental:
Instrument:
ELICO Spectrofluorimeter Model SL 174
Reagents:
Methanol AR grade
Standard Drug solution:
About 100mg of Darifenacin was accurately weighed and dissolved in about 100ml of methanol to obtain a stock solution of 1mg/ml. This solution was further diluted with methanol to obtain a working standard solution of 10µg/ml.
Study of Fluorescence spectral characteristics of Darifenacin:
The standard solution Darifenacin was prepared in different solvents like water, methanol, ethanol, 1,4 Dioxan and was scanned from 200-800 nm to find out the excitation and emission wavelengths and also to find out the best solvent in which the drug exhibits maximum fluorescence. It was found that the drug exhibits maximum fluorescence in methanol at an excitation wavelength of 292nm and an emission wavelength of 314nm.
Preparation of calibration graph:
Darifenacin working standard solution of 10µg/ml was prepared and accurately 1, 1.5, 2, 2.5, 3, 3.5, 4, 4.5 ml of the working standard solution was transferred into each of the eight 10 ml standard flask and then made upto the mark with methanol. Resulting solutions have concentrations of 1, 1.5, 2, 2.5, 3, 3.5, 4 and 4.5 µg/ml. Fluorescence intensity was measured by setting the excitation wavelength at 292nm and the emission wavelength t 314nm. The calibration curve was prepared by plotting fluorescent intensity (I) vs. concentration (µg/ml).
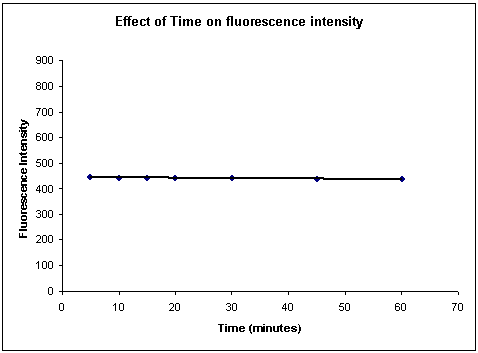
Stability profile with respect to time:
Darifenacin standard solution 3µg/ml was taken and set for time profile scan for 60 minutes with excitation wavelength 292nm and emission wavelength of 314nm. The fluorescence intensity was almost stable through out the time (Figure-1)
NOW YOU CAN ALSO PUBLISH YOUR ARTICLE ONLINE.
SUBMIT YOUR ARTICLE/PROJECT AT articles@pharmatutor.org
Subscribe to Pharmatutor Job Alerts by Email
FIND OUT MORE ARTICLES AT OUR DATABASE
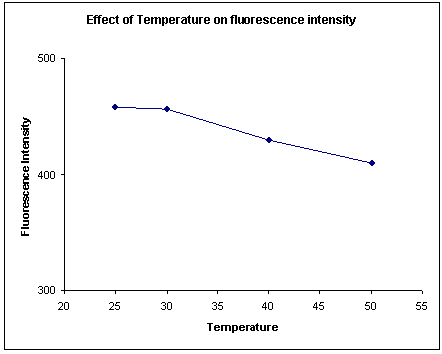
Effect of temperature on fluorescence intensity:
Darifenacin standard solution was 3 µg/ml was taken and fluorescence intensity was taken at different temperatures like 50°C, 40°C, 30°C and 25°C. The fluorescence intensity was found to decrease with increase in temperature. (Figure-2) Hence an ambient temperature (25 - 30°C) was employed during the measurement of the fluorescence intensity.
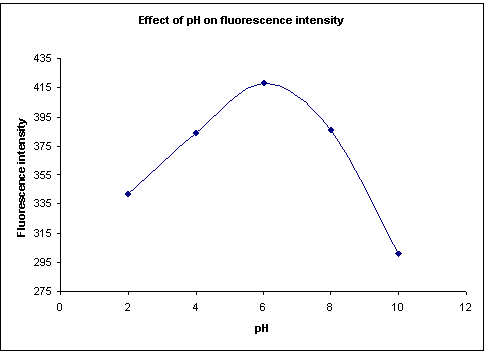
Effect of pH on fluorescence intensity:
Darifenacin standard solution of 3 µg/ml was taken in 5 different flasks and the pH was adjusted to 2,4,6,8 and 10 respectively and the fluorescence intensity was measured. The data obtained was depicted in Figure-3. This shows that Darifenacin shows maximum fluorescence intensity at the neutral pH (6-7). Hence neutral pH is employed for determination of the fluorescence intensity.
Estimation of Darifenacin in dosage forms:
Twenty tablets were taken (label claim 7.5 mg of Darifenacin/tablet) and accurately weighed. The tablets were powdered and weight equivalent to 7.5mg of Darifenacin was weighed and dissolved in 50 ml of methanol and was sonicated for a period of 20 minutes. The solution was filtered through a Whatmann No.1 filter paper. The volume was made upto the mark and was suitably diluted so as to contain an equivalent to 10µg/ml of Darifenacin in the solution. Then suitable concentrations were taken and were analyzed. Similarly dilutions were prepared for Darifenacin tablets of labelled claim 15mg and were analyzed. The assay values obtained were found to be within the limits.
Results and Discussion:
The fluorescent characteristics such as excitation and emission wavelength of Darifenacin were studied (292 and 314nm respectively). The calibration curve was linear in the range of 1 – 5 µg/ml with a correlation coefficient of 0.999. All the validation parameters are presented in Table-1.The stability of the fluorescence intensity was found to be optimum for a period of 60 minutes. It was seen that the experiment can be done at room temperature and the fluorescent intensity was constant between 25-30°C. Also the fluorescence intensity was found to be maximum at the neutral pH of 6-7.
Table-1: Validation report for estimation of Darifenacin
|
Parameters |
Results |
|
Linearity range, µg/ml |
1 - 5 |
|
Slope* |
117.22 |
|
SE of slope |
0.987 |
|
Confidence limit of slope (At 95%) |
1.446 |
|
Intercept* |
87.78 |
|
SE of intercept |
2.193 |
|
Confidence limit of intercept (At 95%) |
4.598 |
|
Correlation coefficient (r)* |
0.9986 |
|
SE of r |
0.055 |
|
Intraday precision*, % |
0.71 |
|
Interday precision, % |
1.07 |
|
LOD, µg/ml |
0.138 |
|
LOQ, µg/ml |
0.418 |
*Average of six determinations
To evaluate accuracy of the method known amounts of the pure drug was added to previously analyzed samples and the mixtures were analyzed by the proposed method. The values are presented in Table-2. The accuracy values were found to be within the prescribed limits thus indicating that there is no interference of other ingredients present in the formulation.
Table-2: Estimation of Darifenacin in Pharmaceutical Formulations
|
Formulation |
Labelled amount |
Amount found* by proposed method |
% recovery** by proposed method |
|
Tablet 1 |
7.5 |
7.46 |
98.84 |
|
Tablet 2 |
7.5 |
7.44 |
98.76 |
|
Tablet 3 |
15 |
14.88 |
99.02 |
|
Tablet 4 |
15 |
14.9 |
98.98 |
* Average of six determinations
**Recovery of amount added to the pharmaceutical formulation (Average of three determinations at three different levels)
Coclusion:
The results indicate that the method proposed was simple, selective and rapid with reasonable precision and accuracy. Hence this method can be employed for the routine analysis of Darifenacin in Pure form and in its formulations.
References:
1. The Merck Index, 13th edition, Merck Research laboratories, White House station, NJ, 495 (2001).
2. Martindale, The Extra Pharmacoepia, 31st edition, Reynolds, J.E.F.,(ED), Royal Pharmaceutical Society, London, U.K,465 (2002).
3. Alasbaster Av. Discovery and development of selective M3 antagonists for clinical use. Life Sci. 60: 1053-1060 (1997).
4. Quinn P, McIntyre P, Miner WD. In vivo profile of Darifenacin, a selective muscarinic M3 receptor antagonist. Br J Pharmacology, 119: 198 (1996).
5. R.Saraswathy, S.S. Prasanth, Spectroflourimetric method for the estimation of celecoxib in bulk and pharmaceutical formulations, Int. J.Chem. Sci.:7(1), 2009, 187-203.
6. R Kapil, S Dhawan, Bhupinder Singh, Development and validation of a spectroflourimetric method for the estimation of rivastigmine in formulations, IJPS Year : 2009, Volume : 71, Issue : 5, Page : 585-589
NOW YOU CAN ALSO PUBLISH YOUR ARTICLE ONLINE.
SUBMIT YOUR ARTICLE/PROJECT AT articles@pharmatutor.org
Subscribe to Pharmatutor Job Alerts by Email
FIND OUT MORE ARTICLES AT OUR DATABASE