 About Authors:
Segu Sairam*, Mulla Mahaboob Basha, S Ananda Thangadurai, V Kranthi kumar
Swamy vivekanandha college of pharmacy, dept. Of pharmaceutical analysis,
Elayampalayam, tiruchengode – 637205.
*Sairampharma2020@gmail.com
ABSTRACT
A simple, sensitive and specific method reverse phase - high performance liquid chromatography (RP-HPLC) have been developed and validated for the estimation of Temozolomide in its Pharmaceutical dosage form.
Estimation of Temozolomide by using RP-HPLC coupled with UV
An isocraticREVERSE PHASE - HIGH PERFORMANCE LIQUID CHROMATOGRAPHY method was developed and validated for the estimation of Temozolomide in its Pharmaceutical dosage forms. The separation of the analytes was performed on aDevelosil ODS MG.5 (150×4.6mm),5µm, with mobile phase containing (0.5% w/v glacial acetic acid) named as Solution-A : Methanol [90 : 10, v / v] was used. The flow rate was 1 ml min-1 and separation was monitored by UV detection at 254 nm. Chromatogram showed peak at a retention time of 7.306 ± 0.009 min. validation of the method for linearity and range, intra-day and inter-day precision, accuracy, specificity, recovery, ruggedness, robustness and limits of detection and quantification were obtained as 0.598 µg / ml and 1.81 µg / ml respectively. The calibration plot was linear from 20-60 µg ml-1 and the correlation coefficient was 0.999.The proposed method is fast, accurate and precise for the quantitative determination of Temozolomide capsules.
[adsense:336x280:8701650588]
REFERENCE ID: PHARMATUTOR-ART-1470
INTRODUCTION 1
Temozolomide is chemically 4-methyl-5-oxo- 2, 3, 4, 6, 8-pentazabicyclo [4.3.0] nona-2, 7, 9-triene- 9-carboxamideis an oral alkylating agent(Figure1). It is used for the treatment of Grade IV astrocytoma an aggressive brain tumor, also known as glioblastoma multiformeas well as for treating melanoma, a form of skin cancer.
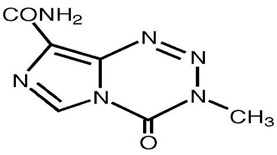
Figure 1 Structure of Temozolomide
Literature survey reveals that certain Chromatographic2-6 and Spectrophotometric6-11 methods were reported for estimation of Temozolomide and no method is available for such estimation in Indian Pharmacopoeia. In view of the need for a suitable RP-HPLC method for routine analysis of Temozolomidein formulations, attempts were made to develop simple, precise and accurate analytical method for estimation of Temozolomideand extend it for their determination in formulation. The utility of the developed method to determine the content of drug in commercial formulation was also demonstrated. Validation of the method was done in accordance with USP and ICH guideline for the assay of active ingredient. The method was validated for parameters like system suitability, linearity, precision, accuracy, specificity, ruggedness, robustness, limit of detection and limit of quantification. This method provides means to quantify the component. This proposed method was suitable for the analysis of Pharmaceutical formulation in analytical laboratories.
[adsense:468x15:2204050025]
EXPERIMENTAL
Chemicals and reagents
Temozolomidewasprocured from NATCO Pharma Pvt Ltd. (Kothur, Hyderabad, A.P, India). Commercial Pharmaceutical preparations from NATCO Pharma, which were claimed to contain 50 mg of Temozolomidewas used in analysis. HPLC grade Methanol, HPLC grade Glacial Acetic Acid and Milli-Q-grade Purified Water was used as solvent in the given method.
Equipments and apparatus Used
Different kinds of equipments viz Analytical weighing balance (Sartorius), HPLC system (Waters 2690 series) equipped with Empower software, Develosil Column, Sonicator (Fast clean), pH meter (Cyberscan), Vacuum filter pump, Millipore filtration kit, Mobile phase reservoir, Water bath, Amber coloured volumetric flasks Sample filtration assembly and glassware were used through out the experiment.
Optimization method
Optimization of mobile phase was performed based on the resolution, asymmetric factor, and peak are obtained. Peak of Temozolamide was well resolved with the mobile phase was prepared by using 0.5% of glacial acetic acid in water and methanol in the ratio of [90:10V/V].The retention time was found to be 7.3. The column used for the separation was done by Develosil ODS MG.5 (150×4.6mm), 5µm at the temperature of 25?C. The injection volume of 10µl and the flow rate was adjusted to 1.0 ml/min with the run time of 15min at 254nm.
Preparation of standard stock solution
Accurately weigh and transfer about 50 mg of temozolomide working standard in to 100 ml amber color volumetric flask. Add about 60ml of diluent and sonicate to dissolve, cool the solution to room temperature and dilute to volume with diluent and mix.
Transfer 2.0 ml of the above solution into a 25 ml amber color volumetric flask and dilute to volume with diluent.
Preparation of sample stock solution
Remove, as completely as possible, the contents of not fewer than 20 capsules and weigh accurately. Mix the combined contents and transfer accurately weighed quantity of the powder, equivalent 100 mg of Temozolomide in to 250 ml amber color volumetric flask. Add about 180 ml of diluent and sonicate for 20 min’s with occasionally shakings. Cool the solution to room temperature and dilute to volume with diluent. Centrifuge a portion of the suspension at 3000rpm for 10min’s.
Transfer 2.0 ml of the above supernatant solution in to a 20 ml amber colour volumetric flask and dilute to volume with diluent.
Preparation of Placebo
The amount of powdered inactive ingredient suppose to be present in 20 capsules was accurately weighed. Mix the combined contents and transfer accurately weighed quantity of the powder, equivalent 100 mg of Temozolomide in to 250 ml amber color volumetric flask. Add about 180 ml of diluent and sonicate for 20 min’s with occasionally shakings. Cool the solution to room temperature and dilute to volume with diluent. Centrifuge a portion of the suspension at 3000rpm for 10min’s. Transfer 2.0 ml of the above supernatant solution in to a 20 ml amber color volumetric flask and dilute to volume with diluent.
NOW YOU CAN ALSO PUBLISH YOUR ARTICLE ONLINE.
SUBMIT YOUR ARTICLE/PROJECT AT articles@pharmatutor.org
Subscribe to PharmaTutor Alerts by Email
FIND OUT MORE ARTICLES AT OUR DATABASE
METHOD VALIDATION
SYSTEM SUITABILITY
Stock solution-II of Temozolomide standard was injected six times into HPLC system as per test procedure. The system suitability parameters were evaluated from standard Chromatograms obtained, by calculating the % RSDof retention times, tailing factor, theoretical plates and peak areas from six replicate injections. The results shown in Figure No.2 and Table No.1
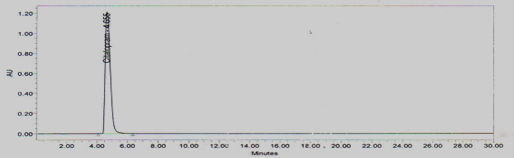
Figure 2 Standard Chromatogram for System suitability
LINEARITY
The linearity of the method was demonstrated over the concentration range of 20-60 µg / ml. Aliquots of 20, 30, 40, 50 and 60 µg / mlwere prepared from stock solution-II and labeled as solution 1, 2, 3, 4 and 5 respectively. The solutions were injected in to HPLC system as per test procedure. The results found in figure No.3 and Table No.2
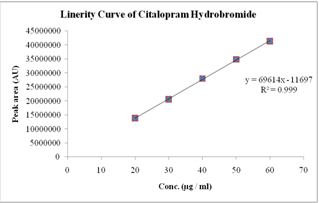
Figure No.3 Sample linearity curve for System suitability
PRECISION
Repeatability
Six sample solutions were prepared and injected into the HPLC system as per test procedure. The results were presented in Table No.3 and 4
Intermediate precision (Analyst to Analyst variability)
Two analysts as per test method conducted the study. For Analyst-1 Refer Precision (Repeatability) results and the results for Analyst-2 were discussed in Table No.5
ACCURACY
Assay was performed in triplicate for various concentrations of Temozolomide equivalent to 50, 75, 100, 125 and 150 % of the standard amount was injected into the HPLC system per the test procedure. The average % recovery of Temozolomide was calculated and the results were summarized in Table No.6
SPECIFICITY
Temozolomide Identification
Solutions of Standard and Sample were preparedas per test procedure and injected into the HPLC system.
Placebo interference
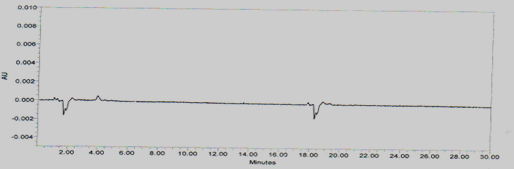
A study to establish the interference of placebo was conducted. A sample of placebo was injected into the HPLC system as per the test procedure. The Chromatogram of placebo was represented as Figure No.4
Figure No.4 Chromatogram for Placebo interference
Blank interference
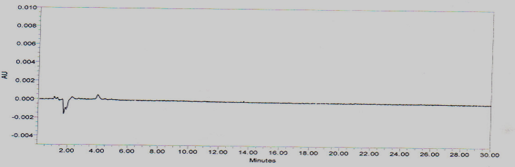
A study to establish the interference of blank was conducted. Diluent was injected into HPLC system as per the test procedure. The Chromatogram of blank was shown in Figure No.5
Figure No.5 Chromatogram for Blank interference
RUGGEDNESS
The assay of Temozolomide was performed by different analysts on different days.The results for Day-1, Analyst-1 results were illustrated in Table No.7.Theresults for Day-2, Analyst-2 and the results were discussed in Table No. 8
ROBUSTNESS
The robustness of the proposed method was determined by analysis of aliquots from homogenous lots by differing physical parameters like flow rate and mobile phase composition which may differ but the responses were still within the specified limits of the assay.
Effect of variation of flow rate
A study was conducted to determine the effect of variation in flow rate. Standard solution was prepared and injected into the HPLC system by keeping flow rates 0.9 ml / min and 1.1 ml / min. The effect of variation of flow rate was evaluated.
Effect of variation of mobile phase composition
A study was conducted to determine the effect of variation in mobile phase ratio by Changing the ratio of mobile phase i.e. Methanol: Buffer from 70: 30 to 68: 32 and 72: 28. Standard solution was prepared and injected into the HPLC system and the Chromatograms which were recorded and the retention time values were measured.
RESULTS AND DISCUSSION
SYSTEM SUITABILITY
From the system suitability studies it was observed that % RSD of retention time was found to be 0.2, % RSD of peak area was found to be 0.2. Theoretical plates were found to be more than 6500. USP tailing factor was found to be 1.67. All the parameters were within the limit.
Table No. 1 Standard Chromatogram values for System suitability
|
Injection |
tR |
Peak Area |
USP Plate count |
USP Tailing |
|
1 |
7.3 |
660589 |
8597.7 |
1.2 |
|
2 |
7.3 |
663240 |
8543.9 |
1.2 |
|
3 |
7.3 |
660505 |
8570.8 |
1.2 |
|
4 |
7.3 |
660227 |
8574.2 |
1.2 |
|
5 |
7.3 |
662543 |
8578.5 |
1.2 |
|
6 |
7.3 |
659835 |
8594.7 |
1.2 |
|
Mean |
7.3 |
661156 |
8576.6 |
1.18 |
|
SD |
|
1387.02 |
|
|
|
% RSD |
|
0.21 |
|
|
LINEARITY
From the Linearity data it was observed that the method was showing linearity in the concentration range of 20-60 µg / ml. Correlation coefficient was found to be 0.999.
Table No.2 Linearity Range and Average area values
|
Conc. (µg / ml) |
20 |
30 |
40 |
50 |
60 |
|
Peak area* |
13799796 |
20532237 |
27994172 |
34890435 |
41428095 |
|
Correlation |
0.999 |
||||
PRECISION
The RSD of % Recovery for standard Chromatograms of repeatability precision was found to be 0.5 %, for sample Chromatograms it was found to be 0.86 % and in intermediate precision it was found to be 0.47 %. It passes repeatability and intermediate precision.
Repeatability
Table No.3 Standard values for Repeatability
|
Injection No |
Peak Area |
% Recovery |
|
1 |
27554861 |
98.69 |
|
2 |
27631819 |
99.13 |
|
3 |
27617916 |
98.91 |
|
4 |
27622416 |
99.01 |
|
5 |
27644753 |
99.41 |
|
6 |
27723581 |
100.11 |
|
Mean |
27632558 |
99.87 |
|
SD |
54384.6 |
0.501358 |
|
% RSD |
0.2 |
0.5 |
Table No.4 Sample Chromatogram values for Repeatability
|
Injection No |
Peak Area |
% Recovery |
|
1 |
27818714 |
99.87 |
|
2 |
28074488 |
101.06 |
|
3 |
27424386 |
98.78 |
|
4 |
27622416 |
98.91 |
|
5 |
27644753 |
99.01 |
|
6 |
27703581 |
99.23 |
|
Mean |
27718056 |
99.47 |
|
SD |
218159.9 |
0.865648 |
|
% RSD |
0.78 |
0.86 |
Intermediate Precision (Analyst to Analyst variability): Analyst 2
NOW YOU CAN ALSO PUBLISH YOUR ARTICLE ONLINE.
SUBMIT YOUR ARTICLE/PROJECT AT articles@pharmatutor.org
Subscribe to PharmaTutor Alerts by Email
FIND OUT MORE ARTICLES AT OUR DATABASE
Table No.5 Sample Chromatogram values for intermediate Precision
|
Injection No |
Peak Area |
% Recovery |
|
1 |
27723581 |
99.56 |
|
2 |
27644753 |
99.17 |
|
3 |
27622416 |
99.13 |
|
4 |
27424386 |
98.91 |
|
5 |
28074488 |
100.17 |
|
6 |
27818714 |
99.79 |
|
Avg |
27718056 |
99.455 |
|
SD |
218159.9 |
0.472938 |
|
% RSD |
0.78 |
0.47 |
ACCURACY
The recoveries of pure drug from the analyzed solution of formulation were 99.22 % to 100.11 %, which shows that the method was accurate.
Table No.6 % Recovery Results for Citalopram Hydrobromide
|
Sample No. |
Spike Level |
Amount (µg / ml) added |
Amount (µg / ml) found |
% Recovery |
Mean % Recovery |
|
1 |
50 % |
20 |
19.84 |
99.20 |
99.22 |
|
50 % |
20 |
19.85 |
99.28 |
||
|
50 % |
20 |
19.84 |
99.20 |
||
|
2 |
75 % |
30 |
29.93 |
99.78 |
99.94 |
|
75 % |
30 |
30.01 |
100.05 |
||
|
75 % |
30 |
30.00 |
100.00 |
||
|
3 |
100 % |
40 |
39.92 |
99.80 |
99.83 |
|
100 % |
40 |
39.92 |
99.80 |
||
|
100 % |
40 |
39.96 |
99.90 |
||
|
4 |
125 % |
50 |
50.08 |
100.16 |
100.11 |
|
125 % |
50 |
49.61 |
99.92 |
||
|
125 % |
50 |
50.12 |
100.21 |
||
|
5 |
150 % |
60 |
59.83 |
99.73 |
99.62 |
|
150 % |
60 |
59.87 |
99.69 |
||
|
150 % |
60 |
59.67 |
99.46 |
SPECIFICITY
The Chromatograms of Standard and Sample are identical with nearly same Retention time. No interference due to Placebo and Sample at the retention time of analyte which shows that the method was specific.
RUGGEDNESS
Comparison of both the results obtained for two different Analysts shows that the assay method was rugged for Analyst-Analyst variability.
Table No.7 Ruggedness results for sample: (Day-1, Analyst-1)
|
Parameter |
Peak Area |
% Assay |
|
Avg* |
27633585 |
99.68 |
Table No.8 Ruggedness results for sample (Day-2, Analyst-2)
|
Parameter |
Peak Area |
% Assay |
|
Avg* |
27994172 |
100.865 |
|
% RSD* |
0.036 |
0.26 |
ROBUSTNESS
As the % RSD of retention time and asymmetry were within limits for variation in flow rate (± 0.1 ml). Hence the allowable flow rate should be within 0.9 ml to 1.1 ml. The results of robustness for effect of variation in flow rate were reported.
LIMIT OF DETECTION
The Limit of Detection was calculated from the linearity curve method using slope, and standard deviation of intercepts of calibration curve. Limit of Detection was found to be 0.598 µg / ml.
LIMIT OF QUANTIFICATION
The Limit of Quantification was calculated from the linearity curve method using slope, and standard deviation of intercepts of calibration curve. Limit of Quantification was found to be 1.81 µg / ml.
CONCLUSION
The proposed method was found to be simple, fast, robust, more precise and accurate under the present experimental conditions. Therefore the developed and validated method can be used for routine analysis for estimation of Temozolomidein bulk and pharmaceutical dosage form.
REFERENCES
1. En.wikipedia.org/wiki/temozolomide
2. Skibinski RA, Misztal GA. Determination of Citalopram in Tablets by HPLC, Densitometric HPTLC and Videodensitometric HPTLC Methods. J Liq Chromatogr Relat Technol 2005, 28(2), 313-324.
3. Kristoffersen L, Bugge A, Lundanes E, Slordal L. Simultaneous determination of Citalopram, Fluoxetine, Paroxetine and their metabolites in plasma and whole blood by High Performance Liquid Chromatography with Ultraviolet and Fluorescence detection. J Chromatogr B. 1999, 734(2), 229-246.
4. Juan H, Zhiling Z, Huande L. Simultaneous determination of Fluoxetine, Citalopram, Paroxetine, Venlafaxine in plasma by High Performance Liquid Chromatography - Mass Spectrometry / Eelectro Spray Ionization (HPLC–MS / ESI). J of Chromatogr B. 2005, 820(1), 33-39.
5. Macek J, Ptac EP, Klima J. Rapid determination of Citalopram in human plasma by High Performance Liquid Chromatography. J Chromatogr B. 2001, 755(1-2), 279-285.
6. Greiner C, Hiemke C, Badera W, Haena E. Determination of Citalopram and escitalopram together with their active main metabolites desmethyl(es-)Citalopram in human serum by Column-switching High Performance Liquid Chromatography (HPLC) and Spectrophotometric detection. J Chromatogr B. 2007, 848(2), 391-394.
7. Menegola J, Elfrides M, Schapoval ES. Development and validation of column High Performance Liquid Chromatographic and Ultraviolet Spectrophotometric methods for Citalopram in tablets. J AOAC Int. 2008, 16(3), 233-235.
8. Asad Raza. Development and Application of Spectrophotometric Methods for the Determination of Citalopram Hydrobromide in Dosage Forms. Chem & Pharm bul. 2006, 54(4), 432.
9. Skibiski R, Misztal G. Determination of Citalopram in tablets by Capillary Zone Electrophoresis and by direct and derivative UV Spectrophotometry. Acta Poloniae Pharm. 2005, 62(5), 331-334.
10. Bouhajib M, Milenkovic O, Smari A. A rapid and sensitive Liquid Chromatographic Tandem Mass Spectrometric method for the