About Authors:
Gunjan Kalyani*, Vishal S. Deshmukh, Pranita Kashyap, Ram D. Bawankar, Yogesh Vaishnav, Deepak Biswas
Shri Rawatpura Sarkar Institute of Pharmacy,
Behind power grid, Kumhari, Durg, Chhattisgarh
*kalyani.gunjan@yahoo.in
Abstract
Clopidogrel bisulfate is an inhibitor of adenosine diphosphate (ADP)-induced platelet aggregation acting by direct inhibition of ADP binding to its receptor and of the subsequent ADP-mediated activation of the glycoprotein GPIIb/IIIa complex. Objective of the present study is to develop a simple, sensitive, accurate, precise and rapid derivative spectrophotometric method for the estimation of clopidogrel in pure form. For the estimation of clopidogrel, solvent system employed was 0.1 N HCl and wavelength of detection (λdet) was 284.3 nm for fourth order derivative spectroscopy. The linearity was obtained in the range 42 – 336 µg/ml. The limit of detection is 6.7 µg/ml and limit of quantification was fund to be 20.4 µg/ml. Obtained results showed that there is minimum intra day and inter day variation. The developed method was validated and recovery studies were also carried out. Sample recovery using the above method was in good agreement with their respective labeled claim, thus suggesting the validity of the method and non-interference of formulation excipients in the estimation. Fourth order derivative spectroscopic method is simple, rapid and reproducible and further it can be used for the analysis.
[adsense:336x280:8701650588]
REFERENCE ID: PHARMATUTOR-ART-1481
Introduction
Clopidogrel bisulfate is an inhibitor of adenosine diphosphate (ADP)-induced platelet aggregation acting by direct inhibition of ADP binding to its receptor and of the subsequent ADP-mediated activation of the glycoprotein GPIIb/IIIa complex. Clopidogrel's platelet inhibiting activity makes it an effective drug for reducing the incidence ischemic strokes, heart attacks or claudication due to vascular diseases such as atherosclerosis. By inhibiting platelet aggregation, Clopidogrel reduces the chance of arterial blockage, thus preventing strokes and heart attacks1. Chemically it is methyl (+)-(S)-α-(2-chlorophenyl)-6, 7-dihydrothieno [3,2-c]pyridine-5(4H)-acetate sulfate (1:1). The empirical formula of Clopidogrel bisulphate is C16H16ClNO2S•H2SO4 and its molecular weight is 419.91. So far to our present knowledge no fourth order derivative spectroscopic method for the estimation of Clopidogrel bisulphate has been published in the literature, although methods for determination of Clopidogrel in Pharmaceutical Preparations has been published. However the method is no fourth order derivative spectroscopic method. The present work deals with method development and validation of the method.
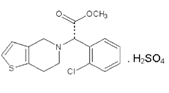
Fig. 1: structure of clopidogrel
UV spectrophotometry is generally preferred especially by small-scale industries as the cost of the equipment is less and the maintenance problems are minimal. The method of analysis is based on measuring the absorption of a monochromatic light by colorless compounds in the near ultraviolet path of spectrum (190-380nm). The fundamental principle of operation of spectrophotometer covering UV region consists in that light of definite interval of wavelength passes through a cell with solvent and falls on to the photoelectric cell that transforms the radiant energy into electrical energy.
Literature review suggested several analytical methods that have been reported for the estimation of Clopidogrel in bulk or pharmaceutical formulations include High Performance Liquid Chromatography, and UV-Visible Spectrophotometry. Literature review also revealed that there is no Fourth order Derivative Spectroscopic method. The objective of the work was to develop simple, accurate, precise and economic fourth order derivative Spectroscopic method to estimate the clopidogrel in bulk. The method should be simple, accurate, precise, reproducible and statistically valid.
Thus, the objectives of project:
I. To develop a simple, precise, accurate method, less time consuming & economical derivative spectroscopic method.
II. Under derivative spectroscopy, the development of First Order derivative Method.
III. Validation of developed method using common parameters:
a) Linearity
b) Precision
c) Accuracy
d) Sensitivity
e) Limit of Detection (LOD)
f) Limit of Quantification (LOQ)
[adsense:468x15:2204050025]
Materials and Methods
Drug
The standard sample of CLOPIDOGREL was obtained as gift sample from Dr. Reddy’s Laboratory Pvt. Ltd., Hyderabad, A.P., India. The CLOPIDOGREL tablets were procured from local market, brand Clopivas AP Cipla Ltd., Mumbai, India.
Instrument specifications
UV Spectrophotometer, Shimadzu, model 1800.
Chemicals and reagents used
Hydrochloric acid procured from Qualigens India.
Preparation of stock solution
The stock solution of clopidogrel is prepared by dissolving 100 mg of drug in 100 ml 0.1 N HCl in volumetric flask with continuous shaking; 0.42 ml of sample was withdrawn and diluted to 10 ml methanol to get 42 μg/ml of solution. The solution was than scanned in UV range between 200 - 400 nm UV-VIS Spectrophotometer, Shimadzu, Japan to determine the absorption maxima of the drug against blank as 0.1 N HCl.
Wavelength scanning and determination of absorption maximum
From the stock solution of clopidogrel, known concentration of 42μg/ml is prepared by suitable dilution with 0.1 N HCl. The solution of 0.1 N HCl was prepared in double distilled water as per IP 1996 procedure. Wavelength scanned for the maximum absorption of drug solution using UV-Visible spectrophotometer within the wavelength region of 200–400 nm against blank solvent. Convert the normal mode obtained spectra to fourth order derivative. The wavelength that shows the peak with a highest absorbance is considered as absorbance maximum of the drug. The result is presented in table 1.
Linearity studies
Stock solution was subsequently diluted with 0.1 N HCl to get 42μg/ml, 84μg/ml, 126μg/ml, 168μg/ml, 210μg/ml 252μg/ml, 294μg/ml, 336μg/ml. Convert the normal mode obtained spectra to fourth order derivative using software UV probe 2.34. The results are tabulated and the linearity curve was constructed by plotting concentration Vs. D4 value. The result is presented in table 1 and fig. 2.
NOW YOU CAN ALSO PUBLISH YOUR ARTICLE ONLINE.
SUBMIT YOUR ARTICLE/PROJECT AT articles@pharmatutor.org
Subscribe to PharmaTutor Alerts by Email
FIND OUT MORE ARTICLES AT OUR DATABASE
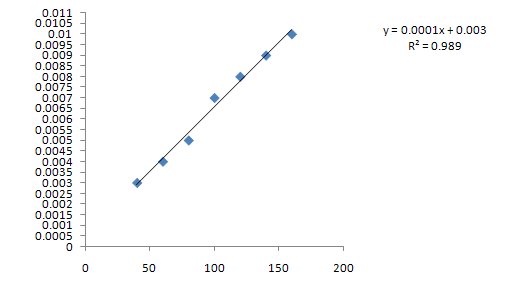
Fig 2. Depicting the linearity studies
X Axis; D4 Value
Y Axis; Concentration (µg/ml)
Precision
The precision of method was ascertained; the percent relative standard deviation were calculated and presented.
Inter day and intraday studies for clopidogrel analytical method
The prepared stock solution was subsequently diluted to get 168 μg/ml. The resulting solution absorbance was measured at detection wavelength of 284.3 nm using double beam UV spectrophotometer against blank solvent. The findings was made at different time intervals in day times in a day and performed continuously for six days. Convert the normal mode obtained spectra to fourth order derivative. The results obtained were tabulated and studied for inter day and intraday variation. The results are tabulated in table 1.
Accuracy studies
The accuracy/recovery studies were carried out by adding a known amount of drug from the pre-analyzed tablet powder and percentage recoveries were calculated. Convert the normal mode obtained spectra to fourth order derivative. The reproducibility of estimation was determined by performing the tablet drug content of different samples. The results of accuracy studies were expressed in %. The result is presented in table 1.
Assay studies
The assay studies were carried out with the help of clopidogrel tablets; brand Clopivas AP Cipla Ltd., Mumbai. The percentage purity was calculated. Convert the normal mode obtained spectra to first order derivative. The reproducibility of estimation was determined by performing the drug content of different samples. The results of assay studies were expressed in %. The result is presented in table 1.
|
S.NO. |
PARAMETERS |
OBTAINED RESULT |
|
1 |
Detection Wavelength |
284.3 nm |
|
2 |
Linearity and Range |
42 – 336 µg/ml |
|
3 |
Limit Of Detection |
6.7 µg/ml |
|
4 |
Limit Of Quantification |
20.4 µg/ml |
|
5 |
Intraday precision |
% RSD less than 2%. |
|
6 |
Inter day precision |
% RSD less than 2%. |
|
7 |
Accuracy studies |
Within the limit 95 -105% |
|
8 |
Assay |
Within the limit 95 -105% |
Results and Discussion
In our laboratory we developed fourth order derivative spectroscopic method for the analysis of clopidogrel. The known concentration of irbesartan is prepared and scanned for absorption maximum. The detection wavelength according to spectra is 284.3 nm. Different measured D4 values at detection wavelength 284.3 nm is plotted as the curve as D4 value versus concentration. Irbesartan obeys the beer’s law in the concentration range 42 - 336 μg/ml. Linearity study indicates the curve is linear in the range of 42 - 336 μg/ml. The linear regression equation is Y = 0.0001x + 0.003 with regression coefficient, R2= 989. The developed method is validated for repeatability, reproducible and the accuracy and precision. In the inter day and intraday study of standard graph, the % RSD is less than 2% indicating the developed method is reproducible. The different levels of standard concentration solutions are measured for D4 value and actual concentration is calculated. The results showed that the amount recovered is 100% indicating the first order derivative spectroscopic method is accurate and precise.
Conclusion
The developed analytical method for irbesartan by using first order derivative spectroscopy is found to simple, rapid and selective and the amount of drug recovered will be same as the label claimed and precise. It can be conveniently employed for the routine analysis and quantification of irbesartan.
Acknowledgements
Author (Gunjan Kalyani) would sincerely thank Principal, my teacher Vishal S. Deshmukh Sir, Yogesh Vaishnav Sir, and Ajit Pandey Sir, staff & lab technicians SRIP, Kumhari, Durg, C.G. for their contribution in carrying forward the research work, for providing the necessary support, for his kind and valuable guidance, and for providing basic facilities in lab.
References
1. rxlist.com.
2. Budavari S., O’Neil M.J., Smith A. Heckelman P.E. Ed. The Merck Index, Mary Adele 13th edition published by Merck Research Lab, Division of Merck and Co., White house station, NJ, USA, 2001, 148.
3. Shah N.J., Suhagia B.H., Shah R.R. and Shah P.B., 2007., Development and Validation of a HPTLC method for the simultaneous estimation of Telmisarta and Hydrochlorothiazide in tablet dosage form., Indian J Pharm Sci., 69:202-5. V.
4. Bhaskara Raju and A. Lakshmana Rao Sri Vasavi Institute of Pharmaceutical Sciences, Tadepalligudem, Andhra Pradesh, India.V.V. Institute of Pharmaceutical Sciences, Gudlavalleru, Andhra Pradesh, India.
5. Ganesan M.(2010), “Method development and validation of Irbesartan using LCMS/MS: Application to pharmacokinetic studies”, J. Chem. Pharm. Res.,2 (4),740-746
6. Budavari. S: The Merck Index, An Encyclopedia of Chemicals, Drugs and Biologicals, White House Station, N. J., Thirteenth edition. 2001.
7. Williams, A.D: Foye’s Principles of Medicinal Chemistry, Fifth edition 2002.
8. Fell, A. F. Proceedings Analytical Division Chemical Society, 1978, 15, 260.
NOW YOU CAN ALSO PUBLISH YOUR ARTICLE ONLINE.
SUBMIT YOUR ARTICLE/PROJECT AT articles@pharmatutor.org
Subscribe to PharmaTutor Alerts by Email
FIND OUT MORE ARTICLES AT OUR DATABASE