ABOUT AUTHORS:
*1Patel Rina B., 2Patel Nilam K.
1M.pharm(Q.A), Department of Pharmaceutical Sciences
Hemchandracharya North Gujarat University,
2Asst. Professor, Dept. of Pharmaceutical Sciences
Department of Pharmaceutical Sciences, Hemchandracharya North Gujarat University, Patan. Gujarat-384265
*rina_patel2003@yahoo.com
ABSTRACT
A simple, sensitive, rapid, accurate, precise and economical Fourier transform infrared (FTIR) spectrophotometric method has been developed for the determination of Azelastine Hydrochloride (AZH) in nasal spray preparations. The IR spectrophotometric method was based on the determination of AZH by the measurement of the area of the infrared band corresponding to the carbonyl group centred at the band1636 cm-1. It was present in the AZH but not in Acetonitrile used as solvent and highest intensity was at the area 1701.08-1584.21 cm-1. The linearity of AZH was obtained in the concentration range of 5-100 μg/ml. The mean % recovery was 99.67 ± 0.57 %. The recovery studies confirmed accuracy of proposed method and low values of standard deviation confirmed precision of method.
REFERENCE ID: PHARMATUTOR-ART-2013
INTRODUCTION
Azelastine Hydrochloride Nasal Spray is an antihistamine available as a metered spray formulation for intranasal administration. Azelastine Hydrochloride is an H1 receptor antagonist, chemically it is 1-(2H)-phthalazinone, 4-[(4 chlorophenyl) methyl]-2-(hexahydro-1-methyl-1H-azepin-4yl)-, monohydrochloride. It is used in the treatment of Seasonal allergic rhinitis, non-allergic rhinitis.(1-2)Azelastine Hydrochloride is official in British Pharmacopoeia (BP).(3) The chemical structure AZH is shown in Fig.1 Literature survey reveals that LC-ESI/MS/MS, HPLC methods for the determination of AZH.(4-5) Literature survey also reveals Voltammetry, RP-HPLC, UV spectrophotometric methods for determination of AZH with other drugs.(6-8) There is no any IR spectrophotometric method is available for estimation of AZH. So aim of present work is to develop and validate simple, accurate and economical IR spectrophotometric method for estimation of AZH in its metered spray formulation.
MATERIALS AND METHODS
Apparatus
IR spectrophotometer Bruker-ALPHA[E] model, An analytical balance (Sartorius AG, Gottingen, Germany,), an ultrasonic bath (Equitron, Mumbai, Maharashtra, India) used in the study.
Reagents and Materials
AZH bulk powder was purchased from Chiti-chem Corporation. Baroda, Gujarat, India. The commercial fixed dose of AZH product (Arzep Nasal spray) containing 140 µg was procured from the local market which is manufactured by Cipla Pharma Limited. Acetonitrile is used as solvent for the preparation of different concentration of AZH.
Preparation of Standard and Sample Solution
The standard stock solution containing 100 μg/ml of AZH were prepared in acetonitrile. For sample solution, One ml of the Nasal spray preparation is taken out and transferred to a 50 ml volumetric flask. The content was mixed with 25 ml acetonitrile, sonicated for 15 min. to dissolve the drug as completely as possible. The solution was cooled at room temperature and made up to volume with acetonitrile. The solution was filtered through a Whatman filter paper no. 41 and transferred to a 50 ml volumetric flask. The residue on the filter paper was washed with acetonitrile and washings were collected in filtrate. 1.5 ml of above solution was aliquot into a 10 ml volumetric flask & diluted up to mark with acetonitrile to get final concentration of 3 µg/ml.
Methodology
The standard solution of AZH and acetonitrile as blank was scanned. The uncommon I.R peak was observed at the band 1636 cm-1. It was present in the AZH but not in acetonitrile used as solvent, shown in figure 2 and highest intensity was at the area 1701.08-1584.21cm-1.
METHOD VALIDATION
The proposed method was validated according to the International Conference on Harmonization (ICH) guidelines.
Linearity (Calibration curve):
Calibration curves were plotted over the concentration range of 5-100 µg/ml for AZH. Accurately prepared standard solutions of AZH (0.5, 1.0, 1.5, 2.0, 50, 10 ml) were aliquot in separate 10 ml volumetric flasks. Then diluted all solution up to mark with acetonitrile. The method involves the extraction of the active ingredient with acetonitrile and the measurement of the area of the infrared band corresponding to the carbonyl group centred at 1636 cm-1, which is typically in the range 1701.08-1584.21 cm-1.The calibration curves were constructed by plotting area versus concentration (µg/ml). Acceptance criteriais the correlation coefficient (r2) value should not be less than 0.995.
Method precision (repeatability):
The precision of the instrument was checked by repeated scanning and measurement of the area of the infrared band (n = 6) of 15 µg/ml AZH without changing the parameters for the method. The repeatability was expressed in terms of relative standard deviation (RSD).
Intermediate precision (reproducibility):
The intraday and interday precision of the proposed methods were performed by analyzing the corresponding responses 3 times on the same day and on 3 different days over a period of 1 week for 3 different concentrations of standard solutions of AZH (5, 10 and 15 µg/ml). The results were reported in terms of relative standard deviation (RSD).
Accuracy (recovery study):
The accuracy of the methods was performed by calculating recovery of AZH by the standard addition method. Known amounts of standard solutions of AZH were added at 80, 100 and 120% levels to prequantified sample solutions of 10 µg/ml AZH. At each level of the amount 3 determinations were performed. The amount of AZH was estimated by applying obtained values to regression equation.
Analysis of AZH in Nasal Spray preparation:
1.25 ml of preparation which is equivalent to 50 µg of AZH was transferred to a 25 ml volumetric flask. Acetonitrile was added to it and sonicated for 20 min. The solution was filtered through What man filter paper No. 41 and the volume was adjusted up to the mark with Acetonitrile. The responses of the sample solution were measured at the band 1636 cm-1 which represents the area 1701.08-1584.21cm-1 for quantification of AZH. The amounts of the AZH present in the sample solution were calculated by fitting the responses into the regression equation for AZH in the proposed method.
RESULTS AND DISCUSSION
The standard solution of AZH and acetonitrile as blank was scanned. The uncommon I.R peak was observed at the band 1636 cm-1. It was present in the AZH but not in acetonitrile used as solvent, shown in figure 2 and highest intensity was at the area 1701.08-1584.21cm-1.
Linear correlation was obtained between areas of spectrum versus concentrations of AZH in the ranges of 5-100µg/ml. The linearity of the calibration curve was validated by the high values of correlation coefficient of regression (Table 1, Figure 3). The RSD value of method precision for AZH was found to be 0.2624 %. (Table 1 ). Low relative standard deviation (less than 2 %) was indicates that the proposed method is repeatable.The low RSD values of intraday (0.239% - 1.622 %) and interday (0.238 % - 1.612 %)variations reveal that the proposed method provide acceptable intraday and interday variation for AZH at different concentration levels (5,10 and 15 µg/ml) (Table 1). LOD and LOQ values for AZH were found to be 0.179 µg/ml and 0.543 µg/ml (Table 1). These data show that this method is sensitive for the determination of AZH.
The recovery experiments were performed by the standard addition method. The mean % recovery of AZH was 99.67+ 0.576( Table 2). The proposed validated method was successfully applied to determine AZH in nasal spray preparation. The results obtained for AZH were comparable with the corresponding labelled amounts (Table 3). No interference of the excipients with the absorbance of interest appeared; hence the proposed method is applicable for the routine I.R spectrophotometric estimation of AZH in pharmaceutical dosage forms.
CONCLUSION
Based on the results, obtained from the analysis of described method, it can be concluded that the method has linear response in the range of 5 - 100 μg/ml with co-efficient of correlation, (r2) = 0.9997. The result of the analysis of pharmaceutical formulation by the proposed method is highly reproducible and reliable and it is in good agreement with the label claim of the drug. This is also a cost effective method. The additives usually present in the pharmaceutical formulation of the assayed sample did not interfere with determination of FL AZH. The method can be used for the routine analysis of the AZH in its individual dosage form without any interference of excipients.
ACKNOWLEDGEMENT
The authors are thankful to managements of Department of Pharmaceutical Sciences, Hemchandracharya North Gujarat University, Patan for providing needed facilities for this work.
Table 1: Regression analysis data and summary of validation parameters for the proposed method
|
Parameters |
Azelastine Hydrochloride |
|
I.R spectrometry |
|
|
Concentration range (µg/ml) |
5 – 100 |
|
Slope |
0.0131 |
|
Intercept |
0.0557 |
|
Accuracy |
99.67 + 0.576 |
|
Repeatability (%RSD, n=6) |
0.2624 |
|
Interday (n = 3) (%RSD) |
0.238-1.612 |
|
Intraday (n = 3) (%RSD) |
0.239-1.622 |
|
LOD(µg/ml) |
0.179 |
|
LOQ(µg/ml) |
0.543 |
RSD = Relative standard deviation. LOD = Limit of detection. LOQ = Limit of quantification
Table 2: Recovery data of proposed method
|
Drug |
Level |
Amount of sample taken (µg/ml) |
Amount of standard spiked (%) |
Intensity |
%Recovery |
Mean % Recovery ± SD |
|
Azelastine Hydrochloride |
I |
10 |
80 % |
0.292 |
100.212 |
100.212 ± 0.424 |
|
0.291 |
99.78 |
|||||
|
0.293 |
100.63 |
|||||
|
II |
10 |
100 % |
0.318
|
100.114 |
99.60 ± 0.583 |
|
|
0.317
|
99.73 |
|||||
|
0.315
|
98.96 |
|||||
|
III |
10 |
120 % |
0.344 |
100.03 |
99.22 ± 0.722 |
|
|
0.341 |
98.99 |
|||||
|
0.340 |
98.64 |
Table 3: Analysis of AZH by proposed method
|
Sample No. |
Label Claim |
Area of signal |
Amount Found |
% Label Claim |
|
AZH (mcg) |
AZH(mcg) |
AZH(mcg) |
||
|
1 |
50 |
0.698 |
49.030 |
98.061 |
|
2 |
50 |
0.699 |
49.106 |
98.213 |
|
3 |
50 |
0.698 |
49..030 |
98.061 |
|
4 |
50 |
0.699 |
49.106 |
98.213 |
|
5 |
50 |
0.698 |
49.030 |
98.061 |
|
6 |
50 |
0.706 |
49.641 |
99.282 |
|
Mean |
|
98.315 |
||
|
S.D. |
0.479 |
|||
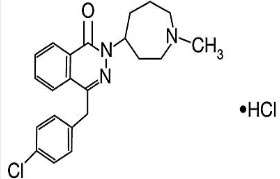
Figure 1: Chemical structures of Azelastine Hydrochloride.
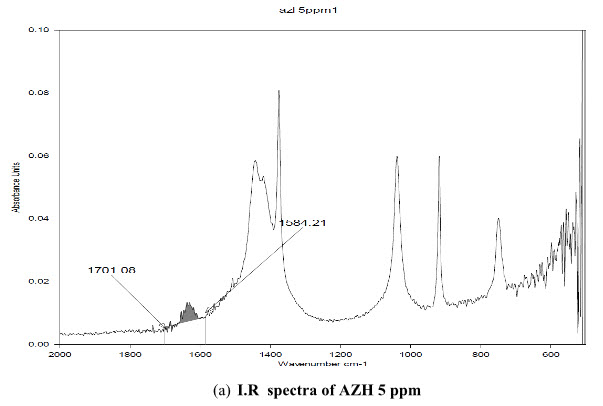
(a) I.R spectra of AZH 5 ppm
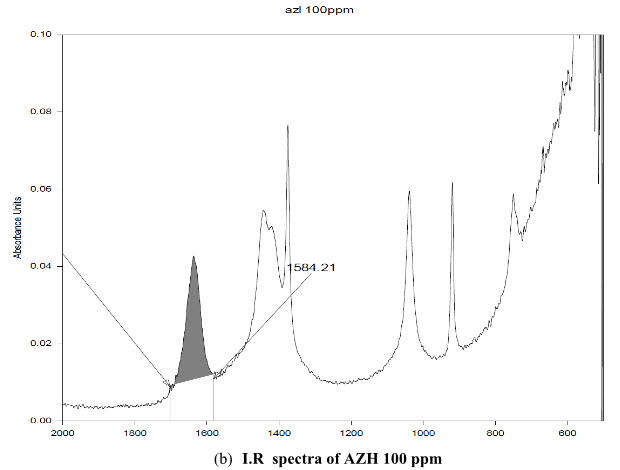
(b) I.R spectra of AZH 100 ppm
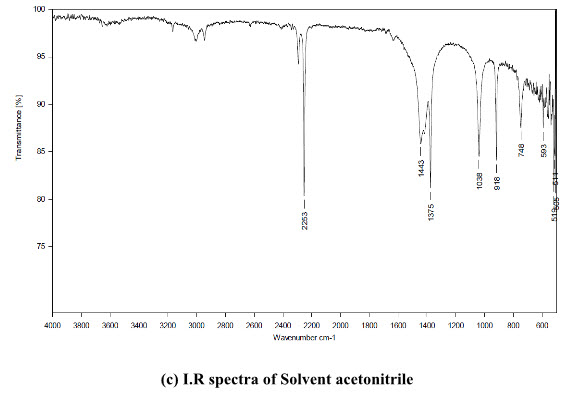
(c) I.R spectra of Solvent acetonitrile
Figure 2: I.R spectra of (a) AZH 5 ppm (b) AZH 100 ppm (c) Solvent acetonitrile
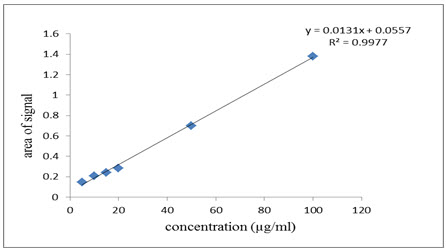
Figure.3: Linearity curve ofAzelastine Hydrochloride
REFERENCES
1. The Merk Index.14th edition white house, NJ, USA: Published by Merk Research Laboratories, Division of Merk and co., INC: 2006:900.
2. Azelastine Hydrochloride, The American Society of Health-System Pharmacists. drugs.com/monograph/AzelastineHydrochloride: html.Retrieved 3 April 2011.
3. British Pharmacopoeia Department of Health and Social Services for Northern Ireland, London: Stationery Publications,2007: 1:199.
4. Yoo-Sin Park, Shin-Hee Kim, Young-Jae Kim, Seok-Chul Yang, Min-Ho Lee, Leslie M. Shaw, Ju-Seop Kang. Determination of Azelastine in Human Plasma by Validated Liquid Chromatography Coupled to tandem Mass Spectrometry (LC-ESI/MS/MS).
International Journal of Biomed Sci.2010; 6(2):120-127. Pmid23675185pmcid:pmc3614744
5. Langevin CN, Pivonka J, Wichmann JK, Kucharczyk N, Sofia RD. High performance liquid chromatographic determination of azelastine and desmethylazelastine in guinea pig plasma and lung tissue. Biomed Chromatogr. 1993:7(1):7-11.
dx:doi.org/10.1002/bmc.1130070103
6. Sawsan A. Abdel-Razeq, Manal M. Foaud1, Nahla N. Salama, Shimaa Abdel-Atty, Naglaa El- Kosy. Voltammetric Determination of Azelastine-HCl and Emedastine Difumarate in Micellar Solution at Glassy Carbon and Carbon Paste Electrodes. Sensing in Electro analysis. 2011: 6:289-305.
7. K.Lalkshmi Narsimha Rao, K.Padmaja Reddy, K.Sudheerbabu , k.Saloman Raju, K.Visweswara Rao, Jafar vali Shaik. Simultaneous estimation of azelastine hydrochloride, fluticasone propionate, phenylethyl alcohol, benzalkonium choride by RP-HPLC method in Nasal Spray Preparations. Int.J.Res.Pharm.Sci. 2007: 1:473-480.
8. Patel Rina B, Patel Bhavika B, Thakkar Hiren S, Patel Pinkal R, Patel Nilam K, Patel Shirish R. Development and Validation of First Order Derivative Spectrophotometric Method for Simultaneous Estimation of Fluticasone Propionate and Azelastine Hydrochloride in Nasal Spray Preparations. Inventi Rapid: Pharm Analysis & Quality assurance. 2013 :3:1-5.
NOW YOU CAN ALSO PUBLISH YOUR ARTICLE ONLINE.
SUBMIT YOUR ARTICLE/PROJECT AT articles@pharmatutor.org
Subscribe to Pharmatutor Alerts by Email
FIND OUT MORE ARTICLES AT OUR DATABASE