{ DOWNLOAD AS PDF }
About Authors:
Mehul Kakdiya*1, Anup Patel2, Darshan Madiya1, Shital Faldu1
1Department of Quality Assurance, Smt. R. D. Gardi B. Pharmacy College, Rajkot, Gujarat, India
2B.M. Shah College of pharmaceutical Education and Research, Modasa, Gujarat, India
*kakdiyamehul@gmail.com
Abstract
UV Spectrophotometric method has been developed for simultaneous estimation of Paracetamol (PCM) and Propyphenazone (PP) in their combined pharmaceutical dosage form. This method utilizes methanol as a solvent and λmax of Paracetamol and Propyphenazone selected for analysis was found to be 249 nm and 274 nm respectively. Linearity was observed in the concentration range of 1-12 μg/ml for Paracetamol (r2=0.995) and 5-24 μg/ml for Propyphenazone (r2=0.997).The method was validated statistically and by recovery studies. The mean % recovery was 98.26-99.93% and 98.36-100.24% for Paracetamol and Propyphenazone respectively. Developed method was applied to pharmaceutical dosage form. The results were found to be within acceptance criteria according to ICH guideline. This method was simple, rapid, accurate and sensitive.
INTRODUCTION
Paracetamol (PCM) is chemically 4-hydroxyacetanilide (Figure 1-A) used as analgesic and antipyretic. [1]. it is major ingredient in numerous cold and flu medications and many prescription analgesics.[3]
Propyphenazone (PP) is one of the most popular pyrazolone derivative showing the analgesic, anti-pyretic activity by inhibiting cyclo oxygenase-2 in PGS synthesis pathway.[2]
The therapeutic importance of these two compounds justifies establishing analytical methods for its determination in pharmaceutical dosage form.
The chemical structures of Paracetamol and Propyphenazone are shown in Figure 1 (A), (B).[1, 4]
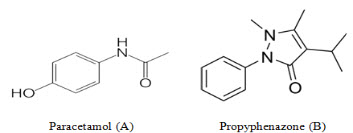
Figure-1: Chemical structure of (A) Paracetamol and (B) Propyphenazone
Both, Paracetamol and Propyphenazone, as NSAID, having same mechanism of action, is like PGS is part of the body’s inflammatory response to injury and inhibition of PG production around the body by blocking cyclo oxygenase enzymes also known as COX-1 and COX-2.[3]
Paracetamol is official in IP, BP and USP and is estimated by UV-Visible Spectrophotometric method as per IP, BP and USP. [4,5,6] Propyphenazone is official in IP, BP Pharmacopoeia.[4,5] Literature survey does not reveal any simple spectrophotometric method of Paracetamol and Propyphenazone in Pharmaceutical dosage form. So the objective of this work was to develop simple, precise and rapid spectrophotometric methods for combined pharmaceutical dosage form containing Paracetamol, Propyphenazone and excipients.
MATERIALS AND METHODS
Instrumentation
Double beam UV-visible spectrophotometer (heλios Alpha, Model - V 7.09) having two matched quartz cells with 1 cm light path. An Electronic analytical balance (Contech, CA34 Model) was used in the study.
Material and reagent
Paracetamol (PCM)was obtained from Meghmani pharma pvt.ltd. Ahmedabad and Propyphenazone (PP) bulk powder was kindly gifted by Vani pharma Pvt. Ltd, Hyderabad. Methanol reagent was supplied by college.
Preparation of Standard Stock solution of PCM and PP:
Accurately weighed quantity 100 mg of PCM and PP were transferred into separate 100 ml volumetric flask, dissolved and diluted up to mark with Methanol (100 ml). This will give a stock solution having strength of 1000 μg/ml of each.
Preparation of Working Standard Solution of PCM and PP:
100 µg/ml of PCM and PP solution were prepared by diluting 10 ml of stock solution to 100 ml with Methanol in separate 100 ml volumetric flask.
Suitable aliquots of this solution were diluted up to the mark with Methanol to get the concentration range of 1,3,5,7,9 μg/ml for PCM and 7, 11, 15, 19, 23μg/ml for PP.
Selection of analytical wavelength:
From working standard solution of PCM (100 μg/ml) and PP (100 μg/ml), 10 μg/ml for PCM and 10 μg/ml for PP were prepared respectively and each solution was scanned between 200-400 nm. PCM showed maximum absorbance at 249 nm and PP showed maximum absorbance at 274 nm, which was used as analytical wavelength for further analysis.
Preparation of calibration curve:
Standard solutions of PCM in the concentration range of 1 to 12μg/ml obtained by transferring (0.1, 0.3, 0.5, 0.7, 0.9 ml) of PCM stock solution (100 μg/ml) to the series of 10 ml volumetric flasks and standard solutions of PP in the concentration range of 5 to 24 μg/ml were obtained by transferring (0.7, 1.1, 1.5, 1.9, 2.3ml) of PP stock solution (100 μg/ml) to the series of 10 ml volumetric flasks. Then volume was adjusted up-to mark with Methanol. All dilutions were scanned in wavelength range of 200 nm to 400 nm. The absorbance was plotted against the respective concentrations to obtain the calibration curves.
VALIDATION PARAMETERS
Validation of developed method was carried out as per ICH guideline.[10] Parameters such as Linearity and range, Accuracy, Precision, LOD and LOQ were taken up as tests for analytical method validation.
Linearity and Range:
Linearity is expressed in terms of correlation co-efficient of linear regression analysis. The linearity responses was determined in the range of 1-12 μg/ml for PCM and 5-24 μg/ml for PP. Plot the calibration curve of absorbance verses concentration and determine correlation coefficient and regression equations for PCM and PP.
Precision
Precision of the method was determined in the terms of Repeatability, Intraday and Interday precision. Repeatability (% RSD) was assessed by analyzing test drug solution within the calibration range, six times on the same day. Intraday variation (% RSD) was determined by analysis of this solution three times on the same day. Interday precision (%RSD) was determined by analysis of this solution on three different days.
Limit of detection (LOD) and limit of quantitation (LOQ)
They were calculated as 3.3 σ/S and 10 σ/S respectively. Where σ is the standard deviation of the response (y-intercept) and S, is the mean of the slope of calibration plot.
Recovery Studies:
Recovery studies were done so as to check the accuracy of the method. Known amounts of standard solutions of PCM and PP were added to pre-quantified sample solutions of PCM and PP and absorbance were determined at 249 nm and 274 nm. Concentration of the drug in the mixture was calculated using the equations. The analysis was done in a set of 3 replicates.
Application of Proposed Method to Dosage form:
Weighed and finely powdered 20 Tablets. Accurately weighed and transferred equivalent to 100mg of Paracetamol and 100mg of Propyphenazone into a 100 mL volumetric flask. This solution was filtered through the Whatmann filter paper No. 41 and residues were washed with Methanol. The filtrate and washings were combined and volume was made-up to 100 ml with Methanol. 10 ml from above stock solution is transferred to 100 ml volumetric flask and dilute to 100 ml with Methanol. Take 1 ml from this solution and dilute up to 10 ml with Methanol to get final concentration as 10μg/mLof Paracetamol and 10 μg/mLof Propyphenazone.
Formation of Simultaneous Equation:[11]
A set of two simultaneous equations were framed using the mean absorptivity.
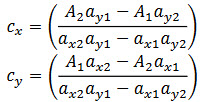
Where, A1, A2 are absorbance of mixture at 249 nm (λ1) and 274 nm (λ2) respectively, ax1 and ax2 are absorptivity of PCM at λ1 and λ2 respectively, ay1 and ay2 are absorptivity of PP at λ1 and λ2 respectively, Cx and Cy are concentrations of PCM and PP respectively.
RESULTS AND DISCUSSION
Absorption Maxima:
Absorption maxima of PCM and PP were detected at 249 nm (λ1) and 274 nm (λ2), respectively and overlain spectra was recorded Fig. 2. Regression characteristics for PCM and PP are shown in Table 4.
Method Validation:
The linearity range for PCM and PP were 1-12 μg/mL and 5-24 μg/mL respectively. Recovery studies was carried out by addition of standard drug solution to pre-analyzed dosage form solution at three different concentration levels taking into consideration percentage purity of added bulk drug sample. The results of the recovery studies are found to be satisfactory for PCM and PP and shown in Table 1 and 2 respectively. The result of assay procedure obtained was showed in Table 3. Summary of Other validation parameters including Repeatability, Intraday, Interday, LOD and LOQ were found to be satisfactory and are shown in Table 5.
CONCLUSION
Adding another NSAID to existing one is much more new approach and having many more advantages like in earlier days PCM formulation contain much large qty. of PCM and so by adding another NSAID like propyphenazone, we can minimize larger dose of PCM although the mechanism action still better than existing one or we getting potentiating mechanism of action.
The results obtained by applying the suggested procedures, it is proved that the proposed method is accurate, precise, economical and can be applied successfully in routine analysis for the estimation of PCMand PPin their combined pharmaceutical dosage form. The developed method was validated as par ICH guidelines.
ACKNOWLEDGEMENT
The authors are thankful to Smt. R. D. Gardi B. Pharmacy College, Rajkot, Gujarat, India for providing necessary facilities to carry out this work. We are also thankful to Vani pharma Pvt. Ltd.,Hyderabad for providing the free gift samples of Propyphenazone which was required for our research work.
FIGURE AND TABLES
Figure-2: Overlain Spectrum of Paracetamol and Propyphenazone in methanol.
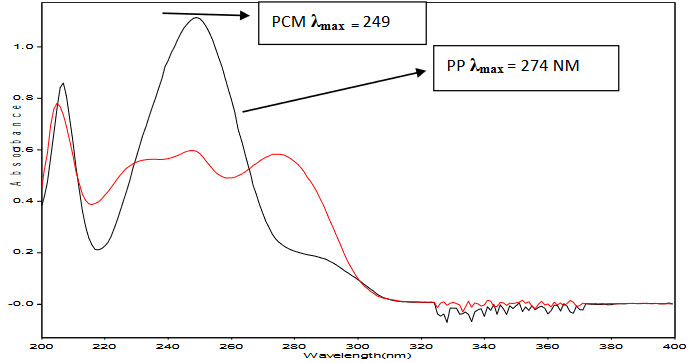
Table-1 Result of Recovery Studies for PCM in Dosage form:
|
Amount of PCM in mixture (μg/ml) |
Amount of Std PCM added (μg/ml) |
Total amount of PCM (μg/ml) |
Total amount of PCM found (μg/ml) Mean* ± SD |
%Recovery |
|
3 |
0 |
3 |
2.94 ± 0.06 |
98.2633 |
|
3 |
2.4 |
5.4 |
5.39 ± 0.059 |
99.93 |
|
3 |
3 |
6 |
5.98 ± 0.092 |
99.7316 |
|
3 |
3.6 |
6.6 |
6.54 ± 0.058 |
99.1121 |
[*=mean value of 3 determination]
Table-2 Result of Recovery Studies for PP in Dosage form :
|
Amount of PP in Mixture (μg/ml) |
Amount of Std PP added (μg/ml) |
Total amount of PP (μg/ml) |
Total amount of PP found (μg/ml) Mean* ± SD |
%Recovery |
|
11 |
0.0 |
11.0 |
10.82 ± 0.032 |
98.3636 |
|
11 |
8.8 |
19.8 |
19.59 ± 0.090 |
98.9393 |
|
11 |
11 |
22 |
21.74 ± 0.163 |
98.8181 |
|
11 |
13.2 |
24.2 |
24.26 ±0.308 |
100.2479 |
[*=mean value of 3 determination]
Table-3: Analysis of PCM and PP in Dosage form:
|
Tablet dosage form |
Label claim(mg) |
%Recovery ± SD (% of label claim*) |
||
|
PCM |
PP |
PCM |
PP |
|
|
|
100 |
100 |
99.16 ± 1.8402 |
101.11 ± 1.8028 |
[*=mean value of 5 determination]
Table-4: Regression Characteristics:
|
Characteristics |
PCM |
|
PP |
|
|
Wavelength (nm) |
249 (λ1) |
274 (λ2) |
249 (λ1) |
274 (λ2) |
|
Linearity (μg/ml) |
1-12 |
1-12 |
5-24 |
5-24 |
|
Molar absorptivity (lit. mol-1 cm-1) |
1533.10 |
384.57 |
970.91 |
962.43 |
|
Sandell’s sensitivity (μg/cm2/0.001 abs unit)
|
0.09862 |
0.39311 |
0.23719 |
0.239288 |
|
Regression Equation |
y = 0.175x-0.204 |
y =0.038x-0.039 |
y =0.209x-0.186 |
y =0.205x-0.180 |
|
Slope |
0.175 |
0.038 |
0.209 |
0.205 |
|
r2 |
0.995 |
0.998 |
0.997 |
0.997 |
|
Intercept |
0.204 |
0.039 |
0.186 |
0.180 |
|
S.D. of Intercept |
0.002517 |
0.000577 |
0.002517 |
0.000577 |
TABLE-5: VALIDATION PARAMETERS
|
Parameters |
PCM |
PP |
||
|
Wavelength(nm) |
249 |
274 |
249 |
274 |
|
Repeatability(%RSD) (n=6) |
0.2172 |
0.4231 |
0.06421 |
0.06618 |
|
Precision (%RSD) |
|
|
|
|
|
Intra-day (n=3) |
0.4225-0.8595 |
1.2977-1.4288 |
0.3268-1.1259 |
0.3502-0.5408 |
|
Inter-day (n=3) |
0.3690-0.3575 |
1.75-1.78 |
0.3305-0.6431 |
0.3809- 0.8176 |
|
LOD (μg/ml) |
0.04746 |
0.05010 |
0.03974 |
0.0092 |
|
LOQ (μg/ml) |
0.1438 |
0.1518 |
0.1204 |
0.027 |
|
% Recovery (n=3) |
98.2633-99.1121 |
98.3636-100.24 |
||
|
Assay(mean±S.D.) (n=5) |
99.16 ± 1.8402 |
101.11 ± 1.8028 |
||
LOD: Limit of Detection, LOQ: Limit of Quantitation, R.S.D.: Relative standard deviation, S.D.: Standard deviation
REFERENCES
1. Sweet man SC., The Martindale: The Complete Drug Reference; 36th Edn; Pharmaceutical Press, London, UK, 2009, pp 978.
2. Rang HP, Dale MM, Ritter JM and Moore PK, Pharmacology, 5th Edn; Elsevier, New Delhi 2006, pp 251,442.
3. Acess as “Mechanism of paracetamol & propyphenazone.PPT” by saline parvez and waqur ali (access on 20th march,2014)
4. Indian Pharmacopoeia, Volume 3, Ghaziabad: Govt. of Indian Ministry of Health and Family Welfare, the Controller of Publication, 2007, The Indian Pharmacopoeial Commission, pp 900-03.
5. British Pharmacopoeia, Volume I-II, London: The Department of Health,: HMSO Publication; 2009, pp 2789
6. The United States Pharmacopoeia-27, NF-22, Asian edition, Rockville, MD: The US Pharmacopoeial Convention, Inc., 2004, pp 1397-98.
7. Vichare V, Mujgond P, Tambe V and Dhole SN. Simultaneous Spectrophotometric determination of Paracetamol and Caffeine in Tablet formulation. International Journal of PharmTech Research, 2010, 2(4), 2512-2516.
8. Pawar PY, Joshi RS, Jangale KN and Wagh SK. Development and Validation of a Reversed Phase HPLC Method for Simultaneous Estimation of Enalapril maleate, Hydrochlorothiazide and Paracetamol in Pure and its Pharmaceutical Dosage Form. Pelagia Research Library, 2011, 2(5), 121-127.
9. Vyas AJ, Patel JK, Bhandari A, Chavda JR and Sheth NR. SimultaneousEstimation of Lornoxicam and Paracetmaol by Vierodt’s Method in APIand in Synthetic mixture. International Journal of ChemTech Research,2011, 3(3), 1269-1273.
10. ICH guideline Q2 (R1). Validation of analytical procedures: text and methodology. Geneva: 1996.
11. Beckett AH. And Stenlake JB. Practical Pharmaceutical Chemistry, part-II; 4th Edn; CBS Publisher and Distributors, New Delhi, 2007, pp 275-336
REFERENCE ID: PHARMATUTOR-ART-2172
|
PharmaTutor (ISSN: 2347 - 7881) Volume 2, Issue 6 Received On: 21/03/2014; Accepted On: 03/04/2014; Published On: 01/06/2014 How to cite this article: M Kakdiya, A Patel, D Madiya, S Faldu; Analytical Method Development and Validation for Simultaneous Estimation of Paracetamol and Propyphenazone in their Combined Pharmaceutical Dosage Form by simultaneous Equation Method; PharmaTutor; 2014; 2(6); 154-159 |
NOW YOU CAN ALSO PUBLISH YOUR ARTICLE ONLINE.
SUBMIT YOUR ARTICLE/PROJECT AT articles@pharmatutor.org
Subscribe to Pharmatutor Alerts by Email
FIND OUT MORE ARTICLES AT OUR DATABASE