Q.5. (b)How will you ascertain purity of sample by DSC? Discuss its principle.
Ans.5. (b) Principle
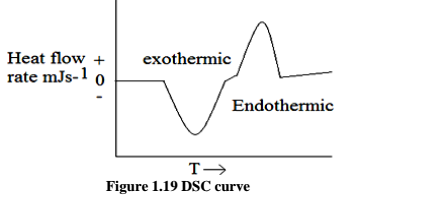
In DSC the heat flow is measure and plotted against temperature of furnace or time to get a thermo gram. This is the basis of Differential Scanning Calorimetry (DSC). The curve obtained in DSC is between dH/dtinmJ s-1 ormcal s-1 as a function of time or temperature. A typical DSC curve is shown in Fig. 1.19. The deviation observed above the base (zero) line is called exothermic transition and below is called endothermic transition. The area under the peak is directly proportional to the heat evolved or absorbed by the reaction, and the height of the curve is directly proportional to the rate of reaction. Therefore Eq. 11.1 is equally valid for DSC scheme also. The only difference is the calibration factor K in case of DSC is independent of temperature. This is a major advantage of DSC over DTA.
Peak area (A) = ± _ H m K …(1.7)
[adsense:336x280:8701650588]
Purity Determination by DSC
Weigh a pan and lid and add 2-3 mg of the sample to be determined. Reweigh, and remember to record the weights to the nearest 0.01 mg. determine the melting curve at a 1°C min-1 program rate to determine the approximate melting point of the sample. Then determine the melting curve from about 1-2°C below the melting point to just above the melting point at a scan rate of 0.2°Cmin-1. For this second run use the “purity cmbl” method. Remember to set the starting temperature and scan rate into the temperature column of Logger Pro. Also enter the slope of the indium calibration curve into the Iadj and Tb columns. For example, if the slope is 34.3 mcal sec-1 C then for I adj: integral ("Subtracted Potential", "Temperature")-0.5*"Subtracted Potential"^2/34.3 and for Tb: "Temperature"-"Subtracted Potential"/34.3 Use the same range setting as you used for the indium calibration, 2 mcal sec-1, at the slower scan rate. After the run is complete, subtract the baseline in the normal way by entering the slope and intercept into the appropriate spot in the P column. For example if your curve fit gives a slope of 3.456e-4 and an intercept of 0.312 you would enter for the P column: "Potential"-0.312-3.456e-4*"Temperature"
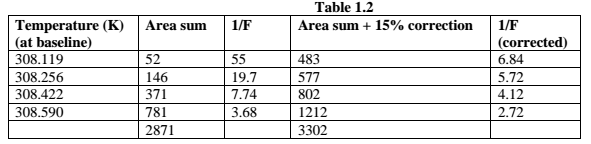
The bottom plot should now show the corrected area as a function of temperature. Integrate the full melting peak as you did for indium in the middle P vs. temperature plot. Determine the temperature where melting begins. Determine the temperature where the power, P, is about 2/3 of the maximum P value. Highlight the data between these two temperatures in the Logger Pro spreadsheet for Iadj and Tb, and copy and paste this data into Excel. Note that Iadj is the Area Sum in Table I before the pre-melting correction and Tb is the temperature extrapolated to the baseline, which is also the temperature needed for the calculations in Table I.
Factors affecting DSC
1. Instrumental factors:
a) Furnace heating rate.
b) Recording or chart speed
c) Furnace atmosphere
d) Geometry of sample holder/ location of sensors
e) Sensitivity of recording mechanism.
f) Composition of sample container.
2. Sample Characteristics:
a) Amount of sample
b) Solubility of evolved gases in sample.
c) Particle size
d) Heat of reaction
e) Sample packing
f) Nature of sample
g) Thermal conductivity.
Advantages of DSC
1. Small sample size 1 to 10 mg.
2. Simple and rapid procedure of analysis, typically 15 to 30 min. per determination.
3. Ideal for comparison of sample purity for example in quality control.
4. Does not require high absolute temperature accuracy (in contrast with melting point depression method).
5. Does not require calibration with known impurity levels, cryoscopic constant are obtained simultaneously.
6. The use of melting rather than a freezing curve avoid problems associated with super cooling of sample , poor crystallizability from melt , instability in the melt etc.