About Authors:
*Shrikrishna Baokar, Vinod Pawar, Smrutidevi Sonavane, Mahesh Rode, Deepali Kate
Shivnagar Vidya Prasarak Mandal’s College of Pharmacy,
Malegaon (Bk II), Tal-Baramati,
Dist- Pune, Maharashtra, India- 413115
*krishnabaokar@gmail.com
ABSTRACT
A Simple, sensitive, specific, spectrophotometric method has been developed for detection of Metformine Hydrochloride in pure and pharmaceutical formulations. The optimum condition for the analysis of the drug was established. Metformine exhibits absorption at 228 nm and obeyed beers law in the concentration range 02 to 10 ppm. The correlation coefficient was found 0.9988 and slope of line 0.1148. The %R.S.D. for intra assay precision of the method was found 1.08 whereas Inter assay precision was found to be 0.4433 (Average). The sample solution was stable up to 24 hours. The assay results were found to be in good agreement with label claim. The degradation study was checked at different conditions like with acid, alkali, dry heat, oxidative and photolytic degradation. All the results found in degradation study were satisfactory. So this proposed method was simple sensitive, precise, quick and useful for routine quality control.
Reference Id: PHARMATUTOR-ART-1298
INTRODUCTION
Metformin hydrochloride [1-2] chemically 1, 1-dimethlybiguanide hydrochloride is white crystalline powder, hygroscopic and freely soluble in water, used as a hypoglycaemic drug (fig. No.1)

Fig. No. 1 METFORMIN
Literature survey reveals that methods like HPLC [3-5] and Spectrophotometric [6] have been reported for estimation of the Metformin hydrochloride in pharmaceutical formulations and biological fluids. Official method includes UV Spectrophotometric method for estimation of the drug from the tablets. The present work describes the development and validation of a new Spectrophotometric method for estimation of Metformin hydrochloride in bulk and in tablets.
Experimentation
Instrumentation
A double–beam spectrophotometer Shimadzu UV-VIS 1700 was used for the detection of absorbance, Afcoset FX-300 as Weighing balance, Ultra pure sonicator, borosil glass apparatuses were used for experimental purpose.
Chemicals and Reagents
Metformine was supplied by Shalina Laboratories, jejuri as a gift sample. Marketed sample for the analysis which brought from local pharmacies. All other chemicals used in the analysis were AR grade.
Standard Solution
Accurately 100 mg Metformine was weighed and it was diluted with 100 ml methanol. From the resulting solution 1ml was taken and made up to 100 ml to give 10 ppm concentration of Metformine and its absorbance was recorded.
Sample Solution
20 tablets were weighed and powdered. From this, powder equivalent to 0.1gm of Metformine was taken and it was extracted with methanol and then the resulting solution is made up to 200 ml with Methanol. From the resulting solution 10 ml was taken and made up to 100 ml. then pipette out 10 ml from above solution dilute up to 100 ml with methanol, then absorbance of resulting solution was recorded
Validation
Validation of the analytical method for the determination of Metformin in Pure form and in pharmaceutical formulation was carried out as per ICH guidelines. Pharmaceutical formulation was carried out as per ICH guidelines. All the validation parameters shows in Table No. 1
TABLE NO. 1 VALIDATION PARAMETERS FOR METFORMIN
|
Parameters |
Lumefantrine |
|
Measured Wavelength |
228 nm |
|
Linearity Range |
2-10 ppm |
|
Correlation coeff. |
0.998846 |
|
Slope |
0.1148 |
|
Intersect |
-0.015 |
NOW YOU CAN ALSO PUBLISH YOUR ARTICLE ONLINE.
SUBMIT YOUR ARTICLE/PROJECT AT articles@pharmatutor.org
Subscribe to PharmaTutor Alerts by Email
FIND OUT MORE ARTICLES AT OUR DATABASE
LINEARITY
The method was validated according to ICH Q2B guidelines for validation of analytical procedures in order to determine the linearity, sensitivity, precision and of the analyte7, 8, 9, 10. For Metformin, five point calibration curves were generated with the appropriate volumes of the working standard solutions for UV methods. All the linearity data tabulated in Table No. 2 and linearity curve shown in Fig. No. 2
Table No. 2 -LINEARITY
|
Sr. No. |
Concentration (ppm) |
Absorbance |
|
1 |
2 |
0.22 |
|
2 |
4 |
0.456 |
|
3 |
6 |
0.643 |
|
4 |
8 |
0.908 |
|
5 |
10 |
1.142 |
|
|
Mean |
0.6738 |
|
SD |
0.3250 |
|
|
RSD |
0.4829 |
|
|
%RSD |
48.29 |
|
|
Correlation coeff. |
0.9988 |
|
|
Slope |
0.1148 |
|
|
Intersect |
-0.015 |
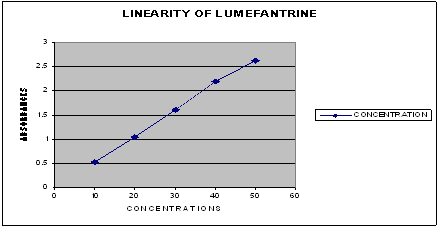
Fig. No. 2 Linearity Curve
ACCURACY
The accuracy of an analytical method is the closeness of the test results obtained by that method to the true value11. The accuracy of an analytical method is defined as the degree to which the determined value of analyte in a sample corresponds to the true value, which is tabulated in Table No. 3
TABLE NO. 3 -ACCURACY
|
Sr. No. |
Concentration |
Absorbance |
Result |
|
1 |
80 % |
0.913 |
Mean = 0.915 S. D. =0.003 % R.S.D. = 0.370 |
|
0.919 |
|||
|
0.915 |
|||
|
2 |
100 % |
1.142 |
Mean = 1.145 S. D. = 0.003 % R.S.D. = 0.262 |
|
1.149 |
|||
|
1.145 |
|||
|
3 |
120 % |
1.370 |
Mean = 1.381 S. D. = 0.024 % R.S.D. = 1.781 |
|
1.410 |
|||
|
1.365 |
PRECISION
The precision of an analytical procedure expresses the closeness of agreement (degree of scatter) between a series of measurements obtained from multiple sampling of the same homogeneous sample under the prescribed conditions12.
System Precision
The precision were determined with standard quality control samples (in addition to calibration standards) prepared in triplicate at different concentration levels Performing replicate analyses of the standard solutions was used to assess the precision and reproducibility of the proposed methods. The selected concentration within the calibration range was prepared in methanol and analyzed with the relevant calibration curves to determine the intra and inter day variability. The System and Method Precision were determined as the RSD %.
Method Precision
Method precision or intra-assay precision data are obtained by repeatedly analyzing, in one laboratory on one day, aliquots of homogeneous sample, each of which independently prepared according to method procedure.
All the data for System and Method Precision tabulated in Table No. 4 and 5 respectively.
TABLE NO 4-INTRA ASSAY PRECISION
|
Sr. No |
Conc.(ppm) |
Abs-I |
Abs-II |
Abs-III |
Avg %RSD |
|
1 |
2 |
0.223 |
0.223 |
0. 219 |
|
|
2 |
2 |
0.222 |
0.226 |
0.225 |
|
|
3 |
2 |
0.225 |
0.226 |
0.225 |
|
|
4 |
2 |
0.226 |
0.219 |
0.225 |
|
|
5 |
2 |
0.225 |
0.225 |
0.226 |
|
|
6 |
2 |
0.225 |
0.219 |
0.222 |
|
|
|
Avg |
2.2451 |
2.2253 |
2.2421 |
|
|
SD |
0.01479 |
0.03360 |
0.02473 |
||
|
RSD |
0.006587 |
0.01510 |
0.0110 |
||
|
%RSD |
0.65 |
1.5 |
1.10 |
1.08 |
TABLE NO. 5-INTER ASSAY PRECISION
|
Sr. No |
Conc.(ppm) |
Day -I |
Day-II |
Day III |
|
1 |
20 |
2.232 |
2.270 |
2.280 |
|
2 |
20 |
2.222 |
2.260 |
2.275 |
|
3 |
20 |
2.251 |
2.265 |
2.277 |
|
4 |
20 |
2.260 |
2.281 |
2.280 |
|
5 |
20 |
2.251 |
2.280 |
2.261 |
|
6 |
20 |
2.255 |
2.278 |
2.271 |
|
|
Avg |
2.2451 |
2.251 |
2.272 |
|
SD |
0.015002 |
0.008687 |
0.006683 |
|
|
RSD |
0.006682 |
0.003859 |
0.02941 |
|
|
%RSD |
0.66 |
0.38 |
0.29 |
RUGGEDNESS
The ruggedness of an analytical method is degree of reproducibility of test results obtained by the analysis of the same samples under a variety of normal test conditions, such as different laboratories, different analysts, different instruments, different lots of reagents, different elapsed assay times, different assay temperatures, different days etc. Data for ruggedness tabulated in Table No. 6
TABLE NO. 6-RUGGEDNESS
|
Sr. No |
Parameter |
Set I |
Set II |
|
1 |
System |
Shimadzu-1700 |
Systronics -119 |
|
2 |
Sample |
Batch No-X |
Batch No –Y |
|
3 |
Day |
Monday |
Tuesday |
|
4 |
Date |
30/01/2011 |
31/01/2011 |
|
5 |
Time |
11.45am |
3.45 pm |
|
6 |
Lab |
Analysis |
Chemistry |
|
7 |
Analyst |
24/08 |
19/07 |
|
8 |
Sample |
20ppm |
20ppm |
|
9 |
Absorbance |
2.286 |
2.280 |
|
10 |
Assay |
99.65 |
99.85 |
ROBUSTNESS
The evaluation of robustness should be considered during the development and development is on the type of procedure under study. Robustness of the method was checked by making slight deliberate changes in selected conditions like change in wavelength. It was observed that there were no marked changes in chromatograms, which demonstrated that the developed method is robust13. Instruments are susceptible to variations in analytical conditions, should be suitability controlled or a precautionary statement should be including in the procedure. Robustness data tabulated in Table No. 7
TABLE NO. 7 ROBUSTNESS
|
Sr. No. |
Concentration |
Wavelength |
Absorbance |
Result |
|
1 |
20 ppm |
239 |
1.927 |
Mean = 1.888 S. D. = 0.001 % R.S.D. = 0.105 |
|
1.931 |
||||
|
1.929 |
||||
|
2 |
20 ppm |
229 |
2.150 |
Mean = 2.154 S. D. = 0.002 % R.S.D. = 0.278 |
|
2.157 |
||||
|
2.154 |
NOW YOU CAN ALSO PUBLISH YOUR ARTICLE ONLINE.
SUBMIT YOUR ARTICLE/PROJECT AT articles@pharmatutor.org
Subscribe to PharmaTutor Alerts by Email
FIND OUT MORE ARTICLES AT OUR DATABASE
STABILITY INDICATING STUDY
DEGRADATION STUDIES 14
The International Conference on Harmonization (ICH) guideline entitled stability testing of new drug substances and products requires that stress testing be carried out to elucidate the inherent stability characteristics of the active substance. The aim of this work was to perform the stress degradation studies on the Metformin using the proposed method.
Hydrolytic degradation under acidic condition
To 3 ml of stock solution (1000 μg/ml) of Metformin, 1 ml of 3 N HCl was added in 10 ml of volumetric flask and the volume was made up to the mark with methanol. Then, the volumetric flask was kept at normal condition for 90 minutes. After 60 min. time interval, 1 ml of solution was pipettes out from this flask, neutralized and diluted with methanol in order to make the volume up to 10 ml and the dilution was carried out to achieve the appropriate concentration (20 μg/ml). This solution was taken in cuvette. For the blank, 0.5 ml solution of 3N HCl and 0.5 ml solution of 3N NaOH were diluted with methanol in 10 ml of volumetric flask was repeated. After 90 min. time interval the same procedure is repeated and the dilution was carried out to achieve the appropriate concentration (20μg/ml). This solution was taken in cuvette and absorbance is recorded against blank solution.
Hydrolytic degradation under alkaline condition
To 3 ml of stock solution of Metformin, 1 ml of 0.1 N NaOH was added in 10 ml of volumetric flask and made up the volume to the mark with methanol. Volumetric flask was kept at normal condition for 90 min. After 90 min time interval, 1 ml of solution was pipettes out from this flask, neutralized and diluted with methanol in order to make the volume up to 10 ml and the dilutions were carried out to achieve the appropriate concentration (20 μg/ml). The solution was then taken in cuvette. For the blank, 0.5 ml solution of 0.1N HCl and 0.5 ml solution of 0.1N NaOH diluted with methanol in 10 ml of volumetric flask. After 90 min. time interval the same procedure is repeated and the dilution was carried out to achieve the appropriate concentration (20μg/ml). This solution was taken in cuvette and absorbance is recorded against blank solution.
Dry heat induced degradation
Metformin sample was taken in a Petri plate and exposed to a temperature of 70°c for 48 hours in an oven. After 48 hours, 10 mg of the sample was diluted with methanol in order to make the volume up to 10 ml. From this solution, dilutions were carried out to achieve the appropriate concentration (20μg/ml) and the solution was taken in cuvette for the UV-Vis analysis.
Oxidative degradation
To 1.5 ml of the stock solution of Metformin (1000 μg/ml), 1 ml of 30 % w/v of hydrogen peroxide added in 10 ml of volumetric flask and the volume was made up to the mark with methanol . The volumetric flask was then kept at room temperature for 15 min. For the blank, 1 ml of the 30 % w/v of hydrogen peroxide was kept at normal condition for overnight in 10 ml of volumetric flask. Both solutions were heated on boiling water bath to remove the excess of hydrogen peroxide. Finally after 15 minutes dilutions were made from the stock solution to achieve the required concentration (30μg/ml). The solution was then taken in a cuvette and analyzed.
Photolytic degradation
Sample of Metformin was exposed to near ultra violet lamp in photostablity chamber providing illumination of not less than 1.2 million lux hours. 10 mg sample was dissolved methanol and volume made up to 10 ml. From this solution appropriate dilution (20μg/ml) was made using methanol and taken in cuvette for the UV analysis.
TABLE NO. 8 STRESS DEGRADATION STUDY
|
Condition |
Time |
% Degradation |
|
Hydrolytic degradation of 3 N HCl |
60 min |
94.83 |
|
90 min |
97.43 |
|
|
Hydrolytic degradation of 0.1 N NaOH |
60 min |
93.50 |
|
90 min |
98.87 |
|
|
Photolytic degradation |
3 Hrs |
95.75 |
|
6 Hrs |
97.43 |
|
|
Dry Heat degradation |
48 Hrs. |
94.74 |
|
Oxidative degradation |
15 min |
98.09 |
RESULTS AND DISCUSSION
Linearity of the drug was obtained in the range of 2 ppm to 10 ppm of Metformin.
The linearity coefficient and percentage curve fitting was found to be 0.9994 and 99.98% for Metformin.
Accuracy of the method was determined through the recovery studies of the drugs. Recovery of the drugs was well within the acceptance limit (99% - 101%).
Precision of the method was determined by analyzing the drug formulation by replicate injections and precision of the system was determined by mixed standard solutions.
Percent RSD of the analyte was found to be within the limit of 2%, thus the developed method was found to provide high degree of precision and reproducibility.
Ruggedness was determined by performing the assay with same condition on different days, by different analysts, different instrument and different day and time. The test results were found within limit 99 – 101%. The results were found to be reproducible, in spite of variations in conditions which could be normally expected from analysts to analysts.
Robustness was determined by carrying out the assay during change Wavelength. Percent RSD was found to be within the limit NMT 2%. The values of RSD obtained with the change in wavelength ratio makes it possible to carry out the method for metformin with a small variation in wavelength.
System suitability was determined by performing the assay with the same sample repeatedly.
ACKNOWLEDGMENT
The authors were thankful to Shalina Laboratoris, Jejuri (Maharashtra-India) for providing gift sample of Metformin. We would also like to thanks Principal and Management of Shivnagar Vidya Prasarak Mandal’s College of Pharmacy for providing all the facilities to complete this work successfully.
REFERENCES
1. Indian Pharmacopoeia, Government of India, Ghaziabad. The Indian Pharmacopoeia Commission. (2007); 2: 1358.
2. British Pharmacopoeia, Her. Majesty’s Stationary Office. London. UK. (2009); 1 and 2: 3813.
3. European Pharmacopoeia. Council of Europe, France. 3rd Edition. 1997; 55.
4. The United States Pharmacopoeia. US Pharmacopoeial convention. Inc. Rockville, MD. 31st Revision. (2008); 2640.
5. Jain AK and Agrawal R K. Indian J. Pharm. Sci. (2002); 64 (1): 88-91.
6. S. AbuRuz, J. Millership and J. McElnay, Journal of Chromatography B. (2005); 817 (2): 277-286.
7. F.W. Fifield and D. Kealey, 5th Edition, Black Well Science Ltd. Principles and Practice of Analytical Chemistry, (2000) pp. 270 – 276.
8. C. Hokanson, A Life Cycle Approach to the Validation of Analytical Methods During Pharmaceutical Prod-uct Development, Part – II: Changes and the Need for Additional Validation, Pharm. Tech., 92 -100 (1994).
9. J.M. Green. A Practical Guide to Analytical Method Validation, Anal. Chem. News and Features, (1996), 305A – 309A
10. J. Vessman, Selectivity or Specificity? Validation of Ana-lytical Methods from the Perspective of an Analytical Chemist in the Pharmaceutical Industry, J. Pharm and Biomed. Anal., (1996), 14, 867 – 869.
11. Shrikrishna B. Baokar, B. Shirke, V. Sivanand, G.K. Pratheesh, Analytical method development and validation for esteemation of sildenafil citrate from tablet dosage form by RP-HPLC, Int. J. Res. Phar.Sci. (2011), 2(2), 130-136.
12. Baokar Shrikrishna, Pawar Vinod , Sonawane S.H., High Performance Liquid Chromatographic Method Development and Validation of Cholesterol Inhibitor Drug, Journal of Pharmacy Research, (2011) ,4(7), 2313-2316.
13. Baokar Shrikrishna B., Erande R.S., Shaikh S.G. Analytical Method Development and Validation for Estimation of Ezetimibe from Tablet Dosage Form by Using RP-HPLC, Int. J. of Res. in Pharm. and Biomed. Sci., (2011), Vol. 2 (2), 833-841
14. Suddhasattya dey, Y.Vikram reddy, T.Reddy, Method development and validation for estimation of atazanvir in bulk and pharmaceutical dosage forms and its stress degradation studies using UV-VIS spectrophotometric method, Int. J. of Pharm. And Biosci, (2010), Vol.1, Issue 3.
NOW YOU CAN ALSO PUBLISH YOUR ARTICLE ONLINE.
SUBMIT YOUR ARTICLE/PROJECT AT articles@pharmatutor.org
Subscribe to PharmaTutor Alerts by Email
FIND OUT MORE ARTICLES AT OUR DATABASE