About Authors:
Jasinth. Danda*, Dr. P.Venkateswara Rao, P.Rama Bharathi, B.Madhavi, T.Swathi, Satya Lakshmi. Balla
A.M Reddy Memorial College of Pharmacy,
Department of Pharmaceutical Analysis
Narasaraopet, ANU University, Guntur.
Jasinthdanda18@gmail.com
1. Introduction
Chromatography is relatively a new technique which was first invented by M.Tsweet, a botanist in 1906 in Warsaw. He was successful in doing the separation of chlorophyll, xanthophylls and several other coloured substances by percolating vegetable extracts through a calcium carbonate. The calcium carbonate acts as absorbent and the different substances got adsorbed to different extents and this gives rise to coloured bands at different positions on the column. Tsweet termed this coloured bands as chromatogram and the method as chromatography after the Greek words chroma and graphos meaning colour and writing respectively.
REFERENCE ID: PHARMATUTOR-ART-2060
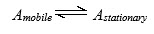
Definition: Chromatography is the separation of mixture into individual components using a stationary phase and mobile phase. It involves the following steps
- Adsorption of a substance or substances in stationary phase.
- Separation of the adsorbed substances by mobile phase
- Recovery of the separated substances by a continuous flow of the mobile phase; the method being called elution
- Qualitative and quantitative analysis of eluted substances
Few methods of chemical analysis are truly specific to a particular analyte. It is often found that the analyte of interest must be separated from the myriad of individual compounds that may be present in a sample. As well as providing the analytical scientist with methods of separation, chromatographic techniques can also provide methods of analysis.
Chromatography involves a sample (or sample extract) being dissolved in a mobile phase (which may be a gas, a liquid or a supercritical fluid). The mobile phase is then forced through an immobile, immiscible stationary phase. The phases are chosen such that components of the sample have differing solubilities in each phase. A component which is quite soluble in the stationary phase will take longer to travel through it than a component which is not very soluble in the stationary phase but very soluble in the mobile phase. As a result of these differences in mobilities, sample components will become separated from each other as they travel through the stationary phase.
Techniques such as H.P.L.C. (High Performance Liquid Chromatography) and G.C. (Gas Chromatography) use columns - narrow tubes packed with stationary phase, through which the mobile phase is forced. The sample is transported through the column by continuous addition of mobile phase. This process is called elution. The average rate at which an analyte moves through the column is determined by the time it spends in the mobile phase.
Distribution of analytes between phases
The distribution of analytes between phases can often be described quite simply. An analyte is in equilibrium between the two phases;
The equilibrium constant, K, is termed the partition coefficient; defined as the molar concentration of analyte in the stationary phase divided by the molar concentration of the analyte in the mobile phase.
The time between sample injection and an analyte peak reaching a detector at the end of the column is termed the retention time (tR ). Each analyte in a sample will have a different retention time. The time taken for the mobile phase to pass through the column is called tM.
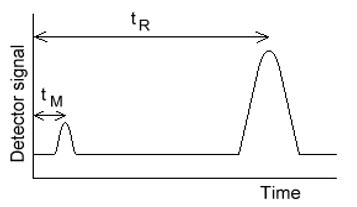
A term called the retention factor, k', is often used to describe the migration rate of an analyte on a column. You may also find it called the capacity factor. The retention factor for analyte A is defined as;
k'A = t R - tM / tM
t R and tM are easily obtained from a chromatogram. When an analytes retention factor is less than one, elution is so fast that accurate determination of the retention time is very difficult. High retention factors (greater than 20) mean that elution takes a very long time. Ideally, the retention factor for an analyte is between one and five.
We define a quantity called the selectivity factor, a , which describes the separation of two species (A and B) on the column;
a = k 'B / k 'A
When calculating the selectivity factor,
species A elutes faster than species B. The selectivity factor is always greater than one.
Band broadening and column efficiency
To obtain optimal separations, sharp, symmetrical chromatographic peaks must be obtained. This means that band broadening must be limited. It is also beneficial to measure the efficiency of the column.
The Theoretical Plate Model of Chromatography
The plate model supposes that the chromatographic column is contains a large number of separate layers, called theoretical plates. Separate equilibrations of the sample between the stationary and mobile phase occur in these "plates". The analyte moves down the column by transfer of equilibrated mobile phase from one plate to the next.
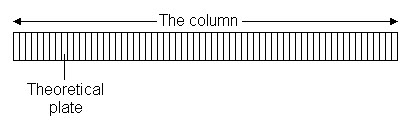
It is important to remember that the plates do not really exist; they are a figment of the imagination that helps us understand the processes at work in the column.They also serve as a way of measuring column efficiency, either by stating the number of theoretical plates in a column, N (the more plates the better), or by stating the plate height; the Height Equivalent to a Theoretical Plate (the smaller the better).
If the length of the column is L, then the HETP is
HETP = L / N
The number of theoretical plates that a real column possesses can be found by examining a chromatographic peak after elution;
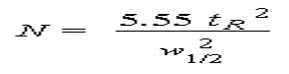
where w1/2 is the peak width at half-height.
As can be seen from this equation, columns behave as if they have different numbers of plates for different solutes in a mixture.
The Rate Theory of Chromatography
A more realistic description of the processes at work inside a column takes account of the time taken for the solute to equilibrate between the stationary and mobile phase (unlike the plate model, which assumes that equilibration is infinitely fast). The resulting band shape of a chromatographic peak is therefore affected by the rate of elution. It is also affected by the different paths available to solute molecules as they travel between particles of stationary phase. If we consider the various mechanisms which contribute to band broadening, we arrive at the Van Deemter equation for plate height;
HETP = A + B / u + C u
where u is the average velocity of the mobile phase. A, B, and C are factors which contribute to band broadening.
Eddy diffusion:
The mobile phase moves through the column which is packed with stationary phase. Solute molecules will take different paths through the stationary phase at random. This will cause broadening of the solute band, because different paths are of different lengths.
Longitudinal diffusion
The concentration of analyte is less at the edges of the band than at the center. Analyte diffuses out from the center to the edges. This causes band broadening. If the velocity of the mobile phase is high then the analyte spends less time on the column, which decreases the effects of longitudinal diffusion.
Resistance to mass transfer
The analyte takes a certain amount of time to equilibrate between the stationary and mobile phase. If the velocity of the mobile phase is high, and the analyte has a strong affinity for the stationary phase, then the analyte in the mobile phase will move ahead of the analyte in the stationary phase. The band of analyte is broadened. The higher the velocity of mobile phase, the worse the broadening becomes.
VanDeemter plots
A plot of plate height vs. average linear velocity of mobile phase.
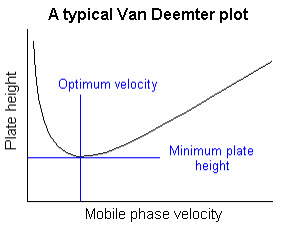
Such plots are of considerable use in determining the optimum mobile phase flow rate.
Resolution
Although the selectivity factor, a, describes the separation of band centres, it does not take into account peak widths. Another measure of how well species have been separated is provided by measurement of theresolution. The resolution of two species, A and B, is defined as
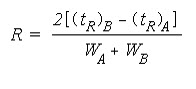
Baseline resolution is achieved when R = 1.5
It is useful to relate the resolution to the number of plates in the column, the selectivity factor and the retention factors of the two solutes;
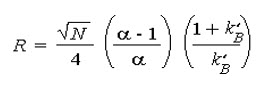
To obtain high resolution, the three terms must be maximised. An increase in N, the number of theoretical plates, by lengthening the column leads to an increase in retention time and increased band broadening - which may not be desirable. Instead, to increase the number of plates, the height equivalent to a theoretical plate can be reduced by reducing the size of the stationary phase particles.
It is often found that by controlling the capacity factor, k', separations can be greatly improved. This can be achieved by changing the temperature (in Gas Chromatography) or the composition of the mobile phase (in Liquid Chromatography).
The selectivity factor, a, can also be manipulated to improve separations. When a is close to unity, optimising k' and increasing N is not sufficient to give good separation in a reasonable time. In these cases, k' is optimised first, and then a is increased by one of the following procedures:
- Changing mobile phase composition
- Changing column temperature
- Changing composition of stationary phase
- Using special chemical effects (such as incorporating a species which complexes with one of the solutes into the stationary phase)
2. TYPES OF CHROMATORAPHY:
Based on adsorption:
1. Gas solid chromatography:In this type gas is used as mobile phase and solid substances are used as stationary phase. It is not widely used because of limited number of stationary phases.
2. Thin layer chromatography: In this type a thin layer of adsorbent is coated on a chromatographic plate. The mobile phase solvent flows through because of capillary action.
3. Column chromatography: when a column of stationary phase is used and a liquid mobile phase is used.
4. HPTLC: It is a sophisticated and automatic form of TLC. In this high pressure is applied for movement of mobile phase.
5. HPLC: It is called as high pressure liquid chromatography because high pressure is used when compared to classical column chromatography.
6. UPLC: It is called as ultra performance liquid chromatography. It is derived from HPLC.
Based on partition:
1. Gas liquid chromatography: in this type gas is used as a mobile phase and liquid coated on an inert solid support is used as stationary phase.
2. Paper Partition chromatography: In which moisture/ water present in the filter paper acts as stationary phase and another mobile phase is used as solvent.
3. Column partition chromatography: in this liquid coated on an inert solid support is used as stationary phase and liquid solvent is used as mobile phase.
- Based on exchange of ions:
Ion exchange chromatography: Ion exchange chromatography is the process by which a mixture of similar charged ions can be separated by using an ion exchange resin which exchanges ions according to their relative affinities.
- Based on molecular exclusion:
Gel permeation chromatography: A gel is used to separate the components of a mixture according to their molecular sizes. The solvent used can be of aqueous or non aqueous type.
- Based on migration of electrons:
Electrophoresis: It may be defined as a phenomenon of differential migration of individual ions or colloidal aggregates through an electrolyte solution under the influence of spatially uniform electric field.
e.g. Zone electrophoresis, Capillary electrophoresis
3. INTRODUCTION TO UPLC:
High performance liquid chromatography (HPLC) is proven technique that has been used in laboratories worldwide over the past 30-plus years. One of the primary drivers for the growth in this technique has been the evolution of packing materials used to effect separation. An underlying principle of HPLC dictates that as column packing particle size decreases, efficiency and thus resolution also increases. The classic separation method is of HPLC (High Performance Liquid Chromatography) with many advantages like robustness, ease of use, good selectivity and adjustable sensitivity. Its main limitation is the lack of efficiency compared to gas chromatography or the capillary electrophoresis due to low diffusion coefficients in liquid phase, involving slow diffusion of analytes in the stationary phase. The Van Demeter equation shows that efficiency increases with the use of smaller size particles but this leads to a rapid increase in back pressure, while most of the HPLC system can operate only up to 400 bar. That is columns filled with particles of about 2μm are used with these systems, to accelerate the analysis without loss of efficiency, while maintaining an acceptable loss of load. As particle size decreases to less than 2.5μm, there is a significant gain in efficiency and it’s doesn’t diminish at increased linear velocities or flow rates according to the common Van Demeter equation3.By using smaller particles, speed and peak capacity (number of peaks resolved per unit time) can be extended to new limits which describes the relationship between linear velocity (flow rate) is known as Ultra Performance. To improve the efficiency of HPLC separations, the following can be done which lead to the development of new chromatographic technique called UPLC:
A. work at higher temperatures- allows high flow rates by reducing the viscosity of mobile phase which significantly reduces back pressure
B. use of monolithic columns- contains polymerized porous support structure that provide lower flow resistances than conventional particle-packed columns.
UPLC refers to Ultra Performance Liquid Chromatography, which improves in three areas:
1. Chromatographic resolution
2. Speed
3. Sensitive analysis
It uses fine particles and saves time and reduces solvent consumption. This new category of analytical separation science retains the practicality and principles of HPLC while increasing the overall interrelated attributes of speed, sensitivity and resolution. Today’s pharmaceutical industries are looking for new ways to cut cost and shorten time for development of drugs while at the same time improving the quality of their products and analytical laboratories are not exception in this trend. Speed allows a greater number of analyses to be performed in a shorter amount of time thereby increasing sample throughput and lab productivity. These are the benefits of faster analysis and hence the ultra performance liquid chromatography. A typical assay was transferred and optimized for UPLC system to achieve both higher sample analysis throughput and better assay sensitivity. Analysis of operation cost and sample throughput found UPLC cost advantageous over HPLC.
4. PRINCIPLE:
The UPLC is based on the principal of use of stationary phase consisting of particles less than 2 μm (while HPLC columns are typically filled with particles of 3 to 5 μm). The underlying principles of this evolution are governed by the van Demeter equation, which is an empirical formula that describes the relationship between linear velocity (flow rate) and plate height (HETP or column efficiency). The Van Demeter curve, governed by an equation with three components shows that the usable flow range for a good efficiency with a small diameter particles is much greater than for larger diameters.
H=A+B/v+Cv
where A, B and C are constants and v is the linear velocity, the carrier gas flow rate. The A term is independent of velocity and represents "eddy" mixing. It is smallest when the packed column particles are small and uniform. The B term represents axial diffusion or the natural diffusion tendency of molecules. This effect is diminished at high flow rates and so this term is divided by v. The C term is due to kinetic resistance to equilibrium in the separation process. The kinetic resistance is the time lag involved in moving from the gas phase to the packing stationary phase and back again. The greater the flow of gas, the more a molecule on the packing tends to lag behind molecules in the mobile phase. Thus this term is proportional to v. Therefore it is possible to increase throughput, and thus the speed of analysis without affecting the chromatographic performance. The advent of UPLC has demanded the development of a new instrumental system for liquid chromatography, which can take advantage of the separation performance (by reducing dead volumes) and consistent with the pressures (about 8000 to 15,000 PSI, compared with 2500 to 5000 PSI in HPLC). Efficiency is proportional to column length and inversely proportional to the particle size. Therefore, the column can be shortened by the same factor as the particle size without loss of resolution. Efficiency is three times greater with 1.7 μm particles compared to 5 μm particles. Resolution is 70% higher than with 5 μm particles and 40% higher than with 3.5 μm particles. High speed is obtained because column length with 1.7 μm particles can be reduced by a factor of 3 compared to 5 μm particles for the same efficiency and flow rate can be three times higher. The application of UPLC resulted in the detection of additional drug metabolites, superior separation and improved spectral quality.
5.THEORY OF SEPARATIONS USING SMALLER PARTICLES:
According to van Demeter equation, smaller particles provide not only increased efficiency, but also the ability to do work at increased linear velocity without a loss of efficiency, providing both resolution and speed. Efficiency is the primary separation parameter behind UPLC since it relies on the same selectivity and retentivity as HPLC. In the fundamental resolution equation; resolution is proportional to the square root of N.
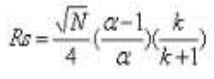
Where N is number of theoretical plates, α is Selectivity factor and k is mean retention factor. But since N is inversely proportional to particle size (dp).
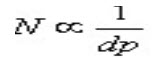
as the particle size is lowered by thrice i.e. from 5 mm to 1.7 mm, N is increased by three and the resolution by square root of three i.e. 1.7. N is also inversely proportional to the square of the peak width.

This illustrates that the narrower the peaks are, the easier they are to separate from each other. Also peak height is inversely proportional to the peak width (w):
So as the particle size decreases to increase N and subsequently Rs, an increase in sensitivity is obtained, since narrower peaks are taller peaks. Narrower peaks also mean more peak capacity per unit time in gradient separations, desirable for many applications such as natural extracts, peptide maps etc. still another equation comes in to force from the van Demeter plot when moving toward smaller particles:
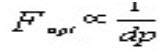
As particle size decreases, the optimum flow rate (Fopt) to reach maximum N increases. But since back pressure is proportional to flow rate, smaller particle sizes require much higher operating pressure and a system properly designed for the same. Higher resolution and efficiency can be level further when analysis speed is the primary objective. Efficiency is proportional to column length and inversely proportional to the particle size:
Therefore the column can be shortened by the same factor as the particle size without loss of resolution. Using a flow rate three times higher due to smaller particles and shortening the column by one third, the separation is completed in 1/9th the time while maintaining resolution
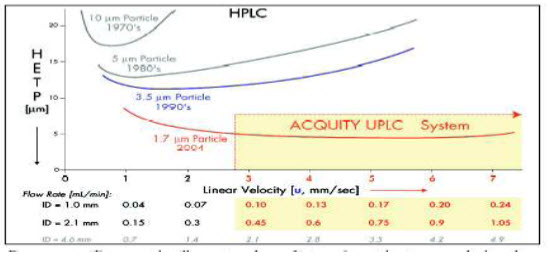
Figure 1. Van Deemter plot illustrating the evolution of particle sizes over the last three decades
At Constant Column Length
|
|
Resolution improvement |
Speed improvement |
Sensitivity improvement |
Back pressure |
|
5 to 1.7 μm particles |
1.7X |
3X |
1.7X |
27X |
|
3 to 1.7 μm particles |
1.3X |
2X |
1.3X |
6X |
At Constant L/dp Ratio
|
|
Resolution improvement |
Speed improvement |
Sensitivity improvement |
Back pressure |
|
5 to 1.7 μm particles |
1.7X |
3X |
1.7X |
27X |
|
3 to 1.7 μm particles |
1.3X |
2X |
1.3X |
6X |
Therefore it is possible to increase throughput, and thus the speed of analysis without affecting the chromatographic chromatography, which can take advantage of the separation performance. The advent of UPLC has demand a new instrumental system for liquid chromatography, which can take advantage of the separation performance (by reducing dead volumes) and consistent with the pressures (about 8000 to 15,000 PSI, compared with 2500 to 5000 PSI in HPLC). Efficiency is proportional to column length and inversely proportional to the particle size. Therefore, the column can be shortened by the same factor as the particle size
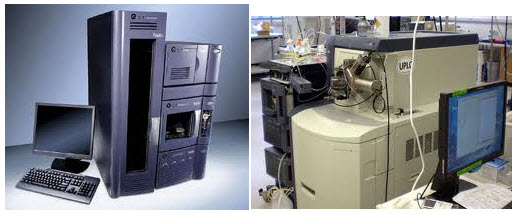
6. INSTRUMENTATION:
A.PUMPING SYSTEMS:
Achieving small particle, high peak capacity separations requires a greater pressure range than that achievable by today's HPLC instrumentation. The calculated pressure drop at the optimum flow rate for maximum efficiency across a 15 cm long column packed with 1.7 μm particles is about 15,000 psi. Therefore a pump capable of delivering solvent smoothly and reproducibly at these pressures, which can compensate for solvent compressibility and operate in both the gradient and isocratic separation modes.
B.SAMPLE INJECTION
In UPLC, sample introduction is critical. Conventional injection valves, either automated or manual, are not designed and hardened to work at extreme pressure. To protect the column from extreme pressure fluctuations, the injection process must be relatively pulse-free and the swept volume of the device also needs to be minimal to reduce potential band spreading. A fast injection cycle time is needed to fully capitalize on the speed afforded by UPLC, which in turn requires a high sample capacity. Low volume injections with minimal carryover are also required to increase sensitivity21. There are also direct injection approaches for biological samples.
C.SAMPLE MANAGER
The sample manager also incorporates several technology advancements. Using pressure assisted sample introduction, low dispersion is maintained through the injection n process, and a series of pressures required. The binary solvent manager uses two individual serial flow pumps to deliver a parallel binary gradient. There are built-in solvent select valves to choose from up to four solvents. There is a 15,000-psi pressure limit (about 1000 bar) to take full advantage of the sub 2-μm particles.
Transducers facilitate self monitoring and diagnostics. It uses needle- in needle sampling for improved ruggedness and needle calibration sensor increases accuracy. Injection cycle time is 25 seconds without a wash and 60 sec with a dual wash used to further decrease carry over. A variety of micro titer plate formats (deep well, mid height, or vials) can also be accommodated in a thermostatically controlled environment. Using the optional sample organiser, the sample manager can inject from upto 22 micro titer plates. The sample manager also controls the column heater. Column temperature up to 650C can be attained. To minimise sample dispersion, a “pivot out “design allows the column outlet to be placed in closer proximity to the source inlet of an MS detector
D.UPLC Columns:
The design and development of sub-2μm particles is a significant challenge, and researchers have been very active in this area to capitalize on their advantages. Although high efficiency nonporous 1.5μm particles are commercially available, they suffer from low surface area, leading to poor loading capacity and retention. To maintain retention and capacity similar to HPLC, UPLC must use a novel porous particle that can withstand high pressures. Silica based particles have good mechanical strength, but suffer from a number of disadvantages. These include tailing of basic analytes and a limited pH range. Another alternative, polymeric columns, can overcome pH limitations, but they have their own issues, including low efficiencies and limited capacities.
In 2000, Waters introduced a first generation hybrid chemistry, called XTerra which combines the advantageous properties of both silica and polymeric columns – they are mechanically strong, with high efficiency, and operate over an extended pH range. XTerra columns are produces using a classical sol-gel synthesis that incorporates carbon in the form of methyl groups. However, in order to provide the kind of enhance mechanical stability UPLC requires, a second generation hybrid technology27,was developed, called ACQUITY UPLC.ACQUITY 1.7μm particles bridge the methyl groups in the silica matrix as shown in fig2, which enhances their mechanical stability.
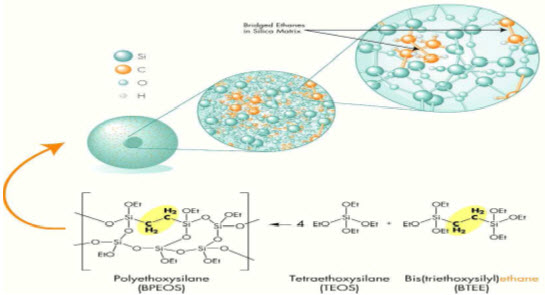
Figure 2. Synthesis and Chemistry of ACQUITY 1.7μm particles for UPLC
Resolution is increased in a 1.7 μm particle packed column because efficiency is better. Separation of the components of a sample requires a bonded phase that provides both retention and selectivity. Four bonded phases are available for UPLC separations.
* ACQUITY UPLC BEH T M C18 and C8(straight chain alkyl columns)
* ACQUITY UPLC BEH Shield RP 18 (embedded polar group column)
* ACQUITY UPLC BEH Phenyl (phenyl group tethered to the silyl functionality with a C6 alkyl)
* ACQUITY UPLC BEH Amide columns(trifunctionally bonded amide phase)
Each column chemistry provides a different combination and hydrophobicity, silanol activity, hydrolytic stability and chemical interaction with analytes.
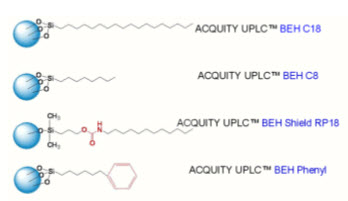
Figure.3 UPLC BEH COLUMN CHEMISTRIES ACQUITY
ACQUITY UPLC BEH T M C18 and C18 Columns – These areconsidered as the universal columnsof choice for most UPLC separationsby providing the widest pH range.They incorporate trifunctional ligandbonding chemistries which producesuperior low pH stability. This lowpH stability is combined with thehigh pH stability of the 1.7μm BEHparticle to deliver the widest usable pH operating range.
ACQUITY UPLC BEH Shield R18 Columns – These are designed toprovide selectivities that complementthe ACQUITY UPLC BEH T M C18and C8 Columns.
ACQUITY UPLC BEH Phenyl Columns – These utilize atrifunctional C6 alkyl ethyl betweenthe phenyl ring and the silylfunctionality.
ACQUITY UPLC BEH Amide columns-BEH particle technology,in combination with a trifunctionaly bonded amide phase, provides exceptional column life time, thus improving assay robustness. BEH Amide columns facilitate the use of a wide range of phase pH [2 –11] to facilitate the exceptional retention of polar analytes spanning a wide range in polarity, structural moiety and Pka.
Ligand combined with the same proprietary end capping processes as the ACQUITY UPLC BEH T M C18 and C8 columns provides long column lifetimes and excellent peak shape. This unique combination creates a new dimension in selectivity allowing a quick match to the existing HPLC column. Packing a 1.7μm particle in reproducible and rugged columns was also a challenge that needed to be overcome. The column hardware required a smoother interior surface and the end frits were re-designed to retain the small particles and resist clogging. Packed bed uniformity is also critical, especially if shorter columns are to maintain resolution while accomplishing the goal of faster separations. All ACQUITY columns also include the eCord microchip technology that captures the manufacturing information for each column, including the quality control tests and certificates of analysis. When used in the Waters ACQUITY UPLC system, the eCord database can also be updated with real time method information, such as the number of injections, or pressure information, to maintain a complete column history. An internal dimension (ID) of 2.1 mm column is used. For maximum resolution, choose a 100 mm length and for faster analysis, and higher sample throughput, choose 50 mm Column. Half-height peak widths of less than one second a with 1.7μm particles, which gives significant challenges for the detector. In order to integrate an analyte peak accurately and reproducibly, the detector sampling rate must be high enough to capture enough data points across the peak. The detector cell must have minimal dispersion (volume) to preserve separation efficiency. Conceptually, the sensitivity increase for UPLC detection should be 2-3 times higher than HPLC separations, depending on the detection technique.MS detection is significantly enhanced by UPLC; increased peak concentrations with reduced chromatographic dispersion at lower flow rates promotes increased source ionization efficiencies.
E.DETECTORS:
For UPLC detection, the tunable UV/Visible detector is used which includes new electronics and firmware to support Ethernet communications at the high data rates. Conventional absorbance-based optical detectors are concentration sensitive detectors, and for UPLC use, the flow cell volume would have to be reduced in standard UV/Visible detectors to maintain concentration and signal. According to Beer’s Law, smaller volume conventional flow cells would also reduce the path length upon which the signal strength depends. A reduction in cross-section means the light path is reduced, and transmission drops with increasing noise. Therefore, if a conventional HPLC flow cell were used, UPLC sensitivity would be compromised. The ACQUITY Tunable UV/Visible detector cell consists of a light guided flow cell equivalent to an optical fibre. Light is efficiently transferred down the flow cell in an internal reflectance mode that still maintains a 10mm flow cell path length with a volume of only 500nL. Tubing and connections in the system are efficiently routed to maintain low dispersion and to take advantage of leak detectors that interact with the software to alert the user to potential problems.
ACQUITY UPLC ELS Detector
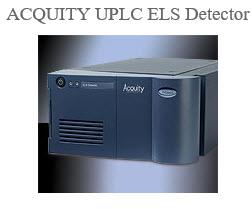
The ACQUITY UPLC® Evaporative Light Scattering (ELS) Detector is designed specifically for optimal UPLC®/ELS performance in a small footprint.
When your analytes have poor to no UV/Vis response, or don’t ionize well by mass spectrometry, the ACQUITY UPLC ELS Detector with the ACQUITY UPLC System lets you analyze more molecules (including sugars, triglycerides, phospholipids, antibiotics, and natural products) in a single analytical run.
Engineered for high volume or open access environments – anywhere large numbers of compounds are screened rapidly – the detector offers a convenient stackable design, easy maintenance, and long lamp lifetimes.
Features:
- Works with other detection techniques for a more comprehensive UPLC(/MS) analysis, for confidence that you’ve detected all of the components in your sample
- Provides reproducible, reliable results with precise control over nebulization and desolvation processes for the measurement of temperature-sensitive molecules
- Ensures the benefits of UPLC performance across the entire flow rate range with high data capture rates
- One nebulizer for the entire flow rate range provides simplified set-up and the benefit of maximized performance.
- Pre-aligned snap-in lamp is easy to change and provides maximum up-time.
ACQUITY UPLC FLR Detector
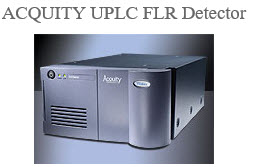
The ACQUITY UPLC® Fluorescence (FLR) Detector delivers sensitivity and selectivity to fluorescence-based applications. It extends the benefits of UPLC technology for the analysis of polynuclear aromatic hydrocarbons (PAHs), drugs of abuse, and vitamins – any component with chemiluminescent properties, such as fluorescence or phosphorescence. Transfer your HPLC fluorescence methods to UltraPerformance LC® for greater throughput without compromising sensitivity.
Features:
- Effective integration algorithms, sampling rates up to 80 Hz, and independent optimization of filtering constants facilitate accurate and reproducible integration
- Flexible 2D and 3D scanning capabilities for the quick determination of wavelength maxima
- Intuitive software interface and diagnostic tools instill confidence that the detector is performing optimally
- Low volume (<2uL), axially illuminated flow cell design allows for better light absorption, resulting in enhanced sensitivity
- Advanced optical design to maximize light throughput, and reduce light scatter, allowing for better signal-to-noise performance
- High-speed data rates (up to 80Hz) and independent optimization of filter time constants allowing full characterization of narrow, sharp peaks typical of UPLC separations
- Multiple detection modes - 2D, 3D, and on-the-fly spectral scanning – can greatly reduce the time needed to develop fluorescence detection methods by quickly determining wavelength maxima
- Intuitive system console provides simple navigation to manage instrument parameters for easy system control
ACQUITY UPLC PDA Detector
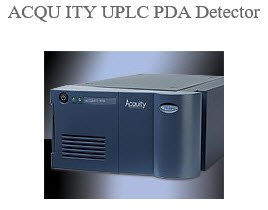
The ACQUITY UPLC® Photodiode Array (PDA) Detector allows your laboratory to detect and quantify lower concentrations of sample analytes and compare spectra across wavelengths and broad concentration ranges. It has data rates of up to 80 Hz, noise specifications of ±3 µAU, and an extended linear range.
With the PDA detector, you can fulfill multiple UPLC®/MS detection strategy requirements for the identification of components that are difficult to resolve by conventional HPLC-based methods.
Features:
- Quantitates trace impurities at levels to 0.004% with low signal-to-noise ratios, high optical and digital resolution, and library matching
- Achieves UPLC/PDA separations with flexible parameter control and sampling rates for accurate, reproducible integration
- Offers efficient light transmission for maximum sensitivity
- Provides simultaneous 2D and 3D operation in either Empower™ or MassLynx™ Software
- Wavelengths of 190 to 500 nm and up to 2.0 AU without compromising linearity
- 1.3% deviation at 2.0 AU
- 5.0% deviation at 2.8 AU
ACQUITY UPLC TUV Detector
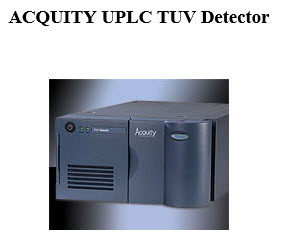
The ACQUITY UPLC® Tunable UV (TUV) Detector is a tunable, dual wavelength ultraviolet/visible (UV/Vis) detector that offers optimal linearity, resolution and sensitivity for UPLC®/UV separations. It features uniquely designed, patented light-guiding flow cell technology, low-noise performance (6 µAU), and support for data rates up to 80 Hz.
Discover the performance benefits of the ACQUITY UPLC TUV Detector for both routine and complex analyses in pharmaceutical, life science, environmental, agricultural, energy and petrochemical applications.
Features:
- Maximum signal-to-noise response enabled by light-guiding flow cell technology, which eliminates internal absorption, for minimal bandspreading and maintained concentration
- High sensitivity for low-level detection for simultaneous quantitation of major and minor components
- Intuitive set-up, monitoring, and diagnostics with a customizable instrument console for both Empower™ and MassLynx™ Software
- Independent optimization of data rate and filter time constants for the accurate integrations of narrow, sharp peaks typically characterized by UltraPerformance LC
ACQUITY SQD
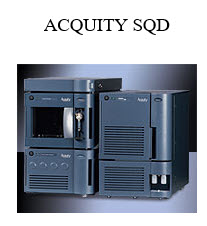
The ACQUITY® SQD combines the resolution, sensitivity, and speed of UltraPerformance® technology with single quadrupole MS detection. Designed specifically for chromatographers performing UPLC®/MS analysis, it offers a simple yet powerful solution for multi-tasking, fast-paced laboratory environments – with robust and reliable performance, and walk-up operation for any expertise level.
The ACQUITY UPLC® System’s ability to produce narrow peaks and spectral quality from the ACQUITY SQD allows easy identification of compounds in applications, including:
- Peak purity and impurity profiling
- Syntheses confirmation
- Product deformulation
- Enhanced method development with molecular weight-based peak tracking
Features:
- Interactive diagnostics software for worry-free system and fluidics optimization and performance checks with IntelliStart™ Technology
- 1 pg sensitivity with either ESI or APCI
- 10,000 Da/sec scan speeds up to 2,000 Da for full compatibility with seconds-wide UPLC peaks
- Simple upkeep and minimal bench space requirement
- Dual orthogonal sampling ionization with ZSpray™ source
- Rapid polarity switching and multi-mode ionization with simultaneous APCI and ESI for comprehensive compound analyses in a single injection, with ESCi® Technology
- Multiple detection strategies available with supported Tunable UV (TUV), Photodiode Array (PDA), and Evaporative Light Scattering (ELS) optical detectors
- Control and data acquisition with Empower™ or MassLynx™ Software
- Optional APPI(Atmospheric Pressure PhotoIonization)
- Optional application managers available
UPLC CHROMATOGRAPHIC CONDITIONS:
Columns: ACQUITY UPLC BEM C18, BEH Shield RP18, BEH C8 OR BEH
Phenyl Column Dimensions: 2.1X50mm 1.7μm
Mobile Phase A1: 20mM NH4COOH in H2O, pH 3.0
Mobile Phase A2: 20mM NH4HCOO3 in H2O, pH 10.0
Mobile Phase B1: Acetonitrile
Mobile Phase B2: Methanol
Flow rate: 0.5ml/min
Injection Volume: 10.0μl
Week needle wash: 3% methanol
Strong needle wash: 90% acetonitrile
Temperature: 30ºC
Detection: UV @ 254 nm
Sampling rate: 20pts/sec
Time constant: 0.1
Instrument: ACQUITY UPLC TM with 2996 ACQUITY PDA Detector.
METHOD DEVELOPMENT FASTER WITH UPLC (Time Saving)
|
|
UPLC GRADIENT CONDITIONS |
EQUIVALENT HPLE GRADIENT CONDITIONS |
||||||
|
Column conditions |
2.1x50mm |
4.6x150mm |
||||||
|
Particle size |
1.7 μm |
5 μm |
||||||
|
Flow rate |
0.5 ml/min |
1.0ml/min |
||||||
|
Gradient |
Time(min) |
Profile |
curve |
Time(min) |
Profile |
curve |
||
|
%A |
%B |
%A |
%B |
|||||
|
0.0 |
95 |
5 |
6 |
0.0 |
95 |
5 |
6 |
|
|
5.0 |
10 |
90 |
6 |
35.0 |
10 |
90 |
6 |
|
|
PEAK CAPACITY |
150 |
150 |
||||||
P = 1+ tg/w
UPLC screening method is 7X faster than directly scaled HPLC method
ADVANTAGES:
- Decreases run time and increases sensitivity.
- Provides the selectivity, sensitivity, and dynamic range of LC analysis
- Maintaining resolution performance.
- Expands scope of Multi residue Methods
- UPLC’s fast resolving power quickly quantifies related and unrelated compounds
- Faster analysis through the use of a novel separation material of very fine particle size
- Operation cost is reduced
- Less solvent consumption
- Reduces process cycle times, so that more product can be produced with existing resources
- Increases sample throughput and enables manufacturers to produce more material that consistently meet or exceeds the product specifications,potentially eliminating variability, failed batches, or the need to re-work material.
- Delivers real-time analysis in step with manufacturing processes.
- Assures end-product quality, including final release testing.
DISADVANTAGES:
- Due to increased pressure requires more maintenance and reduces the life of the columns of this type. So far performance similar or even higher has been demonstrated by using stationary phases of size around 2 μm without the adverse effects of high pressure.
- In addition, the phases of less than 2 μm are generally non-regenerable and thus have limited use.
USE OF THE UPLC SYSTEM:
Elevated-temperature chromatography also allows for high flow rates by lowering the viscosity of the mobile phase, which significantly reduces the column back pressure. Monolithic columns contain a polymerized porous support structure that provide lower flow resistances than conventional particle-packed columns.
APPLICATIONS OF UPLC:
Analysis of aminoacids
UPLC used for accurate, reliable and reproducible analysis of aminoacids in the area of protein characterisation, cell culture monitoring and nutritional analysis of foods.
Analysis of natural products and traditional herbal medicine
UPLC is widely used for analysis of natural products and herbal medicines. For traditional herbal medicines, also known as natural products or traditional Chinese medicines, analytical laboratories need to expand their understanding of their pharmacology to provide evidence-based validation of their effectiveness as medicines and to establish safety parameters for their production. The main purpose of this is to analyze drug samples arise from the complexity of the matrix and variability from sample to sample. Purification and qualitative and quantitative chromatography and mass spectrometry are being applied to determine active drug candidates and to characterize the efficacy of their candidate remedies. UPLC provides high-quality separations and detection capabilities to identify active compounds in highly complex samples that results from natural products and traditional herbal medicines.
Metabonomics-based analysis, using UPLC, exact mass MS, and Marker Lynx Software data processing for multivariate statistical analysis, can help quickly and accurately characterize these medicines and also their effect on human metabolism.
Preparative-scale fractionation and purification is used along with classic quantitative bio analytical tools used in drug development.
Identification of metabolite
Biotransformation of new chemical entities (NCE) is necessary for drug discovery. When a compound reaches the development stage, metabolite identification becomes a regulated process. It is of the utmost importance for lab to successfully detect and identify all circulating metabolites of a candidate drug. Discovery studies are generally carried out in vitro to identify major metabolites so that metabolic weak spots on the drug candidate molecule can be recognized and protected by changing the compound structure. Key for analysts in metabolite identification is maintaining high sample throughput and providing results to medicinal chemists as soon as they are available. UPLC/MS/MS addresses the complex analytical requirements of biomarker discovery by offering unmatched sensitivity, resolution, dynamic range, and mass accuracy.
Study of metabonomics/metabolomics
Metabonomics studies are carried out in labs to accelerate the development of new medicines. The ability to compare and contrast large sample groups provides insight into the biochemical changes that occur when a biological system is exposed to a new chemical entity (NCE). Metabonomics provides a rapid and robust method for detecting these changes, improves understanding of potential toxicity, and allows monitoring the efficacy. The correct implementation of metabonomic and metabolomic information helps similar discovery, development, and manufacturing processes in the biotechnology and chemical industry companies. With these studies, scientists are better able to visualize and identify fundamental differences in sample sets. The UPLC/MS System combines the benefits of UPLC analyses, high resolution exact mass MS, and specialized application managers to rapidly generate and interpret information-rich data, allowing rapid and informed decisions to be made.
ADME Screening
Pharmacokinetics studies include studies of ADME (Absorption, Distribution, Metabolism and Excretion). ADME studies measure physical and biochemical properties – absorption, distribution, metabolism, elimination, and toxicity of drugs where such compounds exhibit activity against the target disease. A significant number of candidate medicines fall out of the development process due to toxicity. If toxic reactions or any side effect occurs in the discovery/development process, then it becomes more costly. It is difficult to evaluate candidate drugs for possible toxicity, drug-drug interactions, inhibition, and/or induction of metabolizing enzymes in the body. Failure to properly identify these potential toxic events can cause a compound to be withdrawn from the market. The high resolution of UPLC enables accurate detection and integration of peaks in complex matrices and extra sensitivity allows peak detection for samples generated by lower concentration incubations and sample pooling. These are important for automated generic methods as they reduce failed sample analyses and save time. UPLC/MS/MS provides following advantages:-
- UPLC can more than double throughput with no loss in method robustness.
- UPLC is also simpler and more robust than the staggered separations sometimes applied with HPLC methods
- Tandem quadrupole MS provides sensitivity and selectivity for samples in matrix using multiple reaction monitoring (MRM) for detection and automated compound optimization.
- UPLC/MS/MS operating with rapid, generic gradients has been shown to increase analytical throughput and sensitivity in high throughput pharmacokinetics or bioanalysis studies, including the rapid measurement of potential p450 inhibition, induction, and drug-drug interactions. As well, since this UPLC-based approach can help labs pre- emptively determine candidate toxicity and drug-drug interactions, it enables organizations to be more confident in the viability of candidate medicines that do progress to late-stage clinical trials.
- Tandem quadrupole MS combines with UPLC in ADME screening for sensitivity and selectivity with fast analyses of samples in matrix to be achieved with minimal cleanup, using MRM (multiple reaction monitoring) for detection and automated compound optimization.
Bioanalysis/Bioequivalence studies
For pharmacokinetic, toxicity, and bioequivalence studies, quantitation of a drug in biological samples is an important part of development programs. The drugs are generally of low molecular weight and are tested during both preclinical and clinical studies. Several biological matrices are used for quantitative bioanalysis, the most common being blood, plasma, and urine. The primary technique for quantitative bioanalysis is LC/MS/MS. The sensitivity and selectivity of UPLC/MS/MS at low detection levels generates accurate and reliable data that can be used for a variety of different purposes, including statistical pharmacokinetics (PK) analysis.
Developing a robust and compliant LC/MS/MS assay has traditionally been the domain of very experienced analysts. UPLC/MS/MS helps in the processes of method development for bioanalysis into logical steps for MS, LC, and sample preparation. Quantitative bioanalysis is also an integral part of bioequivalence studies, which are used to determine if new formulations of existing drugs allow the compound to reach the bloodstream at a similar rate and exposure level as the original formulation. UPLC/MS/MS solutions are proven to increase efficiency, productivity, and profitability for bioequivalence laboratories.
Applications of UPLC/MS/MS in bioequivalence and bioanalysis are:-
- In UPLC/MS/MS, LC and MS instruments and software combine in a sophisticated and integrated system for bioanalysis and bioequivalence studies, providing unprecedented performance and compliance support.
- UPLC/MS/MS delivers excellent chromatographic resolution and sensitivity
- MS delivers simultaneous full-scan MS and multiple reaction monitoring (MRM) MS data with high sensitivity to address matrix monitoring
- UPLC Sample Organizer maximizes efficiency by accommodating large numbers of samples in a temperature-controlled environment, ensuring maximum throughput
- Increase the sensitivity of analyses, quality of data including lower limits of quantitation (LLOQ), and productivity of laboratory by coupling the UPLC System's efficient separations with fast acquisition rates of tandem quadrupole MS systems
- Easily acquire, quantify and report full system data in a compliant environment using a security-based data collection software
- Ensure the highest quality results and reliable system operation in regulated environment.
Dissolution Testing
For quality control and release in drug manufacturing, dissolution testing is essential in the formulation, development and production process. In sustained-release dosage formulations, testing higher potency drugs is particularly important where dissolution can be the rate-limiting step in medicine delivery. The dissolution profile is used to demonstrate reliability and batch-to-batch uniformity of the active ingredient. Additionally, newer and more potent formulations require increased analytical sensitivity. UPLC provides precise and reliable automated online sample acquisition. It automate dissolution testing, from pill drop to test start, through data acquisition and analysis of sample aliquots, to the management of test result publication and distribution.
Forced Degradation Studies
One of the most important factor that impacts the quality and safety of pharmaceuticals is chemical stability. The FDA and ICH require stability testing data to understand how the quality of an API (active pharmaceutical ingredient) or a drug product changes with time under the influence of environmental factors such as heat, light, pressure and moisture or humidity. Knowledge of these stability characteristics defines storage conditions and shelf life, the selection of proper formulations and protective packaging, and is required for regulatory documentation. Forced degradation, or stress testing, is carried out under even harsher conditions than those used for accelerated stability testing. Generally performed early in the drug development process, laboratories cause the potential drug to degrade under a variety of conditions like peroxide oxidation, acid and base hydrolysis, photo stability, and temperature to understand resulting by products and pathways that are necessary to develop stability indicating methods.
The most common analytical technique for monitoring forced degradation experiments is HPLC with UV and/or MS detection for peak purity, mass balance, and identification of degradation products but these HPLC-based methodologies are time-consuming and provide only medium resolution to ensure that all of the degradation products are accurately detected.
PDA/MS (photodiode array and MS), allows for faster and higher peak capacity separations, for complex degradation product profiles also. Combining the chromatographic speed, resolution, and sensitivity of UPLC separations with the high-speed scan rates of UPLC-specific photodiode array and MS detection will give confidence for identifying degradation products and thus shortening the time required to develop stability-indicating methods.
Manufacturing / QA / QC
Identity, purity, quality, safety and efficacy are the important factors to be considered while manufacturing a drug product .The successful production of quality pharmaceutical products requires that raw materials meet purity specifications. That manufacturing processes proceed as designed. That final pharmaceutical products meet, and hopefully exceed, defined release specifications. Continued monitoring of material stability is also a component of quality assurance and control.
UPLC is used for the highly regulated, quantitative analyses performed in QA/QC laboratories. The supply of consistent, high quality consumable products plays an important role in a registered analytical method. The need for consistency over the lifetime of a drug product which could be in excess of 30 years is essential in order to avoid method revalidation and associated production delays.
Method Development / Validation
According to FDA, validation is defined as an establishing documented evidence that provides a high degree of assurance that a specific process will consistently produce a product meeting its predetermined specifications and quality attributes .Method development and validation is a time-consuming and complicated process: labs need to evaluate multiple combinations of mobile phase, pH, temperature, column chemistries, and gradient profiles to arrive at a robust, reliable separation for every activity.
UPLC help in critical laboratory function by increasing efficiency, reducing costs, and improving opportunities for business success. UPLC column chemistries can easily translate across analytical- and preparative-scale separation tasks.
UPLC provide efficiencies in method development: Using UPLC, analysis times becomes as short as one minute, methods can be optimized in just one or two hours, significantly reducing the time required to develop and validate
With UPLC, separation speed and efficiency allows for the rapid development of methodologies
The following parts of UPLC are important to give the required information:-
- UPLC columns: High stability allows for a wide range of column temperatures and pHs to be explored
- UPLC Column Manager: Easily evaluate column temperatures from 10 °C below room temperature to 90 °C; enables to use HPLC methods on the UPLC before scaling to UPLC
- UPLC Calculator: Put information at fingertips about how to transition existing chromatographic analyses to faster UPLC methods
Impurity Profiling
For the drug development and formulation process, profiling, detecting, and quantifying drug substances and their impurities in raw materials and final product testing is an essential part. Impurity profiling requires high-resolution chromatography capable of reliably and reproducibly separating and detecting all of the known impurities of the active compound.
Also critical is the ability to accurately measure low-level impurities at the same time as the higher concentration active pharmaceutical component. This activity, however, can be complicated by the presence of excipients in the sample, often resulting in long HPLC analysis times to achieve sufficient resolution.
- UPLC System and Columns specifically address high-throughput analysis requirements while maintaining high peak resolution.
- UPLC PDA Detector involves two analytical flow cells are available for maximum flexibility according to application requirements, one for maximum chromatographic resolution and a second for high sensitivity.
- UPLC also involves the latest peak detection algorithms and custom calculations to optimize data processing and reporting. It also confidently detect impurities in compounds even at trace levels.
- To characterize impurities, it is often necessary to perform several analytical runs to obtain the necessary MS and MS/MS data.
UPLC combines with exact mass LC/MS, which by operating with alternating low- and high-collision energies, known as MS, has been successfully employed for the identification of drug and endogenous metabolites. The rapid switching of the collision cell energy produces both precursor and product ions of all of the analytes in the sample while maintaining a sufficient number of data points across the peak for reliable quantification.
The sensitivity and flexibility of exact mass time-of-flight mass spectrometry with alternating collision cell energies, combined with the high resolving power of the UPLC system, allows for the rapid profiling and identification of impurities.
Compound library maintenance
Confirming the identity and purity of a candidate pharmaceutical is critical to effectively screening chemical libraries that contain vast types of small molecules across a range of biological targets. Chemists need to be sure they have synthesized the expected compound. In this high-throughput screening environment, the ability to obtain information in multiple MS and UV detection modes in a single injection is invaluable.
LC/MS analysis helps excludes false positives and maintain high product quality, but can be time-consuming in moving a drug through the discovery process. Achieving high sample throughput is key to moving compounds from hit to lead status.
Combining fast analysis with open-access software delivers the power of LC/MS to chemists who are not analytical instrumentation specialists. A single complete system enables them thoroughly screen a compound, from sample introduction to end results. It allows them to quickly and easily know what they’ve made, and allows the experts to work on the difficult analytical problems.
The use of the fast-scanning MS along with the throughput of the UPLC System’s remote status monitoring software allows chemists to obtain high-quality comprehensive data about their compounds in the shortest possible timeframes. This, combined with intelligent open access software, allows to make informed decisions faster, and better support the needs of the modern drug discovery process.
Open acess
Maximum efficiency is essential for analytical laboratories that are constantly challenged to increase throughput and deliver results to research chemists in pharmaceutical discovery. UPLC and UPLC/MS systems and software enable versatile and open operation for medicinal chemistry labs, with easy-to-use instruments, a user-friendly software interface, and fast, robust analyses using UV or MS for nominal and exact mass measurements.
System management is just as simple. Online, the central administrator can remotely define system users and their privileges for operating instruments across the network.
UPLC CHROMATOGRAMS:

UPLC separation of eight diuretics.
Column: 2.1 by 30 mm 1.7 μm ACQUITY UPLC C at 35°C.
A 9-45% B linear gradient over 0.8 minutes, at a flow rate of 0.86 mL/min was used.
Mobile phase A was 0.1% formic acid, B was acetonitrile. UV detection at 273nm.
Peaks are in order: acetazolamide, hydrochlorothiazide, impurity, hydroflumethiazide, clopamide, Trichlormethiazide, ,indapamide, bendroflumethiazide, and spironolactone, 0.1mg/ml of each in water.

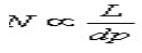
Isocratic separation of 1-methylxanthene, 1,3 dimethyluric acid, theobromine, 1,7dimethyl xanthenes (all 25 μg/ml) while maintaining a constant L/dp ratio. Peaks are listed in order of elution.
- 5, 3.5 and 2.5μm columns: Waters Xbridge C18
- 1.7μm column: AQUITY UPLC BEH C18
- All columns were 2.1mm I.D.
- The isocratic mobile phase was 95% H2O, 5%ACN and 0.1% formic acid
- The separation was performed at 380C; UV @ 280nm.
COMPARISION OF UPLC AND HPLC:
|
CHARACTERISTICS |
HPLC ASSAY |
UPLC ASSAY |
|
Column |
150x3.2mm |
150x2.1 mm |
|
Particle size |
3 to 5 μm |
Less than 2 μm |
|
Flow rate |
3.0 ml/min |
0.6 ml/min |
|
Needle wash |
methanol |
methanol |
|
Injection volume |
5 μL (Std in 100% methanol) |
2 μL (Std in 100% methanol) |
|
Column temperature |
300c |
650c |
|
Total run time |
10 min |
1.5 min |
|
Maximum back pressure |
35-40 MPa |
103.5 MPa |
|
Plate count |
2000 |
7500 |
|
USP Resolution |
3.2 |
3.4 |
|
Delay volume |
750 μl |
110 μl |
|
Gradient(time in min) ACN:H2O |
T0 (25:75), T6.5 (25:75), T7.5 (95:5), T9(25:75), T10 (25:75) |
T0 (36:64), T1.1 (95:5), T1.3 (36:64) |
|
Total solvent composition (including 0.5 min delay time in between injections) |
Acetonitrile:10.5 ml, water:21.0ml |
Acetonitrile:0.5ml, water:0.66ml |
|
Analytical column |
Alltima C18 |
Acquity UPLC BEH C18 |
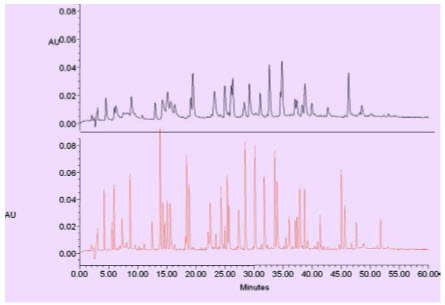
FIG: HPLC VS UPLC peak capacity. In this gradient peptide map separation, the HPLC (top) separation (on a 5μm Col-18μmn) yields 70 peaks, or a peak capacity of 143, while the UPLC separation (bottom) run under identical conditions yields 168 peaks, or a peak capacity of 360, a 2.5 x increase.
CONCLUSION:
UPLC increases productivity in both chemistry and instrumentation by providing more information per unit of work as it gives increased resolution, speed, and sensitivity for liquid chromatography. When many scientists experience separation barriers with conventional HPLC, UPLC extends andexpands the utility of chromatography. The main advantage is a reduction of analysis time, which also meant reduced solvent consumption. The time spent optimizing new methods can also be greatly reduced. The time needed for column equilibration while using gradient elution and during method validation is much shorter. Sensitivity can be compared by studying the peak width at half height. It was found that the sensitivity of UPLC was much higher than that of conventional HPLC. Tailing factors and resolution were similar for both techniques. Peak area repeatability (as RSD) and peak retention time repeatability (RSD) were also similar for both techniques.
A negative aspect of UPLC could be the higher backpressure than in conventional HPLC.
This backpressure can be reduced by increasing the column temperature. Overall,it seems that UPLC can offer significant improvements in speed, sensitivity and resolution compared with conventional HPLC.
REFERENCES:
1] Zhang Y.H., Gong X. Y., Zhan H.M., Larock R.C., and Yeung E.S., 2000. J. Comb. Chem.2., 450-452.
[2] Zhou C., Jin Y., Kenseth J.R., Stella M., Wehmeyer K. R. and Heineman W R., 2005 J.Pharmac.Sc.,94, 576-589.
[3] Van Deemter JJ, Zuiderweg EJ, Klinkenberg A.1956. Longitudinal diffusion and resistance to mass transfer as causes of non ideality in chromatography. Chem. Eng.Sci.,5, 271-289.
[4] Zhu J., Goodall D.M., and Wren S.A.C., 2005.LCGC., 23(1), 54-72.
5] Greibrokk T. and Andersen T., 2003.J.Chromatogr., A 1000, 743-755.
[6] Gerber F., Krummen M., Potgeter H., Roth A., Siffrin C., and Spoendlin C., 2004. J. Chromatogr., A 1036, 127 133.
[7] Tanaka N., Kobayashi H., Nakanishi K., Minakuchi H., and Ishizuka N.,2001. Anl. Chem., 73,420A-429A.
[8] Wu N., Dempsey J., Yehl P.M., Dovletoglu A., Ellison A., and Wyvratt J., 2004. Anal.Chim Acta., 523, 149-156.
[9] Jerkovich A.D., Mellors J.S., and Jorgenson J.W., 2003.LCGC 21(7), 660-611.
[10] Wu N., Lippert J.A., Lee M.L., 2001.J. Chromatogr., 911(1).
[11] Unger K.K., Kumar D., Grun M,m Buchel G., Ludtke S., Adam Th., 2000. J. Chromatogr.,A 892(47).
[12] Swartz M.E and Murohy B.,2004. Lab Plus Int., 18(6)
[13] Swartz M.E and Murohy B.,2004.Pharm. Formulation Quality., 6(5), p.40.
[14] .Skoog DA, Holler FJ, Nieman TA.,1998.An introduction to chromatographic separations. Principals of instrumental analysis. 5th ed. Florida., pno. 674-697.
[15] Swartz ME.,2004.Ultra performance liquid chromatography: Tomorrow’s HPLC technology today. LabPlus Int., 18(3), 6-9.
[16] MacNair J.E., Patel K.D and Jorgenson J.W., 1999.Anal.Chem.,71,700-708.
[17] Wu N, Lippert JA, and Lee ML.2001. J. Chromotogr., A911, 1-12.
[18] www.acdlabs.com/products/chrom_lab
[19] www.rheodyne.com/chromatography/ drylab
[20] www.iristechnologies.net/ ChromSword / ChromSwordAuto.htm
[21] Swartz M. E., 2005.Ultra performance Liquid Chromatography: An Introduction, separation science Re-defined, LCGC Supplement., P -12.
[22] Lars Y. and Honore H.S.,2003. J.Chromatogr., A 1020, 59-67.
[23] McLoughlin D.A., Olah T.V., Gilbert J.D.,1997. J.Pharm. Biomed. Anl., 15,1893-1901,
[24] Lippert J.A., Xin B., Wu N and Lee M.L., 1997. J. Microcolumn., sep.11631-643.
[25] Jerkovich A.D., Mellors J.S., and Jorgenson J.W., 2003. LCGC 21(7)., 21:7.
[26] Wu N., Lippert J.A., Lee M.L., 2001.J. Chromatogr., 911(8).
[27] Wyndham KD., et al 2003.Anal. chem; 75 ,6781-6788.
[28] Swartz M. E., 2005.Ultra performance Liquid Chromatography: An Introduction,separation science Re-defined, LCGC Supplement,. P -11.
[29] Swartz M. E., 2005.Ultra performance Liquid Chromatography: An Introduction, separation science Re-defined, LCGC Supplement. P -13.
[30] Swartz M., 2005.LCGC 23(1),46-53.
[31] Broske A.D., et al., 2004. Agilent Technologies application note ,5988-9251EN