 About Authors
Narsinh N. Potdar*, Pranita P. Kore, Rishikesh V. Antre
Department of Pharmaceutical Chemistry,
JSPM’s Charak College of Pharmacy and Research, Wagholi,
Pune-Nagar Road, Pune-412 207 (India)
*narsinh_potdar@rediffmail.com
Abstract
Three new simple, economic spectrophotometric methods were developed for quantitative estimation of Rosuvastatin Calcium in bulk formulation. First method includes determination of Rosuvastatin Calcium at absorption maxima 252 nm, second method applied was area under curve for analysis of Rosuvastatin Calcium in the wavelength range of 247-257 nm and third method was first order derivative. Beer law obeyed in the concentration range of 5-35 μg/ml for all three methods. The correlation coefficients were found to be 0.974, 0.982 and 0.982by absorption maxima, area under curve and first order derivative spectra. Results of analysis were validated statistically and by performing recovery studies. The mean percent recoveries were found satisfactory for all three methods. The percentage label claim was found in the range of 100.28% to 101.01% .The proposed method was validated statistically and recovery studies.
[adsense:336x280:8701650588]
Reference Id: PHARMATUTOR-ART-1963
INTRODUCTION:
Rosuvastatin calcium is Nucleoside Reverse Transcriptase Inhibitor (NRTIs), anti-retroviral drug. Chemically it is 1-(6-aminopurin-9-yl) propan-2-yloxymethylphosphoric acid1,2. Extensive literature review reveals that several spectrophotometric, UV3,4,5,6,7,8, HPLC6,9,10,11,12 and HPTLC13,14 methods have been reported so far for determination of Rosuvastatin Calcium alone and its combination with other drugs. Therefore, it was thought worthwhile to develop simple, accurate and reliable spectrophotometric method for estimation of Rosuvastatin Calcium in bulk and in tablet dosage form using methanol as a solvent. All the chemicals used were of analytical grade. Spectral and absorbance measurement were made on Shimadzu Double beam UV-Visible spectrophotometer 1800 with 10 mm matched quartz cells.
EXPERIMENTAL
Shimadzu UV-1800 double beam spectrophotometer with 1 cm path length supported by Shimadzu UV-Probe software, version 2.35 was used for all spectrophotometric estimations.
Shimadzu balance (BL-220H) was used for all weighing. Rosuvastatin Calcium was obtained from Emcure Pharmaceutical Industry, Bhosari, Pune for providing the pure drug samples of rosuvastatin calcium.
Standard stock solution
Solution containing 100 μg/ml of pure drug was prepared by dissolving 10 mg of Rosuvastatin calcium in sufficient methanol to produce 100 ml solution in volumetric flask. From this aliquot solution was pipetted out and diluted with methanol to obtained working standard stock solution of 100 μg/ml.
Analysis of the tablet formulation
Six tablets were accurately weighed and powdered. A portion of tablet powder equivalent to 100 mg of rosuvastatin calcium was accurately weighed and transferred into a 100 ml volumetric flask and to this 25 ml of methanol added. The solution was sonicated for 20 min and filtered through Whatman filter paper 41. The final volume was made up to 100 ml with methanolto obtained concentration of 1 mg/ml rosuvastatin calcium. It was further diluted for the analysis, to obtained concentration in the range of 5-35 μg/ml. The results of the analysis of tablet formulation were found to be 100.48±0.29,101.38±0.015 and 101.05±0.02 for absorption maxima, area under curve method and first order derivative spectra respectively.
[adsense:468x15:2204050025]
RECOVERY
A recovery study was carried out by addition of known amount of standard drug in the preanalysed tablet formulation, in 80%, 100% and 120% of label claim. At each level of amount three determinations were performed.
RESULTS AND DISCUSSION
Absorption maxima method
For selection of analytical wavelength 10 μg/ml solution of rosuvastatin calcium was prepared by appropriate dilution of standard stock solution and scanned in the spectrum mode from 400-200 nm. From the spectra λmax of rosuvastatin calcium 252 nm was selected for the analysis (Figure 1 and Figure 2).The calibration curve was prepared in the concentration range of 5-35 μg/ml at 252 nm. By using calibration curve, the concentration of the sample solution was determined.

Figure 1. Zero order UV-spectrum of Rosuvastatin Calcium
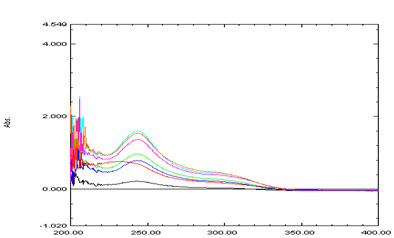
Figure 2. Overlain Spectra of Rosuvastatin Calcium
NOW YOU CAN ALSO PUBLISH YOUR ARTICLE ONLINE.
SUBMIT YOUR ARTICLE/PROJECT AT articles@pharmatutor.org
Subscribe to Pharmatutor Alerts by Email
FIND OUT MORE ARTICLES AT OUR DATABASE
Area under curve method
For selection of analytical wavelength, 10 μg/ml solution of rosuvastatin calcium was prepared by appropriate dilution of standard stock solution and scanned in the spectrum mode from 400-200 nm. From the spectra of drug, area under the curve in the range of 247-257 nm was selected for the analysis (Figure 3). The calibration curve was prepared in the concentration range of 5-35 μg/ml at their respective AUC range. By using calibration curve, the concentration of the sample solution can be determined.
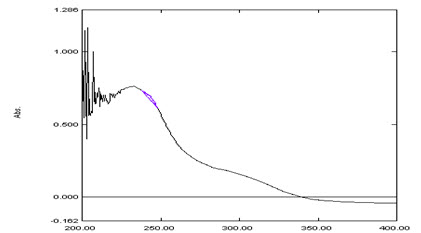
Figure 3. Zero order UV-spectrum of area under curve method for Rosuvastatin Calcium
First order derivative spectroscopic method
In this method, 10 μg/ml solution of rosuvastatin calcium was prepared by appropriate dilution of standard stock solution and scanned in the spectrum mode from 400-200 nm. The absorption spectra obtained was derivatized to first order derivative spectra. The first order derivative spectra show maxima and minima at 238 nm and 205 nm respectively (Figure 4). The absorption difference is calculated which was directly proportional to the concentration of the standard solution. The calibration curve for rosuvastatin calcium was plotted in the concentration range of 5-35 μg/ml and scanned in the Second order derivative spectra. The calibration curve of d2A/dλ2 against concentration of drug showed linearity.

Figure 4. Firstorder derivative Overlain Spectra of Rosuvastatin Calcium
METHOD VALIDATION
Linearity
From standard stock solution of 100 μg/ml of rosuvastatin calcium 0.5, 1.0, 1.5, 2.0, 2.5, 3.0 & 3.5 ml were transferred into series of 10 ml volumetric flasks to obtain concentration range of 5 to 35 μg/ml for rosuvastatin calcium (Table 1).
Table 1. Statistical parameters of linearity of rosuvastatin calcium
|
Parameters
|
Absorption Maxima |
Area Under Curve |
First Order Derivative Spectroscopy |
|
Beer’s law range |
5-35 μg/ml |
5-35 μg/ml |
5-35 μg/ml |
|
Coefficient of Correlation (r2) |
0.974 |
0.982 |
0.982 |
|
Slope(m) |
0.046 |
0.022 |
0.001 |
|
Intercept(c) |
0.091 |
0.006 |
0.002 |
Y=mx+c
Accuracy and precision
Precision of the method was evaluated by using tablet powder equivalent to 100% of the label claim of rosuvastatin calcium. Method repeatability was obtained from R.S.D. value by repeating assay of four replicates of single concentration three times in a same day. Intermediate precision was assessed by assay of four replicates of single concentration of rosuvastatin calcium on three consecutive days. The accuracy of the methods was assessed by recovery studies at three different levels, 80%, 100% and 120%. The values of standard deviation and recovery studies were found satisfactory (Table 2).
Table 2. Results of analysis of rosuvastatin calcium in tablet formulation and recovery studies
|
Method
|
Label Claim mg/tab |
% Label claim*
|
% Recovery* |
S.D. |
% RSD |
SEM
|
|
Absorption Maxima |
10 mg
|
100.48 |
99.80 |
±0.2949 |
0.2939 |
0.1296 |
|
Area Under Curve |
10 mg
|
101.38 |
100.50 |
±0.0150 |
0.0147 |
0.0067 |
|
First Order Derivative |
10 mg
|
101.05 |
102.92 |
±0.0200 |
0.0197 |
0.0089 |
*denotes n=4 CRESTOR-10 (Astra Zeneka Pharma Limited, Bangalore)
Limit of detection and limit of quantisation
The detection limit and quantisation limit was computed for lower limit of detection and minimum quantity of analyte measured and was found to be satisfactory by proposed spectrophotometric methods.
CONCLUSION
The developed new three methods proved to be simple in procedure and it produced more accurate results. Hence all three methods effective for the routine analysis of rosuvastatin calcium in bulk and tablet dosage form.
ACKNOWLEDGMENTS
The authors are thankful to Prof. T. J. Sawant founder secretary, and Dr. K. G. Baheti, Principal, JSPM’s Charak College of Pharmacy and Research, Wagholi, Pune for providing necessary facilities and constant support for research work. The authors gratefully acknowledge Emcure Pharmaceuticals, Pune for sample of Rosuvastatin calcium.
REFERENCES
1. Indian Pharmacopoeia, 6th edition, Government of India Ministry of Health and family welfare, published by the Indian pharmacopoeia commission, Gaziabad, volume III, 2010, 2071.
2. Sweetman SC, Martindale -The complete drug Reference, 36th edn. Pharmaceutical press, London, 2009, 1389.
3. Gupta A, Mishra P, Shah K, Simple UV Spectrophotometric Determination of Rosuvastatin Calcium in Pure Form and in Pharmaceutical Formulations, E-Journal of Chemistry, 6(1), 2009, 89-92.
4. Sevda RR, Ravetkar AS, Shirote PJ, UV Spectrophotometric estimation of Rosuvastatin Calcium and Fenofibrate in bulk Drug and Dosage Form using Simultaneous Equation Method, International Journal of ChemTech Research, 3(2), 2011, 629-635.
5. Afroz A, Haque T, Talukder MU, Ashraful Islam SM, Spectrophotometric Estimation of Rosuvastatin Calcium and Glimepiride in Tablet Dosage Form, Asian journal Pharmaceutical Ananlysis, 1(4), 2011, 74-78.
6. Karunakaran A, Subhash V, Chinthala R, Muthuvijayan J, Simultaneous Estimation of Rosuvastatin Calcium and Fenofibrate in Bulk and in Tablet Dosage Form by UV-Spectrophotometry and RP-HPLC, Stamford Journal of Pharmaceutical Science, 4(1), 2011, 58-63.
7. Mandwal PS, Patel PR, Agarwal KM, Surana SJ, Q-Absorbance and Multicomponent UV - Spectrophotometric Methods for Simultaneous Estimation of Rosuvastatin calcium and Fenofibrate in Pharmaceutical Formulation, Der Pharmacia Lettre, 4 (4), 2012, 1054-1059.
8. Uyar B, Celebier M, Altinoz S, Spectrophotometric determination of rosuvastatin calcium in tablets, Pharmazie, 62(6), 2007, 411-413.
9. Kaila HO, Ambasana MA, Thakkar RS, Saravaia HT, Shah AK, A new improved RP-HPLC method for assay of rosuvastatin calcium in tablets, Indian Journal of Pharmaceutical Science, 72(5), 2010, 592–598.
10. Donthula S, Kumar MK, Teja GS, Kumar YK, Yasodha JK, Ramesh D, A new validated RP-HPLC method for determination of Rosuvastatin calcium in bulk and pharmaceutical dosage form, Der Pharmacia Lettre, 3(3), 2011, 350-356.
11. Tajane D, Raurale AM, Bharande PD, Mali AN, Gadkari AV, Bhosale VR, Development and validation of a RP-HPLC-PDA method for simultaneous determination of Rosuvastatin calcium and Amlodipine besylate in pharmaceutical dosage form, Journal of Chemical and Pharmaceutical Research, 4(5), 2012, 2789-2794.
12. Godavariya VD, Prajapati PB, Marolia BP, Shah SA, Development and validation of a RP-HPLC method for simultaneous estimation of Rosuvastatin calcium and Aspirin in marketed formulation, International Research Journal of Pharmacy, 3(8), 2012, 173-175.
13. Devi SU, Latha EP, Guptha CVN, Ramalingam P, Development And Validation of HPTLC Method For Estimation of Rosuvastatin Calcium In Bulk And Pharmaceutical Dosage Forms, International Journal of Pharma and Bio Sciences, 2(2), 2011, 134-140.
14. Sharma MC, Sharmaa S, Kohlib DV, Sharma AD, A validated HPTLC method for determination of simultaneous estimation Rosuvastatin Calcium and Ezetimibe in pharmaceutical solid dosage form, Archives of Applied Science Research, 2(1), 2010, 1-7.
NOW YOU CAN ALSO PUBLISH YOUR ARTICLE ONLINE.
SUBMIT YOUR ARTICLE/PROJECT AT articles@pharmatutor.org
Subscribe to Pharmatutor Alerts by Email
FIND OUT MORE ARTICLES AT OUR DATABASE