 ABOUT AUTHORS:
Rinku B Patel*1, Paresh U Patel2, Bharat G Patel3, Anil C Patel2
1Department of Pharmaceutical Analysis, Centre For Health Science Studies, Ganpat University, Ganpat Vidyanagar – 384012, Mehsana, Gujarat, India.
2Department of Quality Assurance, Centre For Health Science Studies, Ganpat University, Ganpat Vidyanagar – 384012, Mehsana, Gujarat, India.
3Aspee college of Home Science and Nutrition, S.D.Agricultural University, S.K.Nagar-385506, Banaskantha, Gujarat, India.
*rinkupatel5890@gmail.com
ABSTRACT
Simple, accurate, precise, and sensitive ratio spectra derivative spectrophotometric method for simultaneous estimation of Eperisone hydrochloride (EPE) and Diclofenac sodium(DIC) in synthetic mixture have been developed and validated. The ratio derivative spectroscopic method involves measurement of first derivative amplitude of ratio spectra at 247 nm for EPE and 218.4 nm for DIC as two wavelengths for estimation. Beer's law is obeyed in the concentration range of 2-18 μg/ml for both EPE and DIC. LOD values for EPE and DIC are found to be 0.0634 μg/ml and 0.5386 μg/ml, respectively. LOQ values for EPE and DIC are found to be 0.1921 μg/ml and 1.6321 μg/ml, respectively. The method was validated statistically and recovery studies were carried out. It was found to be accurate, precise and reproducible. The method was applied to the assay of the drugs in synthetic mixture, which were found in the range of 98.0% to 102.0% of the labeled value for both Eperisone hydrochloride and Diclofenac sodium. Hence, the method herein described can be successfully applied in quality control of synthetic mixture.
[adsense:336x280:8701650588]
REFERENCE ID: PHARMATUTOR-ART-1730
INTRODUCTION
Eperisone hydrochloride (EPE)is a well known antispasmodic drug[1]. Chemicallyit is 4-ethyl-2- methyl-3-piperidinopropiophenone hydrochloride (Figure 1). It is official in Japanese Pharmacopoeia (JP)[2]. JP describes potentiometric titration method for its estimation. Literature survey reveals liquid chromatography-ESI-tandem mass spectrometry for determination of eperisone in human plasma[3]. Literature survey also reveals Liquid Chromatography–Electrospray Ionization-Mass Spectrometry method for the determination of Eperisone in Human Plasma[4].
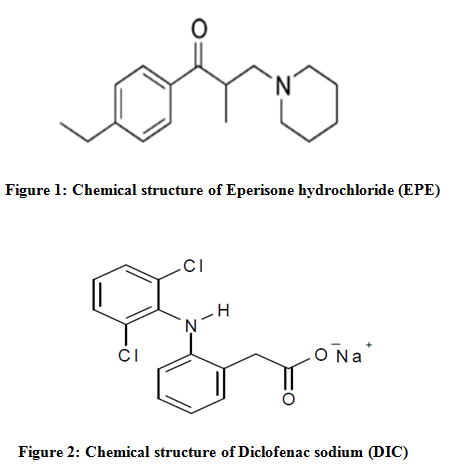
Diclofenac sodium(DIC)1 is chemically 2-[2,6dichloroanilino] phenyl acetic acid sodium salt (Figure 2). Diclofenac sodium (DIC) is official in Indian Pharmacopoeia (IP)[5], British Pharmacopoeia (BP)[6], United states Pharmacopoeia (USP)[7], European Pharmacopoeia (EP)[8]. IP describes UV, Potentiometric titration and High Performance Liquid Chromatography (HPLC) method for its estimation. BP and USP describe UV & HPLC method for its estimation. EP describes Potentiometric titration method for its estimation. Literature survey reveals HPLC[9-10], UV[11-13], HPTLC[14-15], GC[16] and Capillary electrophoresis[17] method for determination of DIC alone. Literature survey also reveals HPLC[18-22], HPTLC[23-25], UV[26-30], Capillary electrophoresis[31], and AAS[32] method for the determination of DIC with other drugs combination. The combination of these two drugs is not official in any pharmacopoeia; hence no official method is available for the simultaneous estimation of EPE and DIC in their combined synthetic mixture or dosage forms. Literature survey reveal only simultaneous equation method[33] for EPE and DIC in synthetic mixture is available. The present communication describes simple, sensitive, rapid, accurate, precise and cost effective spectrophotometric method based on first order derivative for simultaneous estimation of both drugs in synthetic mixture.
MATERIALS AND METHODS
Apparatus
A Shimadzu model 1700 (Japan) double beam UV/Visible spectrophotometer with spectral width of 2 nm, wavelength accuracy of 0.5 nm and a pair of 10 mm matched quartz cell was used to measure absorbance of all the solutions. Spectra were automatically obtained by UV-Probe system software. A Sartorius CP224S analytical balance (Gottingen, Germany), an ultrasonic bath (Frontline FS 4, Mumbai, India) was used in the study.
Reagents and materials
DIC bulk powder was kindly gifted by Acme Pharmaceuticals Ltd. Mehsana, Gujarat, India. EPEbulk powder was kindly gifted by Sun Pharmaceuticals Ltd. Vadodara, Gujarat, India. Methanol (AR Grade, S. D. Fine Chemicals Ltd., Mumbai, India) and Whatman filter paper no. 41 (Millipore, USA) were used in the study.
Preparation of standard stock solutions
An accurately weighed standard EPE and DIC powder (10 mg) were weighed and transferred to 100 ml separate volumetric flasks and dissolved in methanol. The flasks were shaken and volumes were made up to mark with methanol to give a solution containing 100 μg/ml of each EPE and DIC.
[adsense:468x15:2204050025]
RATIO SPECTRA DERIVATIVE METHOD
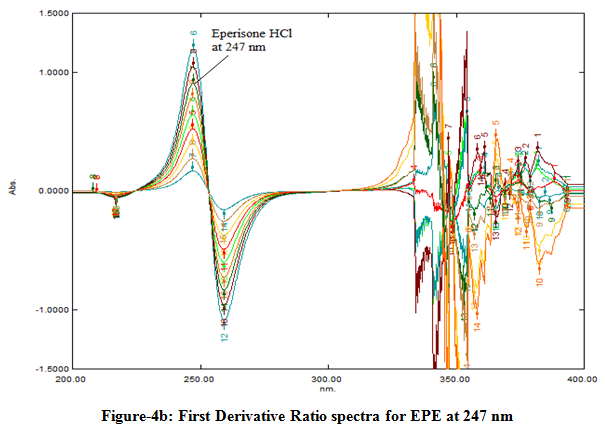
This method works on two mechanisms viz. (1) Ratio and (2) Derivatization. In this method, the mixture spectra are divided with the divisor and first derivative spectra of these ratio spectra are generated. The main advantage of the ratio-spectra derivative spectrophotometry is the chance of doing easy measurements in correspondence of peaks so it permits the use of the wavelength of highest value of analytical signals (a maximum or a minimum). Moreover, the presence of a lot of maxima and minima is another advantage by the fact that these wavelengths give an opportunity for the determination of active compounds in the presence of other compounds and excipients which possibly interferes the assay. For the determination of EPE, the spectra of EPE at increasing concentrations in methanol were divided by previously stored absorption spectrum standard solution of DIC (12 µg/ml) to obtain the corresponding ratio spectra. Then the first derivative of the obtained ratio spectra were traced with interval of Δλ=8 nm. In the binary mixtures, content of EPE was determined by measuring the first derivative amplitude at 247 nm, where there is no contribution or interference from DIC.
On the other hand, for the determination of DIC, an analogous procedure was followed. The spectra of DIC at increasing concentrations were divided by previously stored spectrum of 12 µg/ml solution of EPE and the first derivative of the developed ratio spectra were traced with Δλ=8 nm. In the binary mixtures, content DIC was determined by measuring the first derivative amplitude at 218.4 nm, where there is no contribution or interference from EPE.
First-derivative technique (D1) traced with Δλ=8 nm was used to resolve the spectral overlapping. The calibration curves were checked for linearity and linear behavior was observed in the concentration range of 2-18 µg/ml, for each of the drugs.
VALIDATION OF THE PROPOSED METHOD
The proposed method was validated according to the International Conference on Harmonization (ICH) guidelines [34].
Ratio spectra Derivative Spectrophotometry Method
The absorption spectra of EPE prepared at increasing concentrations in Methanol were recorded in the spectral region of 200-400 nm and divided by the previously stored spectrum of 12 µg/ml DIC in the same solvent and their ratio spectra were obtained as seen in the Fig-4a. Then, the first derivatives of ratio-spectra were recorded as shown in Fig. 4b and the values of the derivatives were measured at suitably selected wavelength for the determination of EPE. The concentration of divisor can be modified, and different calibration graphs are then obtained. A concentration of 12 µg/ml of DIC was considered as suitable. The calibration graph was established by measuring at the amplitude at 247 nm corresponding to a maximum wavelength.
For determining DIC, an analogous procedure was followed. The ratio spectra were obtained by dividing the spectra of DIC with previously stored spectrum of a 12 µg/ml EPE solution as shown in figure-5a and their first derivatives were calculated which is shown in figure-5b. The values of the derivatives were measured at suitably selected wavelength for the determination of DIC. A concentration of 12 µg/ml of EPE was considered as suitable. The calibration graph was established by measuring at the amplitude at 218.4 nm corresponding to a maximum wavelength.
Linearity (Calibration curve)
Linearity of the proposed method was determined by analyzing the solution of EPE and DIC in the range of 2-18 µg/ml. The limit of detection (LOD) and the limit of quantification was then established by evaluating the minimum level at which drug solution can be readily quantified with accuracy.
Method precision (Repeatability)
The precision of the instrument was checked by repeated scanning and measurement of absorbance of solutions (n = 6) for EPE and DIC (12 µg/ml for both drugs) without changing the parameter of the proposed spectrophotometry method.
Intermediate precision (Reproducibility)
The intraday and interday precision of the proposed method was determined by analyzing the corresponding responses 3 times on the same day and on 3 different days over a period of 1 week for 3 different concentrations of standard solutions of EPE and DIC (6, 10, 14 µg/ml for EPE and 6, 10, 14 µg/ml for DIC). The result was reported in terms of relative standard deviation (% RSD).
Accuracy (Recovery study)
The accuracy of the method was determined by calculating recovery of EPE and DIC by the standard addition method. Known amounts of standard solutions of EPE and DIC were added at 50, 100 and 150 % level to prequantified sample solutions of EPE and DIC (6 µg/ml for EPE and DIC). The amounts of EPEand DICwere estimated by applying obtained values to the respective regression line equations. The experiment was repeated for three times.
Limit of detection and Limit of quantification
The limit of detection (LOD) and the limit of quantification (LOQ) of the drug were derived by calculating the signal-to-noise ratio (S/N, i.e., 3.3 for LOD and 10 for LOQ) using the following equations designated by International Conference on Harmonization (ICH) guidelines34.
LOD = 3.3 × σ/S
LOQ = 10 × σ/S
Where, σ = the standard deviation of the response and S = slope of the calibration curve
Analysis of synthetic mixture
Eperisone hydrochloride (50 mg) and Diclofenac sodium (50 mg) standard drug powder were accurately weighed and then mixed with commonly used formulation excipients like starch, lactose, magnesium stearate and talc. The mixture was then transferred to 100 ml volumetric flask containing 50 ml methanol and sonicated for 20 min. The solution was filtered through Whatman filter paper No. 41 and the volume was adjusted up to the mark with methanol. This solution (0.2 ml) was taken in to a 10 ml volumetric flask and the volume was adjusted up to mark with methanol to get a final concentration of EPE (10 µg/ml) and DIC (10 µg/ml) and were recorded at selected wavelengths for determination of EPE and DIC. The analysis procedure was repeated six times.
NOW YOU CAN ALSO PUBLISH YOUR ARTICLE ONLINE.
SUBMIT YOUR ARTICLE/PROJECT AT articles@pharmatutor.org
Subscribe to Pharmatutor Alerts by Email
FIND OUT MORE ARTICLES AT OUR DATABASE
RESULTS AND DISCUSSION
Zero-order absorption spectra of 10 µg/ml of each of EPE and DIC showed overlapping peaks that interfere with the simultaneous determination as shown in Figure-3. So it was thought of interest to develop the ratio spectra derivative spectrophotometry method for the simultaneous estimation of EPE and DIC in synthetic mixture. Methanol was used as the solvent. Since both the drugs exhibit good solubility in it and no interference due to excipients were observed. The proposed method was found to be simple, sensitive, rapid, accurate, precise and economic for the routine simultaneous estimation of two drugs. The linearity range for EPE and DIC were found to be 2-18 μg/ml for both drug. Regression analysis data and summary of all validation parameters is given in Table 1. Precision was calculated as repeatability (% RSD) and intraday and interday variation (% RSD) for both the drugs. Accuracy was determined by calculating the recovery and the mean was determined. The LOD and LOQ were found to be 0.0634 and 0.1921 μg/ml respectively for EPE and 0.5386 and 1.6321 μg/ml respectively for DIC indicates sensitivity of the proposed method. The method was successfully used to determine the amounts of EPE and DIC present in synthetic mixture. The results obtained are in good agreement with the corresponding labeled amount. By observing the validation parameters, the method was found to be sensitive, accurate and precise. Hence the method can be employed for the routine analysis of these drugs in combinations.
Table 1: Regression analysis data and summary of validation parameters for the proposed method
|
PARAMETERS |
EPE |
DIC |
|
|
Wavelength range (nm) |
247 |
218.4 |
|
|
Beer’s law limit (µg/ml) |
2 - 18 |
2 - 18 |
|
|
Regression equation (y = a + bc) Slope (b) Intercept (a) |
y = 0.0636x +0.0203 0.0636 0.0203 |
y = 0.0220x +0.0327 0.0220 0.0327 |
|
|
Correlation Coefficient (r2) |
0.9987 |
0.9989 |
|
|
Accuracy (Recovery) (n = 3) |
Level I |
99.42±0.99 |
100.76± 0.99 |
|
Level II |
100.67±0.35 |
100.06 ± 1.08 |
|
|
Level III |
98.70 ± 0.49 |
101.26 ± 0.81 |
|
|
Method precision (Repeatability) (% RSD, n = 6), |
0.5875 |
0.4917 |
|
|
Interday (n = 3) (% RSD) |
0.4458 – 1.0997 |
0.5604 – 1.0899 |
|
|
Intraday(n = 3) (% RSD) |
0.3190 –0.3750 |
0.3723 – 0.5883 |
|
|
LOD(µg/ml) |
0.0634 |
0.5386 |
|
|
LOQ (µg/ml) |
0.1921 |
1.6321 |
|
|
Assay ± S. D. (n = 6) |
100.83 ± 1.06 |
99.55 ± 1.43 |
|
RSD = Relative standard deviation. LOD = Limit of detection. LOQ = Limit of quantification. S. D. is standard deviation
Table 2: Recovery data of proposed method
|
Drug |
Level |
Amount taken (µg/ml) |
Amount added (%) |
% Mean recovery ± S.D. (n = 3) |
|
EPE |
I |
6 |
50 |
99.42 ± 0.99 |
|
II |
6 |
100 |
100.67 ± 0.35 |
|
|
III |
6 |
150 |
98.70 ± 0.49 |
|
|
DIC |
I |
6 |
50 |
100.76 ± 0.99 |
|
II |
6 |
100 |
100.06 ± 1.08 |
|
|
III |
6 |
150 |
101.26 ± 0.81 |
S. D. is Standard deviation and n is number of replicate
Table 3: Analysis of EPE and DIC in synthetic mixture
|
Tablet
|
Label claim (mg) |
Amount found (mg) |
% Label claim ± S. D. (n = 6) |
|||
|
EPE |
DIC |
EPE |
DIC |
EPE |
DIC |
|
|
I |
50 |
50 |
50.41 |
49.78 |
100.83± 1.06 |
99.55 ± 1.43 |


CONCLUSION
The proposed spectrophotometric method was found to be simple, sensitive, accurate and precise for determination of EPE and DIC in mixture. The method utilizes easily available and cheap solvent for analysis of EPE and DIC hence the method was also economic for estimation of EPE and DIC from mixture. The common excipients and additives are usually present in the mixture do not interfere in the analysis of EPE and DIC in method, hence it can be conveniently adopted for routine quality control analysis of the drugs in mixture.
ACKNOWLEDGEMENT
The authors are thankful to Acme Pharmaceutical Ltd., Ahmedabad, India for providing gift sample of DIC and Sun Pharmaceuticals Ltd. Vadodara, Gujarat, India for providing gift sample of EPE for carry out the research work.
REFERENCES:
1) Maryadele. J. O’ Neil. The Merck Index: An Encyclopedia of chemicals, drugs and biologicals, 14th edition. New Jersey: Published by Merck Research Laboratories, Division of Merck and Co., Inc. Whitehouse station; 2006, 610, 542.
2) The Japanese Pharmacopoeia, society of Japanese Pharmacopoeia, 15th edition ,Shibuya Tokyo Japan, 2006, 618.
3) Jeoung M, Jeong E, Kim N, Kim C, Chung Y, Lee Y, Ahn S, Cho H, Lee Y, Hong J, Moon D. Determination of eperisone in human plasma by Liquid chromatography-ESI-tandem mass spectrometry. Arch Pharm Res 2007;30(9):1174-1178.
4) Ding L, Wei X, Zhang S, Sheng J, and Zhang Y. Rapid and Sensitive Liquid Chromatography–Electrospray Ionization-Mass Spectrometry Method for the Determination of Eperisone in Human Plasma. J Chromatographic Scien 2004;42(5):254-258.
5) Indian Pharmacopoeia, Vol. II, Controller of Publication, Govt. of India, Ministry of Health and Family Welfare, New Delhi, 2010, 1199-1201.
6) British Pharmacopoeia, Vol. I, London, The British Pharmacopoeia Commission; 2010: 672-673.
7) The United State Pharmacopoeia. USP32-NF25. Rockville MD: United State Pharmacopoeial Convention, Inc; 2009, 2124 – 2126.
8) European pharmacopoeia 6th edition, vol II, council of europe stabourg, 1686-1687.
9) Sayed Y, Abdel M, Suleiman M, Najib N. A rapid, and sensitive high-performance liquid chromatographic method has been developed for the determination of diclofenac sodium in serum. J Pharma Pharmacol 1988;40(10):727-729.
10) Thosar A, Mayee R, Rawat S, Atre K, Mane P. Development and Validation of HPLC Method for Determination of Diclofenac Sodium by Tape Stripping Method. Asian J Pharma Bio Resea 2011;1(3):317-322.
11) Mandava V, Rao B, Reddy B, Rao S, Prasanthi V. Estimations of Diclofenac Sodium pellets (extended release) in commercial dosage forms using a simple & convenient spectrophotometric method. Rasayan Jounal 2009;2(1):488-490.
12) Khaskheli A, Sirajuddin A, Sherazi S, Afridi H, Mahesar S, Saeed M. Simpler and Faster Spectrophotometric Determination of Diclofenac Sodium in Tablets, Serum and Urine Samples. Pak J Anal. Environ. Chem 2009;10(3):53-58.
13) Agrawal Y, Shivramchandra K. Spectrophotometric determination of diclofenac sodium in tablets. J Pharmace Biomed Anal 1991;9(2):97-100.
14) Thongchai W, Liawruangrath B, Thongpoon C, Machan T. A high performance thin layer chromatographic method for the determination of diclofenac sodium in pharmaceutical formulations. Chiang Mai J. Sci 2006;33(1):123-128.
15) Lala L, D’mello P, Naik S. HPTLC determination of diclofenac sodium in serum, J Pharmace and Biomed Anal 2002;29(2):539-544.
16) Yilmaz B. GC-MS determination of Diclofenac in Human plasma. Chromatographia 2010;71(2):549-551.
17) Lachmann B, Kratzel M, Cristian R. Rapid Determination of Diclofenac in Pharmaceutical Formulation by Capillary Zone Electrophoresis. Scientia Pharmaceutica 2012;80(1):311-316.
18) Dhaneshwar S, Bhusari V. Validated HPLC Method for Simultaneous Quantitation of Diclofenac Sodium and Misoprostol in Bulk Drug and Formulation. Pelagia Research Library Der Chemica Sinica 2010;1(2):110-118.
19) Gowramma B, Rajan S, Muralidharan S, Meyyanathan S, Suresh B. Validated HPLC method for Simultaneous Estimation of Paracetamol and Diclofenac in Pharmaceutical formulation. International J ChemTech Research 2010;2(1):676-680.
20) Deshmukh H, Chanda S, Prabhu P. Simultaneous HPLC Determination of Methocarbamol, Paracetamol and Diclofenac Sodium. E-Journal of Chemistry 2011;8(4):1620-1625.
21) Mithun C, Chaudhury D, Basu A, Das D, Susanto C. Simultaneous Determination of Paracetamol, Chlorzoxazone and Diclofenac Sodium in Tablet Dosage Form by HPLC. International J Resea Article Pharma Innovation 2012;2(2):34-44.
22) Kev N, Vijyasrinivas S, Kirankumar M, Mathivanan N, Kumar S, Rao M. Simultaneous Reverse Phase HPLC estimation of Nimesulide and Diclofenac sodium. Indian J Pharma Scien 2003;2(1):407-409.
23) Dhaneshwar S, Bhusari V. Validated HPTLC Method for Simultaneous Estimation of Diclofenac Sodium and Misoprostol in Bulk Drug and Formulation. Asian J Phar Biol Res. 2011;1(1):15-21.
24) Gandhi S, Deshpande P, Sengar M. High Performance Thin Layer Chromatographic Determination of Diclofenac Sodium and Thiocolchicoside in Fixed Dose combination. International Resea J Pharma 2010;1(1):220-224.
25) Pawar S, Kale A, Amrutkar M, Jagade J, Pore N, Bhosale A. HPTLC estimation of Paracetamol, Diclofenac Sodium and Chlorzoxazone in Tablet dosage form. Asian J Resea Chemist 2009;2(3):306-309.
26) Sengar M, Gandhi S, Patil U, Rajmane V. Simultaneous determination of Diclofenac sodium and Thiocolchicoside in fixed dose combination by spectrophotometry. Asian J Pharma Clinical Resea 2010;3(2):89-91.
27) Kumar S, SahniV, Chawla P, Mamman K, Saraf S.A. Development and Validation of Analytical Method for Simultaneous Estimation of Diclofenac sodium and Ofloxacin in Bulk and Ophthalmic Formulations using UV-visible Spectrometry. International J Pharma Scien nanotech. 2011;4(2):1399-1402.
28) Rawat S, Gupta A. Spectrophotometric Method for Simultaneous Estimation of Nimesulide and Diclofenac Sodium in Pharmaceutical Dosage Forms. Asian J Pharma Anal 2011;1(4):85-87.
29) Patel S, Hariyani K. Spectrophotometric Estimation of Tolperisone Hydrochloride and Diclofenac Sodium In Synthetic Mixture by Q-Absorbance Ratio Method. Amer J Pharmtech Resea 2012;2(5):833-841.
30) Patel. S, Prajapati K. Spectrophotometric Method for Simultaneous Determination of Chlorzoxazone and Diclofenac Sodium in Synthetic Mixture. International Resea J Pharm 2012;3(9):293-296.
31) Solangi A, Memon S, Mallah A, Memon N, Khuhawar M, Muhammad I. Development and Implication of a Capillary Electrophoresis Methodology for Ciprofloxacin, Paracetamol and Diclofenac Sodium in pharmaceutical formulations and Simultaneously in Human Urine Samples. Pak J Pharm Scien 2011;24(4):539-544.
32) Jawla S, Jain S. Atomic Absorption Spectrometric Method for Estimation of Diclofenac sodium and Mefenamic acid in Pharmaceutical Formulations. International J Pharma Scie Drug Resea 2010;2(1):45-47.
33) Patel P, Patel S, Patel. U. Spectrophotometric Method for Simultaneous Estimation of Eperisone Hydrochloride and Diclofenac Sodium in Synthetic Mixture. International Resea J Pharma 2012;3(9):203-206.
34) The International Conference on Harmonization, Q2 (R1), Validation of Analytical Procedure, Text and Methodology, 2005.
NOW YOU CAN ALSO PUBLISH YOUR ARTICLE ONLINE.
SUBMIT YOUR ARTICLE/PROJECT AT articles@pharmatutor.org
Subscribe to Pharmatutor Alerts by Email
FIND OUT MORE ARTICLES AT OUR DATABASE