 ABOUT AUTHORS:
G.Venkateswarlu*, M.Muthukumaran, B.krishnamoorthy, Ameren nishat
Montessori Siva Sivani Institute of Science & Technology College of Pharmacy-Mylavaram,
Vijayawada, Andhra pradesh-521230
*venkateswarlu460@gmail.com
ABSTRACT
The goal of this review is to provide a guide for understanding current MS technology. Mass spectrometry (MS) has progressed to become a powerful analytical tool for both quantitative and qualitative applications. Proteomics research, in particular, increasingly depends on MS technologies. Basically, any information gathered from a mass spectrometer comes from the analysis of gas-phase ions. There are three main components of a mass spectrometer: an ionization source, a mass analyzer and a detector the name ‘mass spectrometry’ is a misnomer of sorts. The mass is not what is measured; instead, mass spectrometry determines the mass-to-charge (m/z) ratio or a property related to m/z .A mass spectrum is a plot of ion abundance versus m/z, although in many cases the x-axis is labelled ‘mass’ rather than m/z. The spectrum is presented in terms of Daltons (Da) per unit charge The ability of mass spectrometry analyzing proteins and other biological extracts is due to the advances gained through the development of soft ionization techniques such as electrospray ionization (ESI) and matrix-assisted laser desorption ionization (MALDI) that can transform biomolecules into ions. Regardless of the ionization source, the sensitivity of a mass spectrometer is related to the mass analyzer where ion separation occurs.
[adsense:336x280:8701650588]
REFERENCE ID: PHARMATUTOR-ART-1712
INTRODUCTION
Mass spectrometry was first described by physicists in the late 1880s. WilhelmWien, for example, was the first to demonstrate in 1898 that superimposed electric and magnetic fields can deflect positive ions and his work was preceded by the work of physicist Eugen Goldstein, who in 1886 discovered a new kind of radiation, “Kanalstrahlen” and reached the conclusion that these “new” rays were merely positively charged particles. Mass Spectrometry is a powerful technique for identifying unknowns, studying molecular structure, and probing the fundamental principles of chemistry. Applications of mass spectrometry include identifying and quantitating pesticides in water samples, it identifying steroids in athletes, determining metals at PPQ (Parts Per Quadrillion) levels in water samples.Mass spectrometry is essentially a technique for "weighing" molecules. Obviously, this is not done with a conventional balance or scale. Instead, mass spectrometry is based upon the motion of a charged particle, called an ion, in an electric or magnetic field. The mass to charge ratio (m/z) of the ion affects this motion. Since the charge of an electron[1] is known, the mass to charge ratio a measurement of an ion's mass. Typical mass spectrometry research focuses on the formation of gas phase ions[2] the chemistry of ions, and applications of mass spectrometry.This review articles cover the basics of mass spectrometry instrumentation of a mass spectra.

Figure 1. Mass Spectrometer Block Diagram
THE MASS SPECTROMETER
In order to measure the characteristics of individual molecules, a mass spectrometer converts them to ions so that they can be moved about and manipulated by external electric and magnetic fields. The three essential functions of a mass spectrometer and the associated components.[3]
1. A small sample of compound is ionized, usually to cations by loss of an electron.
2. In the Ion Source the ions are sorted and separated according to their mass and charge. The Mass Analyzer
3. In the Mass Analyzer the separated ions are then detected and tallied, and the results are displayed on a chart the Detector.

Figure 2. Schematic diagram of a mass spectrometer
IONIZATION TECHNIQUES
A variety of ionization techniques are used for mass spectrometry[4] Most ionization techniques excite the neutral analyte molecule which then ejects an electron to form a radical cation (M+ other ionization techniques involve ion molecule reactions that produce adduct ions (M H+). The most important considerations are the physical state of the analyte and the ionization energy. Electron ionization and chemical ionization are only suitable for gas phase ionization. Fast atom bombardment, secondary ion mass spectrometry, electrospray, and matrix assisted laser desorption are used to ionize condensed phase samples.
[adsense:468x15:2204050025]
Electron Ionization
Electron Ionization (EI) is the most common ionization techniqueused for mass spectrometry. EI works well for many gas phase molecules, but it does have some limitations. Although the mass spectra are very reproducible and are widely used for spectral libraries, EI causes extensive fragmentation so that the molecular ion is not observed for many compounds. Fragmentation[5] is useful because it provides structural information for interpreting unknown spectra.
Chemical Ionization
Chemical Ionization (CI) is a “soft” ionization technique thatproduces ions with little excess energy. As a result, less fragmentation is observed in the mass spectrum. Since this increases the abundance of the molecular ion, the technique is complimentary to 70eV EI. CI is often used to verify the molecular mass of an unknown. Only slight modifications of an EI source region are required for CI experiments.
In Chemical Ionization the source is enclosed in a small cell with openings for the electron beam, the reagent gas and the sample. The reagent gas is added to this cell at approximately 10 Pa (0.1torr) pressure. This is higher than the 10-3 Pa (10-5torr) pressure typical for a mass spectrometer source. At 10-3 Pa the mean free path between collisions is approximately 2 meters and ion-molecule reactions are unlikely. In the CI source, however, the mean free path between collisions is only 10-4 meters and analyte molecules undergo many collisions with the reagent gas. The reagent gas in the CI source is ionized with an electron beam to produce a cloud of ions. The reagent gas ions in this cloud react and produce adduct ions like CH5+, which are excellent proton donors.
Fast Atom Bombardment and Secondary Ion Mass Spectrometry
Fast AtomBombardment (FAB) and Secondary Ion Mass Spectrometry (SIM S) both use high energy atoms to sputter and ionize the sample in a single step. In these techniques, a beam of rare gas neutrals (FAB) or ions (SIM S) is focused on the liquid or solid sample. The impact of this high energy beam causes the analyte molecules to sputter into the gas phase and ionize in a single step. The exact mechanism of this process is not well understood, but these techniques work well for compounds with molecular weights up to a few thousand Dalton.[6-12] Since no heating is required, sputtering techniques (especially FAB) are useful for studying thermally labile compounds that decompose in conventional inlets
Atmospheric Pressure Ionization and Electrospray Ionization
AtmosphericPressure Ionization (API) sources ionize the sample at atmospheric pressure and then transfer the ions into the mass spectrometer. These techniques[13] are used to ionize thermally labile samples such as peptides, proteins and polymers directly from the condensed phase. The sample is dissolved in an appropriate solvent and this solution is introduced into the mass spectrometer. With conventional inlets the solvent increases the pressure in the source region of the mass spectrometer.[14] In addition, Joule-Thompson cooling of the liquid as it enters the vacuum causes the solvent droplets to freeze. The frozen clusters trap analyte molecules and reduce the sensitivity of the experiment.
API sources introduce the sample through a series of differentially pumped stages. This maintains the large pressure difference between the ion source and the mass spectrometer without using extremely large vacuum pumps.[15] In addition a drying gas is used to break up the clusters that form as the solvent evaporates. Because the analyte molecules have more momentum than the solvent and air molecules, they travel through the pumping stages to the mass analyzer.
Electron Spray Ionization (ESI)
ESI is the most common API application. It has undergone remarkable growth in recent years and is frequently used for LC/M S of thermally labile and high molecular weight compounds. The electrospray is created by applying a large potential between the metal inlet needle and the first skimmer in an API source.[16] The mechanism for the ionization process is not well understood and there are several different theories that explain this ionization process. One theory is that as the liquid leaves the nozzle, the electric field induces a net charge on the small droplets. As the solvent evaporates, the droplet shrinks and the charge density at the surface of the droplet increases. The droplet finally reaches a point where the columbic repulsion from this electric charge is greater than the surface tension holding it together. This causes the droplet to explode and produce multiply charged analyte ions. A typical ESI spectrum shows a distribution of molecular ions with different charge numbers.
Matrix Assisted Laser Desorption/Ionization:
Matrix Assisted LaserDesorption/Ionization (MALDI) is used to analyze extremely large molecules. This technique directly ionizes and vaporizes the analyte from the condensed phase. MALDI is often used for the analysis of synthetic and natural polymers, proteins, and peptides. Analysis of compounds with molecular weights up to 200,000dalton is possible and this high mass limit is continually increasing. In MALDI, both desorption and ionization[17] is induced by a single laser pulse. The sample is prepared by mixing the analyte and a matrix compound chosen to absorb the laser wavelength. This is placed on a probe tip and dried. A vacuum lock is used to insert the probe into the source region of the mass spectrometer. A laser beam is then focused on this dried mixture and the energy from a laser pulse is absorbed by the matrix. This energy ejects analyte ions[18] from the surface so that a mass spectrum is acquired for each laser pulse. The mechanism for this process is not well understood and is the subject of much controversy in the literature.[19] This technique is more universal (works with more compounds) than other laser ionization techniques because the matrix absorbs the laser pulse. With other laser ionization techniques, the analyte must absorb at the laser wavelength. Typical MALDI spectra include the molecular ion; some multiply charged ions, and very few fragments.
NOW YOU CAN ALSO PUBLISH YOUR ARTICLE ONLINE.
SUBMIT YOUR ARTICLE/PROJECT AT articles@pharmatutor.org
Subscribe to Pharmatutor Alerts by Email
FIND OUT MORE ARTICLES AT OUR DATABASE
MASS ANALYZERS
After ions are formed in the source region they are accelerated into the mass analyzer by an electric field. The mass analyzer separates these ions according to their m/z value. The selection of a mass analyzer depends up on the resolution, [20] mass range, scan rate and detection limits required for an application. Each analyzer has very different operating characteristics and the selection of an instrument involves important tradeoffs. Analyzers are typically described as either continuous or pulsed. Continuous analyzers include quadrupole filters and magnetic sectors. These analyzers are similar to a filter or monochromator used for optical spectroscopy. They transmit a single selected m/z to the detector and the mass spectrum is obtained by scanning the analyzer so that different mass to charge ratio ions are detected. While a certain m/z is selected, any ions at other m/z ratios are lost, reducing the S/N for continuous analyzers. Single Ion Monitoring (SIM) enhances the S/N by setting the mass spectrometer at the m/z for an ion of interest. Since the instrument is not scanned the S/N improves, but any information about other ions is lost. Pulsed mass analyzers are the other major class of mass analyzer. These are less common but they have some distinct advantages.
Quadrupole
The quadrupole mass spectrometer is the most common mass analyzer. Its comp act size, fast scan rate, high transmission efficiency, and modest vacuum requirements are ideal for s mall inexpensive instruments. Most quadrupole[21] instruments are limited to unit m/z resolution and have a mass range of m/z 1000. Many bench top instruments have a mass range of m/z 500 but research instruments are available with mass range up to m/z 4000.

Figure 3.Quadrupole Mass Analyzer
Electric Sector/Double Focusing Mass Spectrometers
An electric sector consists of two concentric curved plates. A voltage is app lied across these plates to bend the ion beam as it travels through the analyzer.[22] The voltage is set so that the beam follows the curve of the analyzer. The radius of the ion trajectory (r) depends upon the kinetic energy of the ion (V) and the potential field (E) applied across the plates.
r=2V/E
Time-of-Flight
The time-of-flight (TOF) mass analyzer separates ions in time as they travel down a flight tube. This is a very simple mass spectrometer that uses fixed voltages and does not require a magnetic field. The greatest drawback is that TOF instruments have poor mass resolution, usually less than 500. These instruments have high transmission efficiency; no upper m/z limit, very low detection limits, and fast scan rates. For some applications these advantages outweigh the low resolution. Recent developments in pulsed ionization techniques and new instrument designs with improved resolution have renewed interest in TOF-MS.[23]
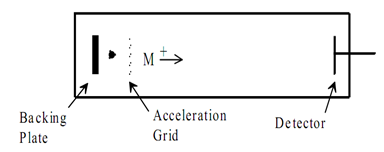
Figure 4:Time-of-Flight Mass Spectrometer.
Ion Cyclotron Resonance
The Ion Cyclotron Resonance (ICR) mass spectrometer uses a super conducting magnet to trap ions in a small sample cell. This type of mass analyzer has extremely high mass resolution (ca.10) and is also useful for tandem mass spectrometry experiments. These instruments are very expensive and are typically used for specialized research applications.[24-26] The ICR traps ions in a magnetic field that causes ions traveling a circular path. This is similar to the path of an ion in a magnetic sector, but the ions are not traveling as fast and the magnetic field is stronger. As a result the ions are contained in the small volume of the trap .The ions cyclotron frequency is the angular frequency of an ion's orbit. This frequency is determined by the magnetic field strength (B) and the m/z value of the ion.
DETECTORS
Detection of ions is based upon their charge or momentum. For large signals a faraday cup is used to collect ions and measure the current. Older instruments used photographic plates to measure the ion abundance at each mass to charge ratio. Most detectors currently used amplify the ion signal using a collector similar to a photomultiplier tube. This amplifying Molecular structure is important for understanding mass spectral inter pretation. To get the most from this section, draw out the structures of the molecules discussed. During the discussion find which bonds break and calculate the mass of the fragments. Actively reading this section will result in a much greater understanding of and appreciation for mass spectrometry. 24 detectors include: electron multipliers, channel electrons and multi channel plates. The gain is controlled by changing the high voltage applied to the detector. A detector is selected for its speed, dynamic range, gain, and geometry. Some detectors are sensitive enough to detect single ions.
VACUUM SYSTEM
All mass spectrometers operate at very low pressure (high vacuum). This reduces the chance of ions colliding with other molecules in the mass analyzer. Any collision can cause the ions to react, neutralize, scatter, or fragment. All these processes will interfere with the mass spectrum. To minimize collisions, experiments are conducted under high vacuum conditions, typically 10 to 10Pa (10 to 10torr) depending upon the geometry of the instrument This-2-5-4-7high vacuum requires two pumping stages. The first stage is a mechanical pump that provides rough vacuum down to 0.1 Pa (10torr). The second stage uses diffusion pumps turbo molecular pumps to provide high vacuum. ICR instruments have even higher vacuum requirements and often include a cryogenic pump for a third pumping stage. The pumping system is an important part of any mass spectrometer but a detailed discussion is beyond the scope of this paper.
DATA SYSTEM
The final component of a mass spectrometer is the data system. This p art of the instrument has undergone revolutionary changes in the past twenty years. It has evolved from photographic plates and strip chart recorders to data systems that control the instrument, acquire hundreds of spectra in a minute and search tens of thousands of reference spectra to identify an unknown. Because these systems are evolving so rapidly, a thorough discussion is not included in this paper. Interested readers should study the manuals for their instrument.
INTERPRETATION
Although mass spectrometry is a very sensitive instrumental technique, there are other techniques with picogram detection limits. In addition to sensitivity, however, mass spectrometry also is also useful for identifying the chemical structure of this picogram sample. Since the mass spectrum is a fingerprint of the molecular structure, comparison to a computer databases can be used to identify an unknown compound. This is often done using Probability Based Matching (PBM), a popular pattern recognition technique. Although these computer searches are convenient and powerful, it is important to understand how to interpret a mass spectrum. A computer only compares the unknown spectrum to the library spectra and offers a selection of compounds in the database that produce similar spectra. This computer search is very useful and it makes interpretation much easier, but there are limits to the computer search.
APPLICATIONS
Isotope ratio MS: isotope dating and tracking
Mass spectrometer to determine the 16O/18O and 12C/13C isotope ratio on biogenous carbonate. Mass spectrometry is also used to determine the isotopic composition of elements within a sample. Differences in mass among isotopes of an element are very small, and the less abundant isotopes of an element are typically very rare, so a very sensitive instrument is required. These instruments sometimes referred to as isotope ratio mass spectrometers (IR-MS).
Trace gas analysis
Several techniques use ions created in a dedicated ion source injected into a flow tube or a drift tube: selected ion flow tube (SIFT-MS), and proton transfer reaction (PTR-MS), are variants of chemical ionization dedicated for trace gas analysis of air, breath or liquid headspace using well defined reaction time allowing calculations of analyte concentrations from the known reaction kinetics without the need for internal standard or calibration.
Atom probe
An atom probe is an instrument that combines time-of-flight mass spectrometry and field ion microscopy (FIM) to map the location of individual atoms.
Pharmacokinetics
Pharmacokinetics is often studied using mass spectrometry because of the complex nature of the matrix (often blood or urine) and the need for high sensitivity to observe low dose and long time point data. The most common instrumentation used in this application is LC-MS with a triple quadrupole mass spectrometer. Tandem mass spectrometry is usually employed for added specificity.[27] There is currently considerable interest in the use of very high sensitivity mass spectrometry for micro dosing studies, which are seen as a promising alternative to animal experimentation.
Protein characterization
Mass spectrometry is an important emerging method for the characterization and sequencing of proteins. The two primary methods for ionization of whole proteins are electrospray ionization (ESI) and matrix-assisted laser desorption/ionization (MALDI). In keeping with the performance and mass range of available mass spectrometers, two approaches are used for characterizing proteins. In the first, intact proteins are ionized by either of the two techniques described above, and then introduced to a mass analyzer. This approach is referred to as "top-down" strategy of protein analysis. In the second, proteins are enzymatically[28-29] digested into smaller peptides using proteases such as trypsin or pepsin, either in solution or in gel after electrophoretic separation. Other proteolytic agents are also used. The collection of peptide products are then introduced to the mass analyzer approach.
Glycan analysis
Mass spectrometry (MS), with its low sample requirement and high sensitivity, has been predominantly used in glycobiology [30-32] for characterization and elucidation of glycan structures.
Space exploration
As a standard method for analysis, mass spectrometers have reached other planets and moons. Two were taken to mars [33-34] by the Viking program.
Respired gas monitor
Mass spectrometers were used in hospitals for respiratory gas analysis beginning around 1975 through the end of the century. Some are probably still in use but none are currently being manufactured.[35]
Found mostly in the operating room, they were a part of a complex system, in which respired gas samples from patients undergoing anesthesia were drawn into the instrument through a valve mechanism designed to sequentially connect up to 32 rooms to the mass spectrometer. A computer directed all operations of the system.[36-37] The data collected from the mass spectrometer was delivered to the individual rooms for the anesthesiologist to use.
CONCLUSION
Mass spectroscopy is evolving into an increasingly powerful tool for both qualitative and quantitative applications.Mass spectrometers are currently available in numerous configurations with various ionization techniques and mass analyzers. The development of ionization techniques such as ESI and MALDI now allows almost any compound to be studied by MS. It has been developed for analyzing small inorganic molecules to biological macromolecules and also structural elucidation of unknown’s compounds. Thus, it can be concluded that mass spectrometry is used to perform two or more sequential separations of ions usually coupling two or more mass analyzers. Coupling a quadrupole and time of flight resulted in the production of high-resolution mass spectrometers.
REFERENCES
1. Warner, M. Anal. Chem. 1989, 61, 101A-103A.
2. DiFlippo, F.; ET. Al. Phys Rev Lett. 1994, 73, 1482.
3. wwrv.cem. msu.edu/-reusch/Virtual Text/Spectrpy/MassSpetrometer
4. Munson, B. Anal. Chem. 1977, 49, 772A-778A.
5. Munson, B.; Field, F. J. Am. Chem. Soc., 1966, 88, 2621-2630.
6. Barber, M.; Bordoli, R.S.; Elliott, G.J.; Sedgwick, R.D.; Tyler, A.N. Anal. Chem. 1982, 54, 645A-657A.
7. Fenselau, C. Anal. Chem. 1982, 54, 105A-114A.
8. Biemann, K. Anal. Chem. 1986, 58, 1288A-1300A.
9. Day, R.J.; Unger, S.E.; Cooks, R.G. Anal. Chem. 1980, 82, 557A-572A.
10. Winograd, N. Anal. Chem. 1993, 65, 622A-629A.
11. Benninghoven, A.; Hagenhoff, B.; Niehuis, E. Anal. Chem. 1993, 65, 630A-640A.
12. Huang, E.C.; Wachs, T.; Conboy, J.J.; Henion, J.D. Anal. Chem. 1990, 62, 713A-725A.
13. Smith, R.D.; Wahl. J.H.; Goodlett, D.R.; Hofstadler, S.A. Anal. Chem. 1993, 65 574A-584A.
14. Hofstadler, S.; Bakhtiar, R.; Smith, R. J. Chem. Educ. 1996, 73, A82-A88.
15. Harrison, W.W.; Hess, K.R.; Marcus, R.K.; King, F.L. Anal. Chem. 1986, 58, 341A-356A.
16. Houk, R.S. Anal. Chem. 1986, 58, 97A-105A.
17. Vela, N.P.; Olson, L.K.; Caruso, J.A. Anal. Chem. 1993, 65, 585A-597A.
18. Karas, M.; Hillenkamp, F. Anal. Chem. 1988, 60, 2299-2301.
19. Fenselau, C. Anal. Chem. 1997, 69, 661A-665A.
20. Price, P. J. Am. Soc. Mass Spectrum., 1991, 2, 336-348.
21. Steel, C.; Henchman, M. J. Chem. Educ., 1998, 75, 1049-1054.
22. Nier, A. J Am Soc Mass Spectrum 1991, 2, 447-452.
23. Cotter, R.J. Anal. Chem. 1992, 64, 1027A-1039A.
24. Allison, J.; Stepnowski, R.M. Anal. Chem. 1987, 59, 1072A-1088A.
25. Wilkins, C.L.; Gross, M.L. Anal. Chem. 1981, 53, 1661A-1676A.
26. Buchanan, M.V.; Hettich, R.L. Anal. Chem. 1993, 65, 245A-259A.
27. Hsieh, Yunsheng; Korfmacher, WA (2006). "Systems for Drug Metabolism and Pharmacokinetic Screening, Y. Hsieh and W.A. Korfmacher, Current Drug Metabolism". Current Drug Metabolism 7 (5): 479–489. doi:10.2174/138920006777697963. PMID 16787157.
28. Covey, T.R.; Lee, E.D.; Henion, J.D. (1986). "Mass Spectrometry for the Determination of Drugs in Biological Samples". Anal. Chem. 58 (12): 2453–2460. doi:10.1021/ac00125a022. PMID 3789400.
29. Covey, Tom R.; Crowther, Jonathan B.; Dewey, Elizabeth A.; Henion, Jack D. (1985). "Mass Spectrometry Determination of Drugs and Their Metabolites in Biological Fluids". Anal. Chem. 57 (2): 474–81. doi:10.1021/ac50001a036. PMID 3977076.
30. Apte, A.; Meitei, N.S. (2009). "Bioinformatics in Glycomics: Glycan Characterization with Mass Spectrometric Data Using SimGlycan". Functional Glycomics: Methods and Protocols. Methods in Molecular Biology 600: 269–281. doi:10.1007/978-1-60761-454-8_19. ISBN 978-1-60761-453-1. PMID 19882135.
31. Harvey, D.; Dwek, R.A.; Rudd, P.M. (2000). "Determining the Structure of Glycan Moieties by Mass Spectrometry". Current Protocols in Protein Science Chapter 12: 12.7–12.7.15. doi:10.1002/0471140864.ps1207s43. ISBN 0-471-14086-4. PMID 18429296.
32. Blow, N. (2009). "Glycobiology: A spoonful of sugar". Nature 457 (7229): 617–620. Bibcode 2009Natur.457..617B. doi:10.1038/457617a. PMID 19177129.
33. S. Petrie and D. K. Bohme (2007). "Ions in space". Mass Spectrometry Reviews 26 (2): 258–280. doi:10.1002/mas.20114. PMID 17111346.
34. Hoffman, J; Chaney, R; Hammack, H (2008). "Phoenix Mars Mission—The Thermal Evolved Gas Analyzer". Journal of the American Society for Mass Spectrometry 19 (10): 1377–83. doi:10.1016/j.jasms.2008.07.015. PMID 18715800
35. "Cassini Plasma Spectrometer". Southwest Research Institute. Retrieved 2008-01-04.
36. Riker JB, Haberman B (1976). "Expired gas monitoring by mass spectrometry in a respiratory intensive care unit". Crit. Care Med. 4 (5): 223–9. doi:10.1097/00003246-197609000-00002. PMID 975846.
37. J. W. W. Gothard, C. M. Busst, M. A. Branthwaite, N. J. H. Davies and D. M. Denison (1980). "Applications of respiratory mass spectrometry to intensive care". Anaesthesia 35 (9): 890–895. doi:10.1111/j.1365-2044.1980.tb03950.x. PMID 6778243.
NOW YOU CAN ALSO PUBLISH YOUR ARTICLE ONLINE.
SUBMIT YOUR ARTICLE/PROJECT AT articles@pharmatutor.org
Subscribe to Pharmatutor Alerts by Email
FIND OUT MORE ARTICLES AT OUR DATABASE