ABOUT AUTHORS:
V.Surekha1, V.S.Thiruvengada Rajan1, C.Madhusudhan Chetty2
1Dept of pharmaceutical analysis and quality assurance
2Dept.of Biotechnology
Annamacharya college of pharmacy, Rajampet
surekhapharmacy@gmail.com
ABSTRACT:
Majority of instances of food spoilage can be attributed to the attack by pathogens (disease-causing microorganisms ) such as bacteria and molds, Different methods that had been devised for preserving foods are all designed to reduce or eliminate to the causative agents. The food preservation refers to techniques used to prevent food from spoiling. Food preservative that enhances human health by killing or limiting growth of food borne pathogens and spoilage organisms. In recent decades increasing consumption of foods containing high levels of preservatives. The proposed methods were used for detection of different preservatives in various food stuffs by different analytical techniques like Uv-Visible, Calorimetry, HPLC, GC, LCMS and Electrophoresis.
REFERENCE ID: PHARMATUTOR-ART-2028
1. INTRODUCTION
The term food preservation refers to any one of a number of techniques used to prevent food from spoiling. It includes methods such as canning, pickling, drying and freeze-drying, irradiation, pasteurization, smoking, and the addition of chemical additives. The process prevents or retards spoilage because high temperatures kill or inactivate most kinds of pathogens. The addition of compounds known as BHA and BHT to foods also prevents spoilage in another different way. These compounds are known to act as antioxidants, preventing chemical reactions that cause the oxidation of food, those results in its spoilage (Adrogué.HJ et al., 1986)
Fruit juices, beer, wine and water all contain preservatives to prolong shelf life. Health warnings about drinking wine and beer are common because wine contains the preservative sulfur dioxide and many beers contain benzoic acid. Benzoic acid causes skin and eye irritation; sulfur dioxide is known to cause respiratory issues. Fruit juices often contain sorbic acid, which is known to cause skin irritations such as dermatitis and eczema. Potassium sorbate is added to beverages to prevent fermentation and add to the beverage's shelf life; consumption of potassium sorbate is documented to cause diarrhea and nausea.
Chemical preservatives are added to wood, cosmetics and everyday products such as shampoos to keep the product from molding. Shampoos, cosmetics, bubble baths and hair dyes contain sodium lauryl sulfate, which contains the preservative formaldehyde. Sodium lauryl sulfate causes skin rashes and dermatitis. Chromated copper arsenate (CCA) is commonly used to treat wood. Food preservatives to prevent famine and spoilage, studies show that food preservatives are a serious threat to humans, show that food preservatives like sodium benzoate cause hyperactivity in children and is one of the leading factors of asthma and nettle rash. Common antimicrobial sulfite preservatives such as potassium hydrogen sulfite are used to maintain potato chips, canned soups, dried fruit and processed vegetables; sulfites cause digestive poisoning. Ethanol serves as a preservative for cakes and bread but is hard for the body to digest; it is suggested that using ethanol to preserve foods causes cancer.
2 ADVANTAGES AND DISADVANTAGES OF PRESERVATIVES (Adrogué,H.J et al.,1998 Dr. Adrian et al., 2008, C. Tarantola et al.,1986 )
|
s. no
|
PRESERVATIVES |
METHOD |
ADVANTAGES
|
DISADVANTAGES |
|
1 |
Benzoic Acid and Sorbic Acid |
Overlapped HPLC -PDA |
Preservatives Can Causes Disinfectant Preservatives Can Causes Anti Microbial Action Preservatives Can Prolong Shelf Life It Increases The Bulk of The Compound It Acts Bacterostatic And Bacterositic It Prevent Oxidation Of Product It Prevent Degradation Of Product |
Preservatives Can Causes Cancer Preservatives Can Have Allegric Reaction Preservatives Can Have Hyper Senstive Reaction Preservatives Causes Cardiovascular Disease.
Benzoic Acid Causes Skin And Eye Irritation
Preservative cause Diarrhea And Nausea
It Causes Skin Allergy |
|
2 |
Sodium Benzoate and Potassium Benzoate |
HPLC |
||
|
3 |
Benzoic Acid |
UV Spectrophotometry |
||
|
4 |
Sorbic Acid |
UV Spectrophotometry |
||
|
5 |
Sodium, Potassium Salts Of Nitrates And Nitrites |
Colorimetry |
||
|
6 |
BHT And BHA |
HPLC |
||
|
7 |
Methylparaben And Propyl Paraben |
HPLC |
||
|
8 |
Copper Sulfate |
GCMS |
||
|
9 |
Benzoic Acid and Sorbic Acid |
Capillary Electrophoresis |
3. EXPERMENTAL PROCEDURES
3.1 SODIUM BENZOATE AND POTASSIUM SORBATE PRESERVATIVES USING HIGH-PERFORMANCE LIQUID CHROMATOGRAPHY (Garcy´a et al., 2003)
PREPARATION OF SAMPLE
The soft drink and herbal extract samples were filtered through a 0.45 -μm membrane. If the concentration of the preservative in the beverage and herbal extract are higher than the largest one used to build the calibration curve, the drink and extract samples were diluted in water.
CHROMATOGRAPHIC CONDITIONS
The mobile phase contains a mixture of acetonitrile–ammonium acetate buffer adjusted to (40: 60). The buffer was prepared by dissolving 3.84 g of ammonium acetate in one liter of water and adjusting the pH to 4.4 with acetic acid. Before use, the effluent was filtered through a 0.45-mm membrane filter and degassed in an ultrasonic bath. The separation was achieved with isocratic elution at a flow-rate of 0.8 ml min and 50 μl of sample were injected into the chromatographic system.
CALIBRATION CURVE OF STANDARD SOLUTIONS
Mixed standards containing 1, 2, 5, 10, 20 and 40 mg l-1of SB and 0.1, 0.2, 0.5, 1, 2, and 4 mg l-1 of PS was prepared. 50 μl of each standard was injected. The peak areas were1measured and those of analytes (y) were plotted against the respective concentration (mg l-1) of SB and PS (x). Least square linear regression analysis was used to determine the slope, y-intercept and the correlation coefficients of the standard plots.
BY THE ABOVE STUDY FOLLOWING RESULTS FOUND TO BE
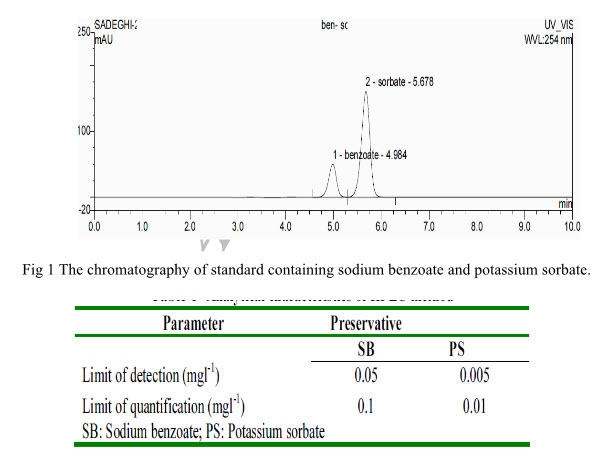
The chromatogram of a standard solution, which contains 40 mg l-1 of sodium benzoate and 4 mg l-1 of potassium sorbate it was obtained with the experimental conditions The retention times for SB and PS are about 4.9and 5.6 min respectively. The elution order is (1) sodium benzoate (retention time, 4.98 min) and (2) potassium sorbate (retention time, 5.67 min).Values found in the separation and the resolution of the column, indicate that the analytical method proposed in this work completely separates the analytes. The limit of detection (LOD) is defined as the smallest peak detected with a signal height three times that of the baseline while the limit of quantization (LOQ) referred to the lowest level of analyte which can be determined with an acceptable degree of confidence.
3.2 BENZOIC AND SORBIC ACID PRESERVATIVES IN A MIXTURE WITH HIGH PERFORMANCE LIQUID CHROMATOGRAPHY-PHOTO DIODE ARRAY DETECTOR (HPLC PDA) CHROMATOGRAM(Ferreira et al., 2000)
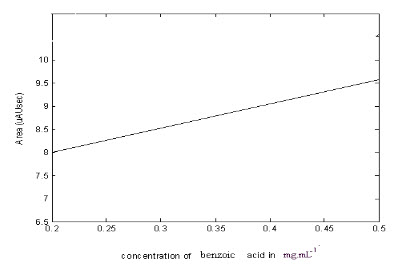
Calibration matrix of sorbic and benzoic acid in the range 0.5mg of benzoic in 1mL of ACN and 0.2mg of Sorbic in 1mL of ACN were performed. Volumes of 20 mL were injected into the chromatographic system and the chromatographic separations were performed on a C18 column with a mobile phase of Acetonitrile and water (85:15 v/v) at a flow-rate of 1 mL.min-1 and a Wavelength of 254 nm. The solvent was filtered through Utipol N66 nylon 66 membrane filters, and degassed with Fast Clean Ultra Sonic Cleaner.Then the mixtures of sorbic and benzoic acid in different concentration (i.e.,0.5mg of benzoic acid in 1mL of CAN and, 0.2mg of sorbic acid in 1mL of ACN; 0.2mg of benzoic acid in 1mL of ACN and 0.5mg of sorbic acid in 1mL of ACN; 0.3mg of benzoic acid in 1mL of ACN and 0.5mg of sorbic acid in 1mL of ACN;, 0.3mg of benzoic acid in 1mL of ACN and 0.2mg of sorbic acid in 1mL of ACN) were prepared and analyzed using HPLC-PDA at a wavelength of 254nm and with a carrier flow at the rate of 1 mLmin-1..
By the above study following results found to be
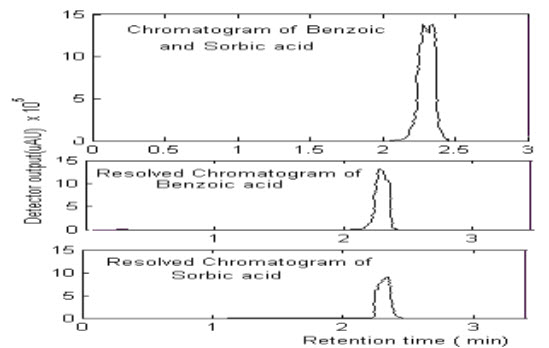
The analytical separation of sorbic and benzoic acid in the injected mixture using a Qualisil BDS C18 column (250 x 4.6 mm I.D.) was investigated. Acetonitrile -water were used as a mobile phases for performing the separation. The sorbic and benzoic acid were easily eluted by Acetonitrile - water and the retention time seemed to be closer. the chromatograms for sample containing sorbic and benzoic acid in different concentration using Acetonitrile -water (85:15 v/v) as the mobile phase.
3.3 SIMULTANEOUS DETERMINATION OF PRESERVATIVES (BENZOIC ACID, SORBIC ACID, METHYL PARABEN AND PROPYLPARABEN) IN FOODSTUFFS USING HIGH-PERFORMANCE LIQUID CHROMATOGRAPHY (R. Hajkova et al., 2002)
PREPARATION OF SAMPLE
Solid food samples were finely ground prior to the extraction.About 1 g sample is accurately weighed in a screwcappedtest tube. Twenty-five milliliters of methanol was added, and placed in a sonicator (ULTRAsonik Model 28X, Ney Dental, Yucaipa, California) that was maintained at 50 ?C for 30 min. The test tube was next subjected to vortex mixing (KIKAWorks, Model MS1, Malaysia) for 2 min. he contents were filtered through a 0.45-_m nylon membrane filter (Whatman, Maidstone, UK) and the clear filtrate was injected into the HPLC column. For concentrated samples, prior dilution with the mobile phase was done.
CHROMATOGRAPHIC CONDITIONS
Analytical separation was carried out on a Jasco PV- 1580 HPLC unit using a Supelco 516 C18 column (15 cm×4.6 mm, 5_m) at room temperature. The detector `used was a Jasco UV-1570 UV–vis spectrophotometer set at 254 nm and the volume of sample injected was 20 _L. The aqueous phase was prepared by weighing 3.8 g ammonium acetate and dissolving in 1 L water and its pH adjusted to 4.4 using acetic acid. The mobile phase used was methanol–acetate buffer (pH 4.4) (35:65, v/v) for 9 min, after which it was changed to methanol–acetate buffer (pH 4.4) (50:50, v/v).
BY THE ABOVE STUDY FOLLOWING RESULTS FOUND TO BE
The UV absorption spectrum of the preservatives are It can be anticipated that a small peak for BA will be obtained if the detector wavelength was fixed at 254 nm, while on the other hand small peaks for SA, MP and PP will be obtained if the detector is set at 230 nm. Thus, in order to obtain maximum sensitivity, detecting at the respective maximum wavelengths of preservatives can done (i.e., 230 nm for BA, 254 nm for the others).
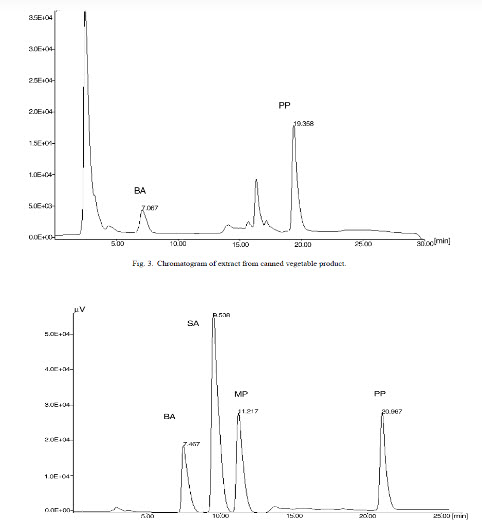
fig 4 The chromatography of standard of B A ,S.A ,M.P ,P.P.
3.4 SORBIC ACID PRESERVATIVES BY UV -SPECTROPHOTOMETRY
PREPARATION OF SAMPLE
Sorbic acid standard solution (0.1 mg/ml): Accurately weigh 100 mg of sorbic acid (equivalent potassium sorbate), dissolve and make up to one litre with distilled water.
PROCEDURE
Weigh 50 gm sample into a 1 litre steam distillation flask . Add 100 gm of Magnesium sulphate and 100 ml 1N sulphuric acid. Place 10 ml of 1N NaOH into steam distillation receiver. Steam distill rapidly (Note – do not heat the distilling flask). Collect about 450 ml distillate in about 30 minutes. Cool and transfer the distillate to a 500 ml volumetric flask. Add 15 ml 1 N Sulphuric acid and make to volume with water. Mix. Pipette 2 ml into a test tube and add 2 ml of dichromate solution. Heat in a water bath for 5 minutes. Then cool. Add 2 ml TBA solution and heat in a boiling water bath 10 minutes.Cool rapidly and transfer to a 50 ml volumetric flask with water. Make to volume with water. Measure the absorbance of the solution at 532 nm using a 1 cm cuvette and water as the reference.
PREPARE A STANDARD CURVE AS FOLLOWS.
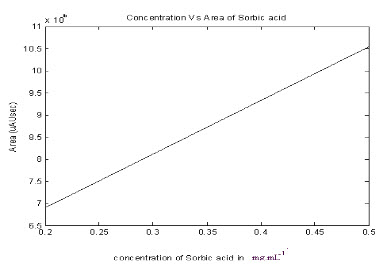
Dissolve 1.0 gm of sorbic acid in a small volume of 1N NaOH and dilute to 1 litre with water.. This is the stock solution (1mg / ml ). Prepare a blank and 3 working solutions by first pipetting 25 ml of the stock solution to a 500 ml volumetric flask ( 50 ug ml) and diluting to volume with water. Next pipette 0.0 m, 10.0, 20.0, 50. 0 and 80.0 of this solution into five 100 ml volumetric flasks and dilute to volume with water ( range 0, 5, 10, 25, and 40 ug / ml). Pipette 2 ml of each of the working standards and blanks into 5 test tubes and continue as in the above procedure, starting at addition of dichromate. Plot absorbance vs ug sorbic acid for a standard curve ( ug sorbic acid = 0, 10, 20, 50, 80 in 2 ml aliquots).
3.5 BENZOIC ACID BY UV SPECTROPHOTOMETERY
PREPARATION OF SAMPLE
Mix sample thoroughly. Transfer 10 gm or 10 ml to separator and dilute to 200 ml with saturated NACL solution. Make solution definitely acidic to litmus with HCI and mix well.
PREPARATION OF STANDARD CURVE
Prepare solution of benzoic acid in ether containing 50 mgs/l. Determine absorbance of this solution in tightly stoppered cell in Beckman DU or recording spectrophotometer between 265 and 280 nm at 1 nm intervals. Plot absorbance against wavelength and record wavelength of minimum at approximately 267.5 nm as point B. Other minimum at approximately 276.5 nm as point D and highest maximum at approximately 272 nm as point C.
Prepare solution of benzoic acid in ether containing 20, 40, 60, 80,100 and 120 mg/l. Determine absorbance of these solutions in a spectrophotometer at points B, C and D. For each concentration average absorbance at Band D subtract from absorbance at C. Plot difference against concentration to get the standard curve.
3.6 BENZOIC ACID AND SORBIC ACID WAS PERFORMED BY CAPILLARY ELECTROPHORESIS(Winslow, S.D et al., 2000)
SAMPLE PREPARATION
Soy sauce and vinegar with the labeling of food preservatives. Vinegar was directly diluted with double-distilled water to 1:10 (v/v) and filtered through a 0.45 lm filter membrane. Two milliliters of soy sauce and 1 ml CCl4 were mixed and the solution was vortexed for 10 min. Then, the lipids extracted into the organic phase were discarded. The aqueous phase solution obtained was transferred into a dry vial. The aqueous phase solution was diluted with double-distilled water to 1:10 (v/v) and filtered through a 0.45 lm filter membrane.
STANDARD PEPARATION
Boric acid, borax, disodium hydrogen phosphate, TBAB, SDS and Tris were dissolved in double-distilled water, respectively, to prepare the concentration of 0.1 mol L_1 as the stock solutions. Stock standard solutions of organic acids were prepared at a concentration of 1 · 10_3 mol L_1 using double-distilled water, respectively. In all cases, the pH value was measured in a pH meter with a combined electrode. The required pH value was adjusted with H3BO3 or NaOH. The samples and BGEs were filtered through a 0.45 lm cellulose acetate filter membrane
The capillary was conditioned for 30 min with 0.1 mol L_1 NaOH and 10 min with water. Additionally, the capillary washed for 2 min with 0.1 mol L_1 NaOH, 2 min with water and 5 min with the running buffer before each run. Between runs, the capillary was washed with running buffer. The experiment was done under constant humidity (40%).
LINEARITY, REPRODUCIBILITY AND DETECTION LIMIT
The optimized instrumental and operational parameters for the standard solution, the linearity of the Using method was calculated and expressed as the correlation coefficient, and the reproducibility of the method was measured.
Faster separations are obtained in CE when the electrophoretic vector and the electro osmotic flow are in the same direction. The separations of two organic acids in four different BG including 20 m mol L_1 borax–20 m mol L_1 H3BO3, 20 m mol L_1 Tris–20 m mol L_1 H3BO3, 20 m mol L_1Na2HPO4–20 m mol L_1 H3BO3 and 20 m mol L_1 NaOH–20 m mol L_1 H3BO3, were tried and the migration times of Benzoic acid have the migration time in 20 m mol H3BO3 (pH 8.8) sorbic acid could not be separated completely and synchronously in 20 m mol L_1 Tris–20 m mol L_1 H3BO3 (pH 8.8). In 20 m mol L_1Na2HPO4–20 m mol L_1 H3BO3 (pH 8.8), two organic acids were separated, but benzoic acid have leading peaks. In 20 m mol L_1 NaOH–20 m mol L_1 H3BO3 (pH 8.8) two organic acids were separated and detected absolutely with sharp and symmetrical peaks, compared with the other BGEs. Dilute electrolyte solutions are desirable to shorten migration time
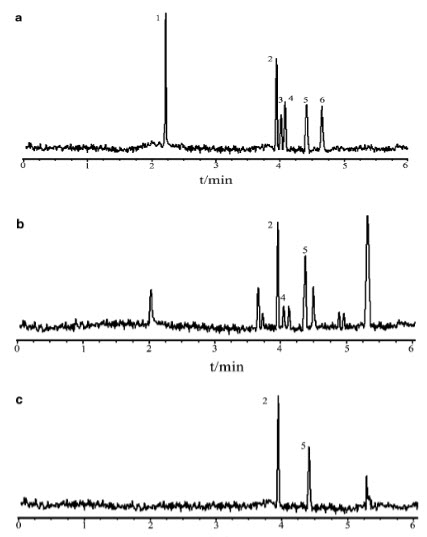
FIG 5 Electrophoresis Of Benzoic Acid Of Standard And Sample
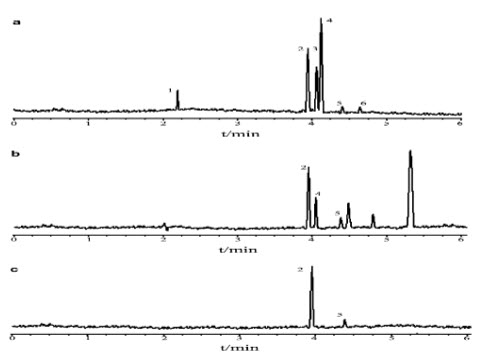
fig 6 electrophoresis of sorbic acid of standard and sample
3.7 DETERMINATION PRESERVATIVES IN FOOD SAMPLE BY LCMS
PREPARATION OF SAMPLE
copper sulfate ACS grade. Used as a sample preservative for inhibiting microbial activity in stored samples sodium sulfate, anhydrous Acs grade. Material should be Soxhlet extracted with methylene chloride for a minimum of 4 h or heated to 400° C for 2 hrs in a muffle furnace.
STANDARD SOLUTION
The stock standard solutions may be used to prepare a primary dilution standard (PDS) solution that contains multiple method analytes in ethyl acetate. Aliquots of each of the stock standard solutions are combined to produce the primary dilution in which the concentration of the analytes is at least equal to the concentration of the most concentrated calibration solution, typically, 10 ng/:L. Store the primary dilution standard solution in an amber vial at 0° C or less, and check regularly for signs of degradation or evaporation, especially just before preparing calibration solutions.
PROCEDURE
solid phase extraction procedure may be performed manually or in an automated mode using a robotic or automatic sample preparation device. If an automatic system is used to prepare samples, follow the manufacturer's operating instructions, but all extraction and elution steps must be the same as in the manual procedure. Extraction and/or elution steps may not be changed or omitted to accommodate the use of an automated system. Mark the level of the sample on the outside of the sample bottle for later sample volume determination Verify that the sample is between pH 5 and 7, and is free of residual chlorine. If the sample is an LRB or LFB, add sample preservatives specified in Sect. 8.2. Add an aliquot of the surrogate fortification solution(s), and mix immediately until homogeneous. The resulting concentration of these compounds in the water should be 1-5:g/L. Generally, SIM analyses should be performed with surrogate concentrations at the low end of this range. If the sample is a LFB or LFM, add the desired amount of analyte fortification solution.
IDENTIFICATION OF ANALYTES FOR FULL SCAN MASS SPECTROMETRY
Identify a sample component by comparison of its mass spectrum (after background subtraction) to a reference spectrum in the user-created data base. The GC retention time of the sample component should be within 1-2 sec of the retention time observed for that same compound in the most recently analyzed continuing calibration check standard. Ideally, the width of the retention time window should be based upon measurements of actual retention time variations of standards over the course of a day. Three times the standard deviation of a retention time can be used to calculate a suggested window size for a compound. However, the experience of the analyst should weigh heavily in the interpretation of the chromatogram. In general, all ions that are present above 10% relative abundance in the mass spectrum of the standard should be present in the mass spectrum of the sample component and should agree within absolute 20%. For example, if an ion has a relative abundance of 30% in the standard spectrum, its abundance in the sample spectrum should be in the range of 10 to 50%.
CONCLUSION
Identification of preservatives on food stuffs by different analytical methods like Uv-Visible Calorimetry, HPLC, GC, LC-MS and Electrophoresis was performed to determine the effects of their action on human health.
REFERENCES
- Adrogué.HJ and Madias NE, Sodium and potassium in the pathogenesis of hypertension. J. Medical scienc ,1966–1978 PP 356
- Alderman MH. 2006. Evidence relating dietary sodium to cardiovascular disease.Dept of Nutrition and sciences, 1999 PP 25.
- Askar A, Elsamahy SK, Shehata HA, and Tawfik M. Pasterma and beef bouillon the effect of substituting KCl and K lactate for sodium chloride. 2000,PP 73:289–292.
- C. Tarantola and B. Varaldo, Riv. Viticolt. Enol. (Conegliano). Advantages and disadvantages of preservatives. 1964 PP 60-65
- Dr. Adrian, Morris of Surrey Allergy Clinic; Allergy to Food Additives and Preservatives. J.Enthanopharmcology, 2008 .
- Escobal, A., Gonzalez, J., & Iriondo, C. Laborra. Liquid chromatographic determination of organic acids in txakoli from Bizkaia. Dept of Food Chemistry,1987 PP 58, 381–384.
- Falque-Lopez, E., & Ferna´ndez-Go´mez, E. Simultaneous determination of the major organic acids, sugars, glycecol, and ethanol by HPLC in grape musts and white wine. Journal of Chromatographic Science,1996 PP 35, 254–257.
- Garcy´a, I., Ortiz, M. C., Sarabia, L., Vilches, C., & Gredilla, E. Advances in methodology for the validation of methods according to the International Organization for Standardization Application to the determination of benzoic and sorbic acids in soft drinks by high performance liquid chromatography. Journal of Chromatography A, 2003 PP 11–27.
- Hajslova, J., k. Holadova, V. Kocourek, J. Poustka, M. Godula, P. Cuhra, M. Kempny,“Matrix Induced Effects and a Critical Point in the Gas Chromatographic Analysis of Pesticide Residues,” J. Chromatography,1998 PP. 283-295.
- I.M.P.L.V.O. Ferreira, E. Mendes, P. Brito, M.A. Ferreira. Simultaneous determination of benzoic and sorbic acids in jam by HPLC. INT. of Food Res,2000, PP. 33, 113-117.
- Mota FJM, Ferreira IM, Cunha SC., Beatriz M and Oliveira PP. Optimization of extraction procedures for analysis of benzoic and sorbic acids in foodstuffs. J of Food Chem. 2003,PP 82: 469 - 73.
- R. Hajkova, P. Solich, M. Pospisilova, J. Sicha. Simultaneous determination of methylparaben, propylparaben, sodium diclofenac and its degradation product in a topical emulgel by reversed-phase liquid chromatography. J of Anal. Chemistry, 2002, PP 467,91-96.
- S.A.V. T. founi, M.C.F. Toledo, “Determination of benzoic and sorbic acids in Brazilian food. J.Food Control,2002 PP 13, 117-123.
- Winslow, S.D., B. Prakash, M.M. Domino, B.V. Pepich and D.J. Munch. Determination of Selected Semivolatile Organic Compounds in Drinking Water by Solid Phase Extraction and Capillary Column Gas Chromatography/ Mass Spectrometry(GC/MS). Vol. 1, 2000 EPA 815-R-00-014
NOW YOU CAN ALSO PUBLISH YOUR ARTICLE ONLINE.
SUBMIT YOUR ARTICLE/PROJECT AT articles@pharmatutor.org
Subscribe to Pharmatutor Alerts by Email
FIND OUT MORE ARTICLES AT OUR DATABASE