{ DOWNLOAD AS PDF }
ABOUT AUTHORS
Devender Sharma1*, Ameya Lanjewar2
1Department of Pharmaceutics, Hi-Tech College of Pharmacy, Chandrapur India
2Department of Pharmaceutics, Kamala Nehru College of Pharmacy, Butibori Nagpur India
*sdevender350@gmail.com
ABSTRACT
Ibuprofen largely used in various disorders treatment likely to be rheumatoid arthritis, osteoarthritis and other musculoskeletal disorders, especially where pain is more prominent than inflammation. Ibuprofen is used as a simple analgesic, antipyretic and it is particularly effective in dysmenorrheal. By the process of Moisture activated dry granulation, Ibuprofen tablets prepared but these method prepared tablets do not give better drug content, drug release. So formulation optimize by full factorial i.e. change in various polymer concentration like SSG and Povidone at three different levels. Ibuprofen tablets manufactured by moisture activated dry granulation method with optimization show better drug release, drug stability in comparison of marketed preparation. Due to optimization, Ibuprofen tablets which manufactured by moisture activated dry granulation method have very low cost in comparison of marketed preparation. The main objective of this research work water poorly soluble drug like ibuprofen tablet manufactured by moisture activated dry granulation by optimize process gives better drug release, manufacture cost also less other than marketed tablets.
[adsense:336x280:8701650588]
Reference Id: PHARMATUTOR-ART-2556
|
PharmaTutor (Print-ISSN: 2394 - 6679; e-ISSN: 2347 - 7881) Volume 6, Issue 1 Received On: 27/09/2017; Accepted On: 02/11/2017; Published On: 01/01/2018 How to cite this article: Sharma D, Lanjewar A; Optimization and Evaluation of Ibuprofen Tablets by MADG Method; PharmaTutor; 2018; 6(1); 56-71; http://dx.doi.org/10.29161/PT.v6.i1.2018.56 |
INTRODUCTION
Tablet are widely used other than dosage form of medicaments. Tablets are unit the solid dosage form of medicament or medicaments, usually circular in shape and may be biconvex or flat. Tablet have various advantages other than the dosage form, advantages like easy to administered, east to be dispensed, more stable and maintain the accuracy of dosage form. Manufacturing of tablets various step involved given below. (Devender et al., 2017)
|
Manufacturing of tablets |
|
Preparation of granules |
|
Compression of granules into tablets |
|
If required or necessary then coating |
|
Quality control of tablets |
In the main step preparation of granules for compression, mainly weighing the ingredients, mixing the powdered ingredients and excipients and converting the mixed ingredients into granules. Generally granules can be prepared by different method like moist granulation method, dry granulation method and granules by preliminary compression or other different method. But here now, we prepare granules by moisture activated granulation method. (Ankit et al., 2011) Moisture activated dry granulation method not largely used but effective in case of poorly water soluble drug or water insoluble drug like ibuprofen and other drug. Granulation is the process in which primary powder particles are made to adhere to form larger, multi particle aggregates called granules. (Lachman et al., 1990) Granulation is used mainly to improve flow and compressibility of powders so as to prevent segregation of the blend components to improve content uniformity, and eliminate excessive amounts of fines. Particle size of granules is mainly affected by the quantity and feeding rate. (Devender et al., 2017) Ibuprofen tablets are manufactured by moisture activated dry granulation method (following step carried out given below). (Devender et al., 2017)
|
Moisture Activated Dry Granulation |
|
Dispensing and Shifting |
|
Dry mixing |
|
Granulation |
|
Pre-mixing (unlubrication) |
|
Lubrication |
|
Compression |
Material and Method
Ibuprofen BP was procured as a gift sample from ZIM Laboratories Ltd, Nagpur, Maharashtra. Colloidal anhydrous silicon (Aerosil) was procured as a gift sample from ZIM Laboratories Ltd, Nagpur, Maharashtra. Maize starch was procured from ZIM Laboratories Ltd, Nagpur, Maharashtra. Lactose DC was procured from ZIM Laboratories Ltd, Nagpur. PVP K30 (Povidone) was procured from ZIM Laboratories Ltd, Nagpur, Maharashtra. Microcrystalline cellulose was procured from ZIM Laboratories Ltd, Nagpur, Maharashtra. Talcum was procured from ZIM Laboratories Ltd, Nagpur, Maharashtra. All other chemicals used were of analytical grade.
Formulation and Optimization
Optimization is the process of finding or determining the best way of using the existing or available resources while taking into accounts all of the factors that influence decisions in any experiment. It is a means of determining or finding the best possible value of a dependent variable by changing certain independent variables (those are depend upon dependent variables). This approach is time-consuming and reliable. Optimization by means of an experimental design may helpful in shortening the experimenting time. (Devender et al., 2017)
Design of experiments Factorial design was applied to design the experiments. On the basis of Preliminary trials concentration of SSG, Povidone and RPM were used as independent variables. Whereas disintegration time and %drug release, were kept as dependent variables. Formulations F1 to F9 were prepared using SSG and Povidone concentration at three different levels. The summary of the formulations is shown in table. (Ankit et al., 2011)
|
Independent variables |
Dependent variables |
|
X1= Sodium starch glycolate |
Y1= Disintegration time |
|
X2=Povidone |
Y2= % Drug release |
Factors and levels with their real values (Devender et al., 2017)
|
Factors |
Low level (-1) |
Middle level (0) |
High level (1) |
|
Sodium starch glycolate (mg) |
5mg |
12.5mg |
20mg |
|
Povidone (mg) |
1.25mg |
6.87mg |
12.5mg |
Formulations of optimized batches Ibuprofen 650mg
|
Batch No. |
Drug (mg) |
Lactose DC (mg) |
Aerosile (mg) |
MCC (mg) |
Starch (mg) |
PVP K30 (mg) |
SSG (mg) |
Talc (mg) |
Magnesium stearate (mg) |
Moisture (%) |
Time (min.) |
RPM
|
|
F1 |
400 |
136.5 |
4 |
20 |
50 |
12.5 |
20 |
5 |
2 |
2.0 |
30 |
150 |
|
F2 |
400 |
147.75 |
4 |
20 |
50 |
1.25 |
20 |
5 |
2 |
2.0 |
30 |
150 |
|
F3 |
400 |
149.63 |
4 |
20 |
50 |
6.87 |
12.5 |
5 |
2 |
2.0 |
30 |
150 |
|
F4 |
400 |
151.5 |
4 |
20 |
50 |
12.5 |
5 |
5 |
2 |
2.0 |
30 |
150 |
|
F5 |
400 |
162.75 |
4 |
20 |
50 |
1.25 |
5 |
5 |
2 |
2.0 |
30 |
150 |
|
F6 |
400 |
157.13 |
4 |
20 |
50 |
6.87 |
5 |
5 |
2 |
2.0 |
30 |
150 |
|
F7 |
400 |
155.25 |
4 |
20 |
50 |
1.25 |
12.5 |
5 |
2 |
2.0 |
30 |
150 |
|
F8 |
400 |
142.13 |
4 |
20 |
50 |
6.87 |
20 |
5 |
2 |
2.0 |
30 |
150 |
|
F9 |
400 |
144 |
4 |
20 |
50 |
12.5 |
12.5 |
5 |
2 |
2.0 |
30 |
150 |
Preformulation study (Devender et al., 2017)
Flow characterization
A. Bulk density
Bulk density or apparent density is defined as the ratio of mass of a powder to the bulk volume. The bulk density of a powder depends primarily on particle size distribution, particle shape and the tendency of the particles to adhere to one another. (Lachman et al., 1990)
Procedure: A quantity of 15.0 g of drug powder or granules was passed through 20 # sieve to break any agglomerates formed during the drug storage. This quantity was introduced into a 50 ml measuring cylinder. The powder was level without compacting it and the apparent volume was measured.
| Bulk density = weight of sample in gram / volume occupied by the sample |
B. Tapped density
A quantity of 15.0 g of powder or granules was passed through 20# sieve to break any agglomerates formed during storage. This quantity was introduced into a 50 ml measuring cylinder. The graduated cylinder containing a known mass of blend was tapped for a fix time. Cylinder was tapped for 500 times initially and the tapped volume (V1) was measured to the nearest graduated units repeated the tapping was repeated for additional 750 times and tapped volume (V2) was measured to the nearest graduated units. If the difference between the two volumes is less than 2 percent then volume (V2) is taken rather again tapping for additional 1250 times.
|
Tapped density = Wt. of sample in g / Tapped volume |
NOW YOU CAN ALSO PUBLISH YOUR ARTICLE ONLINE.
SUBMIT YOUR ARTICLE/PROJECT AT editor-in-chief@pharmatutor.org
Subscribe to Pharmatutor Alerts by Email
FIND OUT MORE ARTICLES AT OUR DATABASE
C. Hausner’s ratio and Compressibility index
In recent years the compressibility index and the closely related Hausner’s ratio have become the simple, fast and popular methods for predicting powder flow characteristics. Both the compressibility index and the Hausner’s ratio were determined by using bulk density and the tapped density of a powder. (Ankit et al., 2011)
i. Hausner’s ratio
Hausner’s ratio gives an idea regarding the flow of the blend. It is the ratio of tapped density to the apparent density.
Hausner’s ratio was calculated using following formula,
| Hausner ration = Tapped density (gm/cm2)/ bulk density (gm/cm3) |
Compressibility index
The compressibility index measures the propensity of powder to be compressed. The packing ability of drug was evaluated from change in volume which is due to rearrangement of packing occurring during tapping. (Lachman et al., 1990)It is indicated as Carr’s compressibility index (CI) and calculated using following formula,
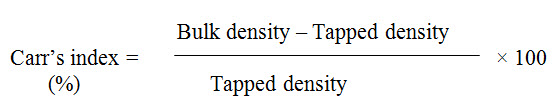
Table: Limits of Compressibility index and Hausner ratio
|
Sr. No. |
Compressibility |
Flow character |
Hausner’s ratio |
|
1 |
<_10 |
Excellent |
1.00–1.11 |
|
2 |
11–15 |
Good |
1.12–1.18 |
|
3 |
16–20 |
Fair |
1.19–1.25 |
|
4 |
21–25 |
Passable |
1.26–1.34 |
|
5 |
26–31 |
Poor |
1.35–1.45 |
|
6 |
32–37 |
Very poor |
1.46–1.59 |
|
7 |
>38 |
Very, very poor |
>1.60
|
a) Angle of repose
Irregular flow of powders from the hopper produces tablets with non uniform weights. As a result content uniformity and dose precision cannot be achieved in production of tablets and capsules. Angle of repose is defined as the maximum angle that can be obtained between the freestanding surface of a powder heap and the horizontal plane. (Ankit et al., 2011)
Procedure
The angle of repose was determined by the glass funnel method. The height of the funnel was adjusted in a way that the tip of the funnel just touched to the apex of the hip of the powder. The accurately weighed quantity of powder blend was passed through the funnel. The powder was allowed to flow through the funnel freely on to the surface. (Lachman et al., 1990) The diameter of the powder cone was measured and angle of repose was calculated using following formula,
Tan θ = h/r
Where,
h = Height of pile.
r = Radius of the base of pile.
θ = Angle of repose
Table: Flow properties and corresponding angles of repose
|
Sr. No. |
Flow property |
Angle of repose ( ө ) |
|
|
Excellent |
25–30 |
|
|
Good |
31–35 |
|
|
Fair - aid not needed |
36–40 |
|
|
Passable - may hang up |
41–45 |
|
|
Poor - must agitate, vibrate |
46–55 |
|
|
Very poor |
56–65 |
|
|
Very very poor |
>66 |
Table: Formulation flow characterization (Devender et al., 2017)
|
FORMULATION |
MOISTURE (%) |
BD (g/cm3) |
TD (g/cm3) |
HR |
CI (%) |
FLOWABILITY |
Angle of repose |
|
F1 |
2 |
0.596 |
0.704 |
1.23 |
19.44 |
Fair |
35 |
|
F2 |
2 |
0.596 |
0.728 |
1.28 |
19.54 |
Fair |
36 |
|
F3 |
2 |
0.586 |
0.609 |
1.01 |
4.58 |
Excellent |
25 |
|
F4 |
2 |
0.526 |
0.706 |
1.21 |
19.64 |
Fair |
39 |
|
F5 |
2 |
0.556 |
0.608 |
1.09 |
4.58 |
Excellent |
26 |
|
F6 |
2 |
0.647 |
0.769 |
1.11 |
15.69 |
Good |
31 |
|
F7 |
0.5 |
0.566 |
0.710 |
1.23 |
19.54 |
Fair |
37 |
|
F8 |
1 |
0.586 |
0.725 |
1.24 |
19.49 |
Fair |
38 |
|
F9 |
1.5 |
0.616 |
0.729 |
1.19 |
15.64 |
Good |
32 |
Particle size Measurement of particle size involves the electromagnetic sieve shaking of the sample through the series of successively arranged sieves (Sieve No. 20, 30, 40, 60, 80, 100 and receiver) and weighing the portion of the sample retained on each sieve and calculation of same. (Ankit et al., 2011)
Table: Particle size analysis of formulation batches
|
Batch No. |
Sieve Number |
|
|||
20 |
40 |
60 |
80 |
||
|
F1 |
3.76 |
7.35 |
9.59 |
29.15 |
|
|
F2 |
4.39 |
8.65 |
12.56 |
31.88 |
|
|
F3 |
4.33 |
8.64 |
12.56 |
31.88 |
|
|
F4 |
5.38 |
10.76 |
15.12 |
32.43 |
|
|
F5 |
6.43 |
12.62 |
17.46 |
33.27 |
|
|
F6 |
6.41 |
12.56 |
16.46 |
28.55 |
|
|
F7 |
5.12 |
9.80 |
14.12 |
31.41 |
|
|
F8 |
4.22 |
8.5 |
12.56 |
30.92 |
|
|
F9 |
6.41 |
12.55 |
16.46 |
28.52 |
|
Result of optimized batches of Ibuprofen tablets (Devender et al., 2017)
Appearance
Tablets were examined for texture, any surface flaws like cracks and chips.
Result
Characteristic of batches were determined as per the procedure given in Experimental part and the results are illustrated in the table.
Table: Characteristics of Batches
|
Sr. No. |
Characteristic |
Observation |
||||
|
F1 |
F2 |
F3 |
F4 |
F5 |
||
|
1 |
Appearance |
White color, Caplet shape, smooth, free from cracks |
White color, Caplet shape, smooth, free from cracks |
White color, Caplet shape, smooth, free from cracks |
White color, Caplet shape, smooth, free from cracks |
White color, Caplet shape, smooth, free from cracks |
|
2 |
Color |
White |
white |
White |
White |
White |
|
3 |
Odor |
Odorless |
Odorless |
Odorless |
Odorless |
Odorless |
|
4 |
Taste |
Bitter |
Bitter |
Bitter |
Bitter |
Bitter |
|
5 |
Thickness |
5.6 mm |
5.8 mm |
5.9 mm |
5.5mm |
6.0 mm |
|
6 |
Dimensions |
27 mm |
26 mm |
29 mm |
26 mm |
28 mm |
|
Sr. No. |
Characteristic |
Observation |
|||
|
F6 |
F7 |
F8 |
F9 |
||
|
1 |
Appearance |
White color, Caplet shape, smooth, free from cracks |
White color, Caplet shape, smooth, free from cracks |
White color, Caplet shape, smooth, free from cracks |
White color, Caplet shape, smooth, free from cracks |
|
2 |
Color |
White |
white |
White |
White |
|
3 |
Odor |
Odorless |
Odorless |
Odorless |
Odorless |
|
4 |
Taste |
Bitter |
Bitter |
Bitter |
Bitter |
|
5 |
Thickness |
5.4 mm |
5.5 mm |
5.7 mm |
5.9 mm |
|
6 |
Dimensions |
27 mm |
26 mm |
28 mm |
26 mm |
NOW YOU CAN ALSO PUBLISH YOUR ARTICLE ONLINE.
SUBMIT YOUR ARTICLE/PROJECT AT editor-in-chief@pharmatutor.org
Subscribe to Pharmatutor Alerts by Email
FIND OUT MORE ARTICLES AT OUR DATABASE
Tablet thickness
Thickness and diameter of tablets were important for uniformity of tablet size. If tablet has no much variation in thickness in each formulation, is indicate that powder blends are consistent in particle size and uniform behavior during compression process. Thickness were measured using Vernier caliper. Average values of tablet thickness are reported in Table. (Deepak et al., 2017)
Dimensions
Dimensions such as thickness of the tablets were measured using digital Vernier caliper.
Weight variation (Devender et al., 2017)
20 tablets of each formulation batch were weighed individually using an electronic balance. The average weight was calculated and individual tablet weight was then compared with average value and the deviation was recorded. (Deepak et al., 2017)
Friability
Weight of 10 tablets of each formulation type was recorded and these tablets were then subjected to combined effects of abrasion and shocks in a plastic chamber that revolved at 25 rpm for 4 min (100 revolutions) to make the impact from a height of six inches with each revolution. Test was carried out for 100 revolutions. (Lachman et al., 1990) The tablets were then deducted and weighed again and percent friability was calculated by the following formula.
% F = (Wo – W) / Wo x 100
Where, F = friability
Wo = initial weight of the ten tablets
W = final weight of the ten tablet
Disintegration time (in vitro)
The disintegration time was determined by using USP tablet disintegration test apparatus using 900 ml of deionised water without disk. For this, 6 tablets of each formulation were used and the disintegration test was conducted at following test conditions. (Nidhi et al., 2014)
1. Apparatus : Disintegration test apparatus
2. Disintegration medium : Distilled water
3. Frequency of rising and lowering of basket rack assembly: 28 to 32 cycles.
4. Temperature of medium : 37±2oC
5. End point: No residue of the tablet left on the screen of the apparatus except soft mass with no palpably hard core.
The individual tablets were placed in each tube and the test carried out. The time required for complete disintegration of tablet was noted.
Hardness (Devender et al., 2017)
From each dispersible formulation 3 tablets were selected randomly. Monsanto hardness tester was used to check the hardness. Individual tablet was held along its axis between two jaws of the tester and scale was adjusted to zero. A constant force was then applied by rotating the knob until the tablet was fractured. Hardness was noted in kg/cm2. (Deepak et al., 2017)
Drug content (Devender et al., 2017)
Two tablets of each formulation were used. The tablets were weighed and crushed. A quantity of powder equivalent to 650 mg of Ibuprofen was accurately weighed and transferred to 100 ml volumetric flask to which small volume of Phosphate buffer pH 7.2 was added to disperse the contents. Final volume was adjusted to 100 ml using Phosphate buffer 7.2. The dispersion was stirred for 2 hr using magnetic stirrer and then allowed to settle. Solution was filtered through Whatman filter paper (No.41). Appropriate dilution of filtrate was made using Phosphate buffer pH 7.2 and the UV absorbance was recorded. (Deepak et al., 2017)
Drug release study (in-vitro)
Drug release of Ibuprofen in phosphate buffer pH 7.2 (Devender et al., 2017)
The drug release of Ibuprofen from tablets was estimated using dissolution test carried out as under.
Dissolution test parameters
Dissolution test apparatus : USP XXII type II (paddle)
Dissolution medium : phosphate buffer 7.2
Temperature of medium : 37 ±0.5oC
Speed of rotating paddle : 50 rpm
Sampling volume : 5 ml
The tablets of Ibuprofen were placed in dissolution medium and the apparatus was run. Aliquots of solutions were withdrawn at predetermined intervals and were replaced with same volume of dissolution medium at each withdrawal. The aliquots were filtered through whatman filter paper (No.41) and diluted appropriately before recording the absorbance at previously reported λmax value. (Nidhi et al., 2014)
|
Std |
Run |
Factor 1 Conc. of SSG % |
Factor 2 Conc. of Povidone % |
Weight veriation |
Hardness |
Disintegration time |
Friability |
Response 1 Disintegration time Sec. |
Response 2 Drug release % |
|
9 |
1 |
+1.00 |
+1.00 |
0.651±5 |
112 |
65 |
0.2 |
55±4 |
70.00±0.63 |
|
3 |
2 |
+1.00 |
-1.00 |
0.652±5 |
112 |
72 |
0.1 |
30±3 |
98.00±1.60 |
|
5 |
3 |
0.00 |
0.00 |
0.646±5 |
92 |
79 |
0.3 |
40±3 |
86.00±0.96 |
|
7 |
4 |
-1.00 |
+1.00 |
0.655±5 |
86 |
65 |
0.3 |
45±5 |
80.00±0.95 |
|
1 |
5 |
-1.00 |
-1.00 |
0.658±5 |
72 |
63 |
0.4 |
40±4 |
87.00±0.64 |
|
4 |
6 |
-1.00 |
0.00 |
0.650±5 |
69 |
69 |
0.3 |
42±5 |
82.00±0.78 |
|
2 |
7 |
0.00 |
-1.00 |
0.652±5 |
48 |
78 |
0.2 |
30±5 |
95.00±0.96 |
|
6 |
8 |
+1.00 |
0.00 |
0.641±5 |
50 |
71 |
0.4 |
50±4 |
75.00±0.86 |
|
8 |
9 |
0.00 |
+1.00 |
0.645±5 |
72 |
65 |
0.3 |
40±3 |
85.00±1.92 |
(+1) = higher values, (0) = middle values, (-1) = lower values
R1 = % entrapment efficiency
R2 = % floating ability
R3 = % Drug release (after 8 hr). Mean ±S.D. n=3
|
Batch No. |
Time (min) |
|||
|
0 |
5 |
10 |
15 |
|
|
F1 |
0 |
45.60 |
60.80 |
70.00 |
|
F2 |
0 |
45.90 |
82.60 |
98.00 |
|
F3 |
0 |
43.60 |
78.60 |
86.00 |
|
F4 |
0 |
42.30 |
60.30 |
80.00 |
|
F5 |
0 |
42.60 |
58.30 |
87.00 |
|
F6 |
0 |
42.80 |
60.30 |
82.00 |
|
F7 |
0 |
41.60 |
48.63 |
95.00 |
|
F8 |
0 |
40.50 |
57.60 |
75.00 |
|
F9 |
0 |
36.30 |
62.30 |
85.00 |
In- vitro % cumulative drug release from Ibuprofen tablets 650mg
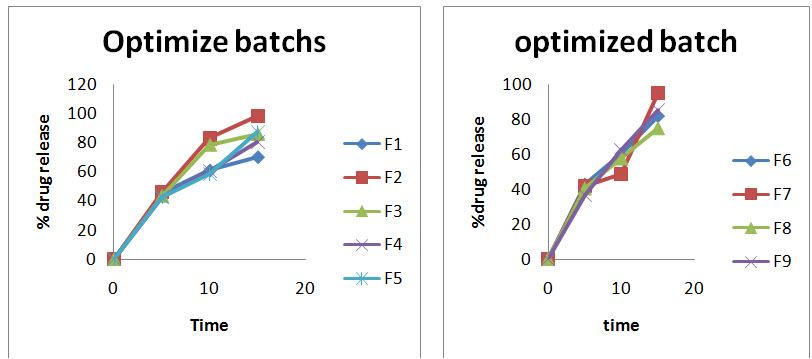
X-axis represent the time (h) and Y-axis represent the cumulative drug release (%).
Evaluation of dependent variables and mathematically modeling
Mathematically relationship generated using MLRA for the studied response variables are expressed in equation 1 to 3.
Disintegration time (Y1) = 85.44-1.00X1-7.50X2-5.25X1X2-6.67X12+4.83X22………… 1
% Drug release (Y2) = 39.33+1.33X1+6.67X2+5.00X1X2+7.00X12-4.00 X22…..…. 2
Significant value (Probe value)
|
Significant value (Probe value) |
|
|
Disintegration time |
0.0439 |
|
% Drug release |
0.0482 |
All probe value showed significant values less than 0.0500 and hence they were retained in full model. Significant summary for ANOVA for the response parameter
|
Source |
Sum of squares |
d.f. |
Mean square |
F- value |
p- value probe > F |
|
For disintegration time (seconds) |
|
|
|
|
|
|
Model |
507.33 |
5 |
101.47 |
9.93 |
0.0439(S) |
|
X1 |
10.67 |
1 |
10.67 |
1.04 |
0.3822(S) |
|
X2 |
266.67 |
1 |
266.67 |
26.09 |
0.0145(S) |
|
X1 X2 |
100 |
1 |
100 |
9.76 |
0.0522(S) |
|
X12 |
98 |
1 |
98 |
9.59 |
0.0535(S) |
|
X22 |
32 |
1 |
32 |
3.13 |
0.1750(S) |
|
For release (%) |
|
|
|
|
|
|
Model |
589.36 |
5 |
117.87 |
9.26 |
0.0482(S) |
|
X1 |
6 |
1 |
6 |
0.47 |
0.5417(NS) |
|
X2 |
337.50 |
1 |
337.50 |
26.51 |
0.0142(S) |
|
X1 X2 |
110.25 |
1 |
110.25 |
8.66 |
0.0604(S) |
|
X12 |
88.89 |
1 |
88.89 |
6.98 |
0.0775(S) |
|
X22 |
46.72 |
1 |
46.72 |
3.67 |
0.1513(S) |
X1, X2 represent ethyl cellulose, HPMC K 15, respectively X1 X2, X12, and X22 are the interaction effects. *S. indicates significant. * D.F. indicates degree of freedom
For the Disintegration time, %Drug release calculated F-values are 9.93 and 9.26 respectively as shown in above table. Hence it can be concluded that the variables selected contributes significantly in the regression of measured responses Y1 and Y2.
From equation 1 it can be concluded that positive coefficient of both X1 and X2 indicated increase in disintegration time (Y1) of tablets with increase in the SSG and Povidone concentration. When the both variables at high level their interactive effect were significant.
For % drug release equation 2 was obtained from design model. Positive coefficient of both X1 and X2 (increase in SSG and Povidone concentration) indicated increase in % drug release of the tablets. These effects can be further explained by response plots and contour plots generated using equation 1, 2 and 3. The response and contour plots are shown in fig.
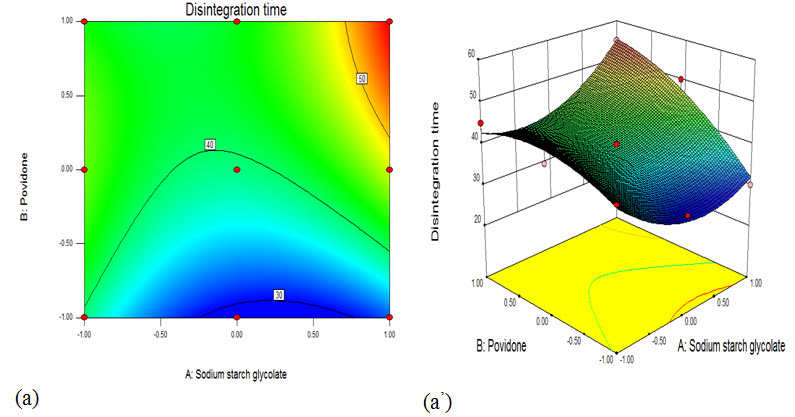
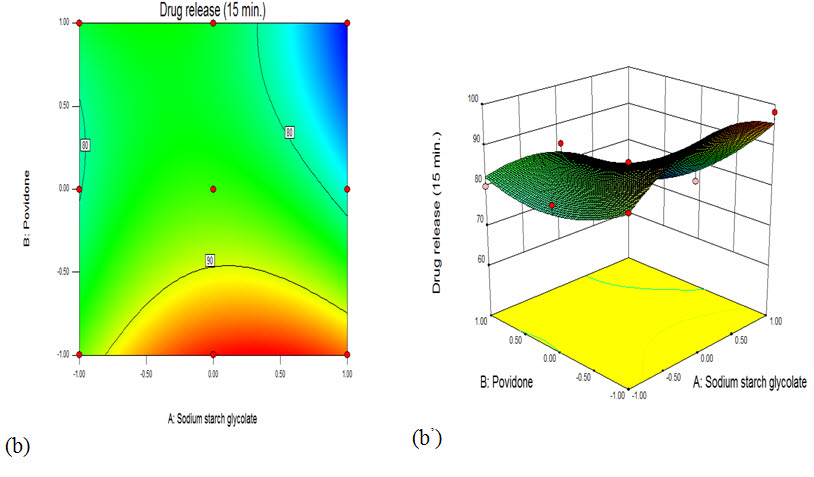
Fig. a: Showing contour plot showing the effect of water concentration and lactose DC concentration on disintegration time
Fig. a’: Showing contour plot showing the effect of water concentration and lactose DC concentration on drug release
Fig. b: Showing surface response plot showing the effect of water concentration and lactose DC concentration on disintegration time
Fig. b’: Showing surface response plot showing the effect of water concentration and lactose DC concentration on drug release
NOW YOU CAN ALSO PUBLISH YOUR ARTICLE ONLINE.
SUBMIT YOUR ARTICLE/PROJECT AT editor-in-chief@pharmatutor.org
Subscribe to Pharmatutor Alerts by Email
FIND OUT MORE ARTICLES AT OUR DATABASE
Fig: Various plots showing influence of (X1) and (X2) on the disintegration time (a) Contour plot (a1) Response surface plot, % drug release (b) Contour plot (b1) Response surface plot
The response surface plot (7.8 a) and contour plot (7.8 a1) indicated the relatively increased in disintegration time with increased in SSG and Povidone concentration. With increase in SSG and Povidone concentration distingredient time was increased and this can be confirmed from equation 1. At different levels (-1, 0, 1) of SSG and Povidone concentration was increased, the disintegration time of tablets was increased. The surface response plot (b) and contour plot (b1) showed increase in response (Y2)% drug release as SSG and Povidone concentration was increased from lower to higher level. This may be due to the higher drug release of tablets as SSG level increases. (Thejaswini et al., 2013)
Search for optimum formulation of Ibuprofen 650mg tablets
The results for the feasibility to find the suitable region for further location of optimum formulation are presented in table the criteria for selection of suitable feasible region was primarily based upon the value of Disintegration time, % drug release. (Thejaswini et al., 2013)
One formulation was selected on the basis of the following criteria.
Table: Criteria for formulation
|
Sr.No. |
Response |
Region |
|
1 |
Disintegration time |
30-55 Sec. |
|
2 |
% Drug release |
70-98% |
Desirability and overlay plot for searching optimum formulation of Ibuprofen 650mg tablet
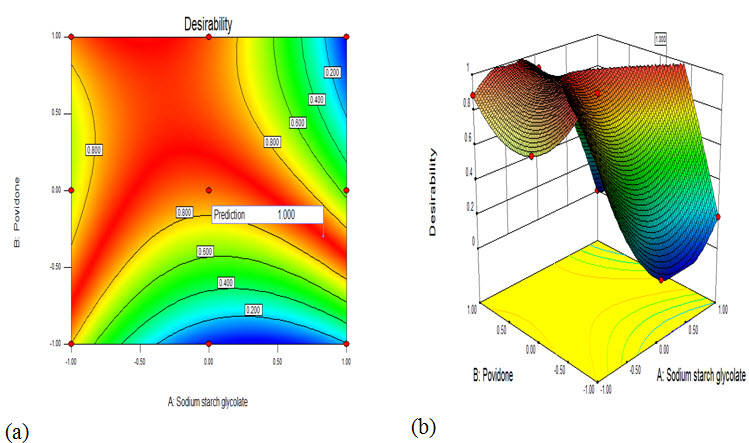
Fig: Desirability (a) overlay plot (b) contour plot for searching optimum formulation
From the results of the exhaustive grid searches, integrated search was performed for (F-F9). Compositions of optimized batch are summarized in Table.
|
Sr. No. |
Factor |
Optimized ratio |
Calculated quantity |
|
1 |
X1 |
0.83 |
18.5 g |
|
2 |
X2 |
-0.30 |
5.184 g |
Table: Result of experiments for conforming optimization capability
|
Batch |
Composition |
Response |
Predicted value |
Actual value |
% Error |
|
|
X1 |
X2 |
|||||
|
Optimized batch |
0.83 |
-0.30 |
Disintegration time (seconds) |
41.67 |
42 |
0.31 |
|
Drug release (%) |
83.99 |
85.60 |
0.071 |
|||
Table : Cumulative percent drug release from optimized batch
|
Sr. No. |
Optimized batch |
|
0 |
0 |
|
1 |
54.50±0.78 |
|
2 |
70.17±0.64 |
|
3 |
85.60±1.24 |
*All values are expressed as mean ± SD, n=3
Fig: Cumulative percent drug release
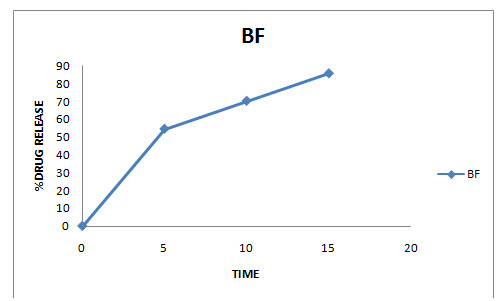
X-axis represent the time (h) and Y-axis represent the cumulative drug release (%).
Stability study
Table: Disintegration, % drug content, % drug release of optimized batch
|
Days |
Disintegration |
% drug content |
% drug release after 15min. |
|---|---|---|---|
|
0 day |
42 sec. |
99.83 ± 1.24 |
85.60±1.01 |
|
15 day |
42 sec. |
99.31± 0.79 |
85.30±0.51 |
|
30 day |
42 sec. |
99.47±0.17 |
85.20±0.77 |
|
60 day |
43 sec |
99.50±0.05 |
85.20±0.60 |
Stability study of optimize batch
The optimum batch tablets were stored at 40 0C±2 0C / 75±5% RH for three months in environmental control chamber.
Method: Tablets were wrapped using aluminium foil and put at above specified condition in environmental control chamber for 3 month. From the tablets so stored, samples were drawn at intervals of one month during 3 month, and were evaluated for visual appearance, hardness, weight variation, drug content, friability and drug release.
Table: Physical parameters of tablet under accelerated stability study
|
Parameters |
I 0 day |
II 30 days |
III 60 days |
IV 90 days |
|---|---|---|---|---|
|
Appearance |
White |
White |
White |
White |
|
Average weight (mg) |
650.13 |
650.56 |
650.65 |
650.75 |
|
Weight variation |
Passed |
Passed |
Passed |
Passed |
|
Friability |
Passed |
Passed |
Passed |
Passed |
|
Disintegration time (second) |
60 |
65 |
65 |
67 |
|
Moisture content |
1.88 |
1.99 |
2.05 |
2.05 |
|
Drug content |
99.89 |
99.34 |
99.08 |
98.84 |
|
Hardness (kg/cm2) |
11.00 |
10.56 |
10.11 |
10.02 |
NOW YOU CAN ALSO PUBLISH YOUR ARTICLE ONLINE.
SUBMIT YOUR ARTICLE/PROJECT AT editor-in-chief@pharmatutor.org
Subscribe to Pharmatutor Alerts by Email
FIND OUT MORE ARTICLES AT OUR DATABASE
X-ray diffraction
Dissolution properties of drug particles are affected greatly by nature and extent of crystallinity present in them. An amorphous or the metastable form dissolves faster because of the associated higher levels of internal energy and greater molecular mobility. These together enhance the thermodynamic properties of these forms as compared to crystalline state.
X-ray scattering measurements on Ibuprofen was carried out at a voltage of 40 kV and current of 25 mA using Cr as a tube anode material. The solid were exposed to Cu –K radiation angles from 10°-70°.
Powder X-ray diffraction study reveals information about the crystallographic features and composition of materials. This technique is based on observing the scattered intensity of an X-ray beam hitting a sample as a function of incident and scattered angle, polarization and wavelength or energy. X-ray diffraction yields the atomic structure of materials and is based on the elastic scattering of X-rays from the electron clouds of the individual atoms in the system. XRD study is the prerequisite for any formulation development to know whether any changes in crystallinity of ingredients in the formulation has occurred Optimized tablet of batch was subjected to XRD study by using X-ray diffractometer (Philips X-ray diffractometer, PW-3710). For this the samples of pure drug, optimized were irradiated with monochromatised CuKα radiation and analyzed.
X-ray diffraction pattern of Ibuprofen was studied as per the Procedure given in section and spectrum is depicted in Fig.

Fig: X- ray diffraction spectrum of Ibuprofen
Result
The analysis of XRD pattern reveals sharp intensity of the crystallinity peaks of the pure drug, but when it was incorporated into the excipients the intensities of the peaks were decreased due to decreased crystallinity of the drug. The formulation containing MCC and Lactose DC showed maximum amorphisity. XRD analysis showed that there was little reduction in the crystallinity of drug when formulate these polymers
Differential Scanning Calorimetry
Differential Scanning Calorimeter (DSC) technique helps to detect crystallization, degradation, phase transformation, glass transition temperatures in solid sample. Thermo grams of pure drug, excipients and formulation were obtained using DSC equipped with an intercooler. Platinum crucible used with alpha alumina powder as reference to calibrate the DSC temperature and enthalpy scale. The powder sample was hermetically kept in the aluminum pan and heated at constant rate 10°C per min, over a temperature range of 35°C to 250°C. Inert atmosphere was maintained by purging nitrogen at the flow rate of 150 ml/min.
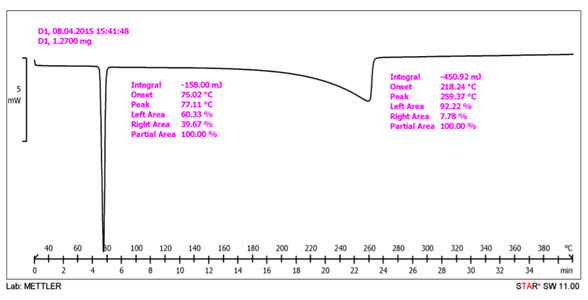
Fig: DSC formulation graph
Result
The thermo gram of pure Ibuprofen showed sharp endothermic with melting peak at 77.31ºC. Thermo gram of In optimized formulation showed peak at 77.11 ºC. Slight shift in of endothermic peaks on left hand with decreased in its intensity indicates little amorphization of drug shown in Figure.
This may attributed to presence of moisture which may cause drug in crystallization form and hence reduces drug dissolution which may results in decreased release of Ibuprofen FTIR
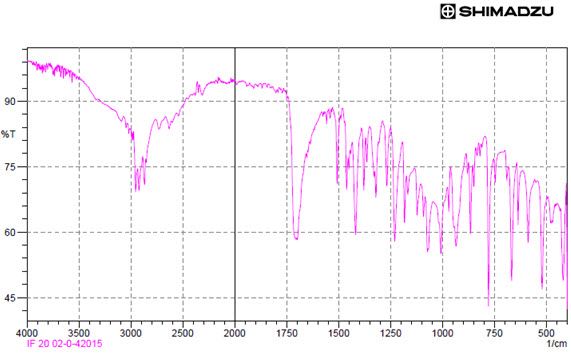
Fig: FTIR formulation graph
Result
FTIR spectrum of Ibuprofen showed peaks at 945.94 due to O-H bending, 1258.72 due to C-O stretching, 1378.69 due to CH2 and CH3,1417.65 due to Ar C-C stretching and 1700.98 due to C=O stretching. The optimize formulation showed more intense and prominent peaks.
SEM Analysis
Scanning electron microscopy was performed to study the effect of mixing time on the morphology of particles. Figure 4shows the scanning electron micrograph of initial blend of PCM and binders. A mixture of particles is seen with varying sizes and shapes. It is clearly visible that all the particles exist independently and this explains poor flow properties of this blend. Figure 5 shows the scanning electron micrograph of blend after addition of required quantity of moisture and mixing for 10 min. It can be seen that moisture makes particles to come together and cohesive forces between particles increased.
Figure shows the micrograph after 20 min of mixing and this stage is characterized by the disappearance of fine particles. Agglomerates are seen in this micrograph. Figure 7 is the SEM image of blend after mixing for 30 min. A total absence of fine particles is seen in this image and more number of agglomerates was seen. Figure 8 shows the micrograph of blend after addition of moisture absorbents. No major change in the particle size and morphology is seen at this stage. It suggests that added moisture adsorbents adhere onto the existing particles and help in improving flow properties of the granules
Result
Scanning electron microscopy was performed to study the effect of mixing time on the morphology of particles. Figure shows the scanning electron micrograph of initial blend of Ibuprofen and binders.
Result was determine as per procedure and SEM of drug, placebo and formulation show following
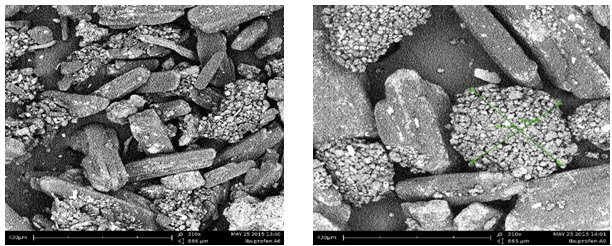
C:Batch F4
Fig: SEM formulation and placebo graph
DISCUSSION
Rheumatoid arthritis, osteorthritis and other musculoskeletal major disorders in India. Ibuprofen has a local action in large intestine as it is used in the treatment of Rheumatoid arthritis, osteorthritis and other musculoskeletal disorder. Ibuprofen primarily absorbed from lower part of gastrointestinal tract. The main objective of the study was to formulation, evaluation and optimization of tablets containing poorly water soluble drug by moisture activated dry granulation method, thereby reducing the production cost of tablet.
Appearance, melting points, loss on drying, λmax, IR study and DSC study of drug Ibuprofen were carryout as per the specification of B.P. It was observed that the obtained sample of Ibuprofen complies with the standard of quality mentioned in B.P. Standard calibration curve of Ibuprofen (absorbance Vs concentration) was found to be linear and obeyed Beer Lambert’s law in the range of 0-10µg/ml. SSG and povidone were evaluated for their standard. It was observed that they complies with the standard of quality as per prescribe official books.
Preliminary batches of Ibuprofen tablets were prepared by moisture activated dry granulation method using sodium starch glycolate as Superdisintegrant and povidone as binder polymer in various concentrations. From the results of preliminary batches, it was observed that polymer concentration is important parameter in the formulation of tablets.
As the SSG concentration was increased from 12 mg to 20 mg, and concentration of povidone were increased from 10 mg to 16 mg disintegration time , % drug release from tablets were increased.
The disintegration time was decreased with the decrease in the quantity of sodium starch glycolate in tablets by moisture activated dry granulation process. Improvement in formulation and development was carried out by optimization technique with the help of factorial design. Factorial design was applied to design the experiments. On the basis Preliminary trials, concentration of SSG and povidone were used as independent variables. Where disintegration time and % drug release after 15 minutes, were kept as dependent variables. Formulations F1 to F9 were prepared using SSG and povidone concentration at three different levels.
From the evaluation study, it was observed that, as the concentration of povidone was increased, more uniform granules were observed.
When the concentration of SSG was increased, and povidone concentration was increased, disintegration time was increased (55 seconds). At the medium level of SSG and low level of povidone (Batch F7), the disintegration time of tablets was at minimum (30 seconds).
At high level of SSG and high level of povidone (batch F1), % drug release was decreased because the drug was properly bound with the polymer (povidone). When concentration of both polymers was kept at low level (Batch F5), then the % drug release was increased.
The formulation was further optimized using design expert software by feeding predicted values for responses like disintegration time (R1) to 41.67, % drug release (R2) to 83.99 and actual values were generated for responses [R1, R2 (42, 85.60)] for SSG (XI) and povidone (X2) to 2.8% and 0.7% respectively for confirming capability of optimized batch.
From DSC study, it was observed that there was no interaction between drug Ibuprofen, and polymers SSG and povidone, so optimized batch was formulated in Tablet dosage form. From the above study, Ibuprofen tablets were formulated by MADG process giving better results than the conventional wet granulation process for tablets.
SUMMARY
The main objective of the study was to develop, evaluate and optimization of tablets containing poorly water soluble drug by moisture activated dry granulation method, thereby reducing the production cost of tablet. Further objective of the study was to evaluate tablets for formulation and processing variable. Optimization of formulation variable of Ibuprofen tablet was carried out using 32 factorial designs. Two independent variables X1(concentration of SSG) and X2 (concentration of Povidone) were selected. Tablets were prepared and different responses disintegration time (Y1) and drug release (Y2) were measured for each trial. The results of dependent variables (Responses) like Disintegration time and % drug release after 15 minutes from nine experiments were used to generate polynomial equation from ‘Design Expert’ software. Mathematical relationship generated using MLRA (Multiple linear regression analysis) for studied response variables were expressed in equation for each response. From polynomial equation obtained, the grid searches were performed and subsequent feasibility integrated searches were performed. The surface response and contour plot were drawn to facilitate an understanding of the contribution of the variables and their interaction.
The studies carried out can be summarized as follows:
1. Tablets were prepared by using biodegradable polymer Sodium starch glycolate and povidone with Ibuprofen.
2. FTIR revealed that there is no exists chemical interaction between the drug and polymers. DSC studies also indicated that, there was no degradation of Ibuprofen.
3. The response surface plot and contour plot indicated that SSG and povidone ratio had significant impact on drug release. The Drug release was found to be increased from 75.0-98.0% as the SSG and povidone ratio increased. As the SSG level increases thus drug release also increased.
4. Disintegration time of tablets was influenced by the response surface plot and contour plot indicate that as the SSG and povidone ratio increased disintegration time also increased from 30-55 seconds.
5. The result of a 32 full factorial design revealed that the SSG (X1) and Povidone (X2) ratio significantly affected the dependent variables such as disintegration time and drug release of tablets.
6. Evaluation of optimized formulation, chosen as optimal from grid searches, indicated that the formulation fulfilled maximum requisites because of better disintegration time and drug release of tablets.
7. Stability studies of the optimized formulation revealed that formulation was able to retain its stability.
CONCLUSION
Ibuprofen tablets were successfully developed using moisture activated dry granulation method with the help of 32 factorial designs. Concentration of sodium starch glycolate 2.8% and concentration of povidone 0.8 % was taken then resultant tablets were given drug release (85.60±0.36) in 15 minutes. The in-vitro results indicated that the tablets were potentially useful. The moisture activated dry granulation method was found to be simple, reproducible, easily controllable, economical, and continues process. Additionally, the excipients used for the formulation of tablets were cheap and easily available. Other drugs for the use in moisture activated dry granulation method can be incorporated in the formulation of tablets. Therefore, these types of moisture activated dry granulation method for tablets can be commercially processed easily and potentially better other than wet granulation method for formulation of tablets.
REFERENCES
1. Ankit Sharma, Pooja sethi, Dinesh pawar. “Granulation techniques and innovations”, Inventi Rapid: Pharmtech, Vol.10, 2011.
2. Devender Sharma, Ameya lanjewar, M.D.Godbole and Susil Burle research article on “Formulation and evaluation on water poorly soluble drug tablets by MADG method” , WJPR; 2017.
3. Deepak Kashyap, S.L.Kokhra, Shalini Sharma, “Development of enteric coated tablets of ibuprofen using methacrylic acid copolymer, international journal of institutional pharmacy and life science, 2(1):2249-6807,2017.
4. Devender M. Sharma, Satish B. Kosalge, Swati N. Lade. “Review on Moisture Activated Dry Granulation Process”, accepted on Sept, 2017 and will be publishing pharmatutor magazine, vol.6(1), Jan,2018.
5. Lachman L, Lieberman HA, Joseph LK. The Theory and Practice of Industrial Pharmacy, 1990; Third Edition, P. 317-324.
6. Nidhi Prakash Sapkal, Vaishali A. Kilor, Minal Nandkumar Bonde. Application of a convenient and cost and effective granulation technology for the formulation of tablets using conventional excipients, Asian Journal of Pharmaceutics - July-September 2014, October 01, 2014; 223.30: 225.254.
7. P. Thejaswini, B. Suguna, N. Sumalatha, Advance granulation techniques for pharamceutical pharmulations, International journal of research in pharmaceutical and nano sciences, 2(6), 723-732,2013.
NOW YOU CAN ALSO PUBLISH YOUR ARTICLE ONLINE.
SUBMIT YOUR ARTICLE/PROJECT AT editor-in-chief@pharmatutor.org
Subscribe to Pharmatutor Alerts by Email
FIND OUT MORE ARTICLES AT OUR DATABASE