

{ DOWNLOAD AS PDF }
ABOUT AUTHORS
Ranjitha B1, Dinesh Bhaskar1, Balasubramanian Sathyamurthy2
1 Department of Biochemistry,
Reva Institute of Science and Management, Bangalore, Karnataka, India
2 Department of Biochemistry,
Ramaiah College of Arts, Science and Commerce, Bangalore, Karnataka, India
ABSTRACT:
The leaves of Terminalia Arjuna are commonly known as Arjuna. It is used as traditional medicinal plant distributed throughout the greater part of the Indian Peninsula along rivers and found in Sub-Himalayan tract, Chota Nagpur, Orissa, West Bengal, Punjab, Deccan and Konkan it has many medicinal properties like anti bacteria, anti inflammatory and used for the treatment of Asthama, Bronchities. These leaf extracts are found to have antioxidant, anticancer and antidiabetic activities. Out of many constituents arjunolic acid is the active principle which is responsible for antidiabetic effects. The present work was aimed to study the effect of Terminalia arjuna. Methanolic extracts on adipocyte 3T3-L1cell line and found the phytochemical compounds of Terminalia arjunaleaves have more inhibitory scavenging and more antidiabetic activities
[adsense:336x280:8701650588]
Reference Id: PHARMATUTOR-ART-2600
|
PharmaTutor (Print-ISSN: 2394 - 6679; e-ISSN: 2347 - 7881) Volume 6, Issue 8 Received On: 27/06/2018; Accepted On: 10/07/2018; Published On: 01/08/2018 How to cite this article: Sathyamurthy, B., Ranjitha, B. and Bhaskar, D. 2018. Invitro studies on the effect of Terminalia Arjuna in Adipocyte 3T3 - L1 Cell Lines. PharmaTutor. 6, 8 (Aug. 2018), 17-26. DOI:https://doi.org/10.29161/PT.v6.i8.2018.17 |
INTRODUCTION:
Human beings and their ancestors have always been affected by diseases. Even as early as 5,000 years ago, human beings were aware of the medicinal properties of plants and observed that a number of important modern pharmaceuticals have been derived from, or are plants used by indigenous people. The advent of modern allopathic and ayurvedic medicine turned attention of scientists increasingly from plant sources to synthetic preparations as the basis for modern drugs. However, the side-effects of many modern drugs along with the development of drug-resistant organisms have brought back into focus ethnomedicinal studies (Kumar et al., 2002).
Diabetes mellitus is a major endocrine disorder affecting more than 10% population in the contemporary world. India has the dubious distinction of having the largest number of people with diabetes. Its occurrence in more affluent societies is spectacular and of general concern
Diabetes mellitus (DM) is a common and epidemic disease affecting the people of both the developed and developing countries. DM is caused by the abnormality or dysfunction of carbohydrate metabolism. The food we eat is broken into simple sugar called glucose. Glucose is the main source to get energy for the body. After digestion, it reaches our blood stream and the body cells utilize it for energy. Insulin is very essential for the glucose uptake into the cells. Insulin is a hormone secreted by the pancreas. If the pancreas does not produce enough insulin, glucose get into the body cells so, glucose stays in the blood. This makes the blood as hyperglycemic condition and symptoms include Fatigue or severe weakness, abnormal thirst, Irritability, Unexplained weight loss, increased hunger, recurrent infections, blurred vision, increased urination and nocturia. In normal individuals, the liver acts a storehouse of carbohydrates and releases glucose whenever the need arises. The pancreas produces insulin, which circulates in the blood and allows the entry of sugar in the cells. It also helps lowering the blood sugar levels. In case of prediabetic patients, the pancreas does not produce enough insulin leading to increased levels of sugar in the blood up to 100-125 mg/dl. Nowadays, Diabetes is ‘killer’ of mankind when compared to the disease like cancer and cardiovascular disease. In India, the number of adults suffering from diabetes is expected to increase in threefold from 19.4 million in 1995 to 57.2 million in 2025. The three main important classical symptoms of diabetic conditions are, polyuria (frequent urination), polydipsia (increased thirst), and polyphagia (increased hunger). Diabetes may be categorized into many types but the two major types are type 1 and type 2. On the basis of etiology, the term type 1 and type 2 were widely used to describe IDDM and NIDDM, respectively; other specific types of diabetes and gestational diabetes (Green et al., 1976).
On the basis of etiology, type 1 diabetes is present in patients who have little or absence of endogenous insulin secretory capacity and who therefore require insulin therapy for survival. The two main forms of clinical type 1 diabetes are type 1a which is thought to be due to immunological destruction of pancreatic ß cells resulting in insulin deficiency; and type 1b (idiopathic, about 10% of type 1 diabetes), in which there is no evidence of autoimmunity. Type 1a is characterized by the presence of islet cell antibody (ICA), anti-glutamic acid decarboxylate (anti-GAD), IA-2 or insulin antibodies that identify the autoimmune process with ß-cell destruction. Autoimmune diseases like Grave’s disease, Hashimoto’s thyroiditis and Addison’s disease may be associated with type 1 diabetes mellitus. There is no known etiological basis for type 1b diabetes mellitus. Some of these patients have permanent insulinopaenia and are prone to ketoacidosis, but have no evidence of autoimmunity. This form is more prevalent among individuals of African and Asian Origin. Type2 diabetes also called non-insulin-dependent diabetes mellitus (NIDDM). Type 2 diabetes may account for about 80 percent to 90 percent of all diagnosed cases of diabetes. Risk factors may include older age, obesity, family history of diabetes, gestational diabetes, impaired glucose tolerance, physical inactivity, and race.
Gestational Diabetes (GD) mellitus refers to the onset or initial recognition of glucose intolerance during pregnancy, usually in the second or third trimester. It occurs in about 4% of all pregnancies. Patients with GD have a 30% to 50% chance of developing DM, usually type 2 DM (Kumar et al., 2002).
3T3-L1 Mouse Cell Line:
Organism : Murine Swiss (mouse)
Tissue : Adipocyte
Disease : Related to obesity
Age : 19 Days old embryo
Gender :Female
Morphology : Fibroblast
Growth Properties : Adherent
The 3T3-L1 cell line is a preadipose cell line that was developed from murine Swiss 3T3 cells. The 3T3-L1 cells are derived from disaggregated 17- to 19-day-old Swiss 3T3mouse embryos, which display a fibroblast-like morphology that, under appropriate conditions, can acquire an adipocyte – like phenotype. Indeed, close to a third of the published articles in the last five years have described the use of 3T3-L1 cells for the study of adipogenesis and obesity-related characteristics (Green et al., 1976). Generally 3T3-L1 fibroblast phenotype cells wear treat with adipogenic agents, such as insulin, dexamethasone (DEX), and 3-isobutyl-1-methylxanthine (IBMX), to convert to adipocytes, it is necessary to which elevates the intracellular cAMP levels in the presence of fetal bovine serum (FBS), at concentrations of 1µg/ml, 0.25 µM, and 0.5 mM, respectively. 3T3-L1 cells can be differentiating within 10 to 12 days. Differentiation of 3T3-L1 preadipocytes can be influenced in a short time using a combination of DEX and troglitazone after few days compared to the combination of IBMX and DEX with the standard protocol. Moreover, by using DEX and troglitazone, the lipid droplet accumulation increased by 112%, and glucose transporter 4 (GLUT4) mediated a 137% higher glucose uptake compared to cells that were differentiated using the traditional method (Vishwanath et al., 2013)
One of the main advantages of this cell line is that it is easier to culture and less costly to use than freshly isolated cells, such as mature adipocytes, even though freshly isolated cells allow for various comparisons, such as the in vitro evaluation of different in vivo conditions. Moreover, they can tolerate an increased number of passages and are homogeneous in terms of the cell population. Therefore, these cells provide a homogenous response following treatments and changes in experimental conditions (Poulos et al., 2010). Because of this, 3T3-L1 cells have been extensively over the last five years to evaluate the effects of compounds or nutrients on adipogenesis, to establish the underlying molecular mechanisms of adipogenesis and to evaluate the potential application of various compounds and nutrients in the treatment of obesity. Particularly, compounds such as quercetin and resveratrol inhibit adipogenesis in 3T3-L1 adipocytes and also these cells have been used to describe the effect of melatonin, reactive oxygen species (ROS), or antioxidants on adipogenic differentiation and also, the role of some androgens such as testosterone that inhibit the adipogenic differentiation by activation of androgen receptor/β-catenin/T-cell factor 4 interaction in 3T3-L1 adipocytes. Apart from that, 3T3-L1 cells have been useful to study the mechanisms of action during the differentiation process of several compounds or nutrients (Chang et al., 2016). Finally, this cell line is useful in the study of co-cultures and three-dimensional cell cultures, as well as diverse studies of high-throughput screening of compounds. The 3T3-L1 model has several drawback such as the time of initial subculture, in addition to the fact that adipogenic differentiation requires at least 15 days. Moreover, when 3T3-L1 cells become confluent or they have been passaged extensively, they no longer differentiate into adipocytes; they are difficult to transfect; and because this cell line originated from a single clone,it fails to recapitulate the characteristics of primary cell culture models (Francisco Javier Ruiz-Ojeda et al., 2016).
Terminalia arjuna:
Terminalia Arjuna commonly known as Arjuna, Nearly 24 species of Terminalia have been reported from various parts of India and it is large evergreen tree distributed throughout the Indian Peninsula along rivers and found in Sub-Himalayan tract, Nagpur, Orissa, West Bengal, Punjab, Deccan and Konkan (Padmaa et al., 2010). The tree is about 60-80 feet height. Arjuna is large, evergreen with a spreading crown and dropping branches. In favorable localities and especially along the banks of streams, the tree attains very large sizes. Two trees of 26 feet and 32 feet in girth at 5 feet from the ground have been recorded in the village of Manipur in Jammu and Kashmir. Leaves are sub-opposite, oblong or elliptic, coriaceous, cordate, shortly acute or obtuse at the apex. Flowers are in panicled spikes. Fruits are ovoid or ovoid-oblong, 2.5 – 5.0 cm long, nearly glabrous, with 5 – 7 hard, winged angles. Stem bark is simple, grey and smooth on external surface. It is big, soft and of red color from inside and bitter in taste. Leaves are like oblong and 4-6 inch long and 2-3 inch wide, sub opposite, glabrous and often in equilateral. Two glands are present near the base of the petiole. The margin is crenulate with apex at obtuse or sub acute angle. The base is rounded or cordate. Petioles run for 0.5 to1.3 cm. Flowers are White or yellowish and found in groups. Flowering occurs in summer and fruit appears in winter or spring season. The fruits are 1 - 1.5 inch in diameter, with 5-7 longitudinal lobes. These are glabrous with 5-7 wings, woody and fibrous. Fruit is drupe and often notched near the top, marked with oblique upward curving striations (Sumitra et al., 2001). Chemical composition of the bark contains calcium carbonate 34%, other calcium salts 9% and tannin 16%. Besides, it also contains aluminium, magnesium, organic acid, colouring matter and sugar. Other active constituents of Terminalia Arjuna include arjunic acid, arjunolic acid, arjungenin, and arjunglycosides. arjunone, arjunolone, and luteolin, Gallic acid, ellagic acid, oligomeric proanthocyanidins (OPCs), phytosterols, zinc, and copper (Giri et al., 2012).
Role of Arjunolic Acid in diabetes:
Two enzymes, α-glucosidase and α-amylase, play a pivotal role (mainly in type 2 diabetes) in the reduction of excess dietary carbohydrate and formation of glucose from those molecules. Therefore, inhibition of these two enzymes could be helpful in the treatment of diabetic pathophysiology and its associated complications. In the case of two antioxidant molecules (curcumin and mangiferin), reported significant inhibitory action against these two carbohydrate-metabolizing enzymes whereas AA is not able to do so to a considerable extent. It has been reported that AA obtained from the leaves of Lagerstroemia speciosa attenuates the α-glucosidase to some extent but possesses insignificant inhibitory activity against α-amylase. Though this antioxidant molecule is unable to suppress the activity of mentioned two enzymes, a number of research studies suggest its protective action in diabetes. It can be depicted that the antidiabetic action of this component is attributed to its antioxidant activity (Khaliq et al., 2013). Protective role of amino acid on pancreatic tissue in STZ-induced type 1 diabetic rat model was described that, the intoxication of STZ leads to the formation of reactive oxygen and nitrogen species in the β-cell containing pancreatic tissue of the experimental group. Formation of excessive reactive species overwhelmed the intracellular antioxidant defense system and enhanced the peroxidation of membrane lipids as well as carbonylation of different proteins. Increased serum glucose and proinflammatory cytokine TNF-α were also found in the STZ-administered group. However, treatment with AA is able to ameliorate the condition by the efficient scavenging of free reactive species and reducing the expression of stress-induced MAPKs (phospho ERK1/2 and phospho p38), transcription factor NF-κB and regulating the molecules involved in mitochondrial-dependent apoptotic pathways (Manna et al., 2008). This group also demonstrated the efficacy of AA against STZ-induced spleen damage under hyperglycemic state. Most of the primary immune responses are initiated in the spleen and cytokine production by spleen cells is probably considered as one of the reasons for the β-cell destruction in type 1 diabetes. AA has been found to regulate the expression of different cytokines (IL-2, IFN-γ, and TNF-α) and maintain intracellular redox environment to protect spleen from oxidative stress-induced inflammatory response-mediated damage. In addition, the histopathological study showed that AA ameliorates splenic white pulp (responsible for immunological function) and decreased red pulp to enhance the immune response in type 1 diabetes (Wang et al., 2007). Efficacy of AA against STZ-induced diabetic nephropathy was shown that the diabetic renal damage is associated with increased kidney weight to body weight ratio, glomerular area and volume, blood glucose level, serum creatinine level, and BUN. Alteration in kidney-related and other parameters indicates renal dysfunction that in turn increases the generation of reactive species, enhances oxidative stress-related markers, and reduces intracellular antioxidant defense in the renal tissue of diabetic group. Treatment with AA successfully ameliorates diabetes-induced oxidative stress-mediated renal damage by reducing oxidative as well as nitrosative stress and deactivating the polyol pathways of the kidney. The histological pattern showed multiple foci of hemorrhagic necrosis and cloudy swelling of tubules in the diabetic renal tissue. On treatment with AA amelioration of histopathological state was observed. This result suggests that AA could act as a protective agent against the renal oxidative stress-induced damage in diabetes (Manna et al., 2007)
NOW YOU CAN ALSO PUBLISH YOUR ARTICLE ONLINE.
SUBMIT YOUR ARTICLE/PROJECT AT editor-in-chief@pharmatutor.org
Subscribe to Pharmatutor Alerts by Email
FIND OUT MORE ARTICLES AT OUR DATABASE
MATERIALS AND METHODS:
Sample Collection:
Matured leaves wear collected in the Ghandhi Krushi Vignana Kendram (GKVK) Bangalore. The plant samples were collected and identified by an agriculturist in the GKVK. The samples were allowed to dry at room temperature under a shade. The dry samples were then crushed in fine powder and stored in tightly sealed polyethylene bags.
Extraction procedure: Plant leaves were washed thoroughly with distilled Water.The leaves were dried under shade at room temperature. The dried leaves of Terminalia Arjuna were finely grinded using electrical grinder and stored in air tight containers for further use. A total of 250 g of the pulverized plant material was extracted for 4 days in Methanol. The extracts were then filtered through Whatman’s No. 1 filter paper and then condensed to dryness using rotary evaporator. The thick extracted mass was then dried at room temperature (Hemant et al., 2002)
1. Phytochemical analysis:
Phytochemical analysis of Terminalia Arjuna extracts were done using the protocols described by; segelman et al for the following (Segelman et al., 1969).
Test for Sterols - Liebermann Burchard reaction
Tests for Alkaloids - Mayer’s and Wagner’s test
Tests for Tannins - Ferric chloride reagent test
Tests for Saponins - Foam test
Tests for Phenols - Ferric chloride reagent test
Tests for Flavonoids - Sodium hydroxide test
Test for Terpenoids - Salkowiski test
Test for Carbohydrate - Benedict’s test
Test for protein - Biuret test
2. Hydroxyl radical scavenging assay:
Principle:
Hydroxyl radicals, generated by the Fenton type reaction system (Fe+3 + EDTA / H2O2 / Ascorbic acid), are known to damage deoxyribose and form TBA reactive chromogen, which forms a pink colour measured spectrophotometrically at 532 nm.
Procedure:
The deoxyribose assay is performed as described by Halliwell et al. with minor changes. 1ml of reaction volume have 5.6 mM deoxyribose, 2.8 mM H2O2 , 40 µM FeCl3 , 100 µM EDTA, and varying concentrations of the sample in 2.5 mM phosphate buffer, pH 7.4. Initiation of the reaction is by the addition of 0.1 mM Ascorbic acid. The mixture is then incubated for 90 minutes at 37˚C. After incubation 1ml of TBA (0.7% in 0.05 N KOH) and 1ml of 2.5% TCA. The mixture is heated at 100˚C for 8 minutes, cooled and the pink colour formed is measured spectrophotometrically at 532 nm. Controls are to be run, which are devoid of test samples. Quercitin is used as the reference standard (Olatunde Farombi et al., 2002).
3. HPLC analysis of Quercetin:
Plant Extraction:
10gms plant powder was extracted with 50ml Methanol at 50oC for 4 hours. The Methanolic extracts were filtered through Whatmann No. 1 filter paper and filtrate was evaporated to dryness. Methanolic extract (10mg/ml) was used for HPLC analysis.
Quercetin Standard : 100ug/ml prepared in Methanol
HPLC Condition:
Instrument : Shimadzhu LC- Prominence 20AT
Column : C18 column 250 mm x 4.6 mm, 5u particle
Mobile Phase : Linear
A : HPLC grade Acetonitrile (60%)
B : HPLC grade Water (40%)
Flow Rate : 1.0 ml/min
Injection volume : 10ul
Quantification of Quercetin in plant extracts
Concentration of Standard injected : 100µg/ml
Sample concentration : 10mg/ml
Formula used for quantification of quercetin in plant extract
Quercetin (Mg/g) = Sample area / Standard area x Standard concentration injected x Dilution factor.
4. Cytotoxicity studies using 3T3-L1 cell line by MTT assay:
3T3-L1cell line was obtained from American Type Culture Collection (ATCC) (Rockville, MD USA) (ATCC Number-CL-173). The steps and procedure for cell culture, Thawing, Revival and Propagation of Cells were followed as described by Kangas, 1984.
Procedure
The collected cells should reach about 70-80% confluency. Check the viability of the cells and centrifuge it.Take about 50,000 cells / well and seed it in 96 well plates and incubate for 24 hrs at 370C, 5% CO2 incubator. Add plant samples which is to be tested from 0-320μg/ml (2 fold variation) concentration in RPMIwithout FBS & are incubated for 24 hr. Add 100μl/well of the MTT (5 mg/10ml of MTT in 1X PBS) to incubated plant samples to the respective wells and incubated for 3to 4 hours.Discard the MTT reagent by pipetting without disturbing cells and add 100 µl of DMSO to rapidly solubilize the formazan. Measure the Absorbance at 590 nm.
Calculating Inhibition
% Inhibition = 100 – (OD of sample/OD of Control) x 100
RESULTS:
1. Phytochemical analysis
|
S.No |
Tests |
Observation |
Inference |
|---|---|---|---|
|
1 |
Froth formation test |
Formation of stable froths was observed. |
Presence of Saponins was confirmed. |
|
2 |
Mayer’s and Wagner’s test |
A brown colour Precipitates was observed. |
Presence of Alkaloid was confirmed. |
|
3 |
Ferric Chloride test |
Dark green colour was not developed. |
Absence of Tannin was confirmed. |
|
4 |
Liebermann-Burchard test |
Formation of bluish green colour was observed. |
Presence of Steroid was confirmed. |
|
5 |
Sodium hydroxide test |
Change from yellow colour to colorless was observed. |
Presence of Flavonoid was confirmed. |
|
6 |
Ferric chloride test |
Violet colour was not developed. |
Absence of Phenol was confirmed. |
|
7 |
Salkowski test |
Reddish brown coloration was observed. |
Presence of Terpenoid was confirmed. |
|
8 |
Benedict’s test |
Formation of an orange red precipitate was observed. |
Presence of reduceing sugar was confirmed. |
|
9 |
Biuret test |
Formation of pink colour in the extract layer was found. |
Presence of protein was confirmed. |
Table – 1: Phytochemical Analysis Terminalia Arjuna leaves extracts
2. Hydroxyl radical scavenging assay:
Table – 2: Hydroxyl Radical Scavenging Assay
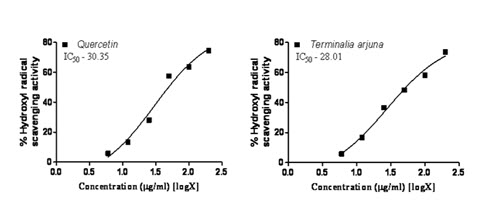
Figure – 1: Hydroxyl Radical Scavenging Assay
3. HPLC analysis of Quercetin and Terminalia arjuna
|
S. No. |
Retention. Time [min] |
Area [mV.s] |
Height [mV] |
Area [%] |
Height [%] |
W05 [min] |
|
1 |
1.933 |
373.177 |
22.881 |
20.5 |
14.0 |
0.20 |
|
2 |
3.107 |
92.433 |
3.352 |
5.1 |
2.0 |
0.49 |
|
3 |
3.487 |
1296.195 |
133.916 |
71.3 |
81.6 |
0.14 |
|
4 |
4.207 |
55.054 |
3.869 |
3.0 |
2.4 |
0.22 |
|
|
Total |
1816.859 |
164.018 |
100.0 |
100.0 |
|
Table – 3: HPLC analysis of Standard Quercetin
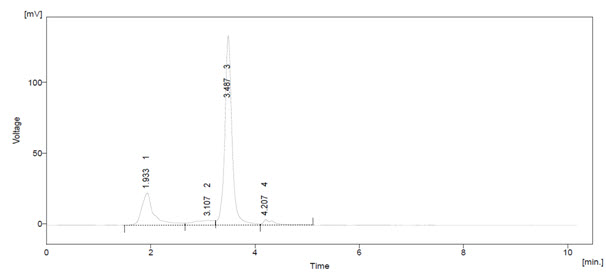
Figure – 2: HPLC analysis of standard Quercetin
|
S. No. |
Retention. Time [min] |
Area [mV.s] |
Height [mV] |
Area [%] |
Height [%] |
W05 [min] |
|
1 |
1.547 |
229.640 |
11.970 |
44.3 |
45.3 |
0.27 |
|
2 |
2.220 |
101.600 |
4.922 |
19.6 |
18.6 |
0.28 |
|
3 |
3.323 |
138.804 |
7.220 |
26.8 |
27.3 |
0.28 |
|
4 |
3.873 |
12.358 |
0.706 |
2.4 |
2.7 |
0.30 |
|
5 |
5.613 |
36.406 |
1.612 |
7.0 |
6.1 |
0.36 |
|
|
Total |
518.808 |
26.429 |
100.0 |
100.0 |
|
Table – 4: HPLC analysis of Quercetin content in Terminalia arjuna
NOW YOU CAN ALSO PUBLISH YOUR ARTICLE ONLINE.
SUBMIT YOUR ARTICLE/PROJECT AT editor-in-chief@pharmatutor.org
Subscribe to Pharmatutor Alerts by Email
FIND OUT MORE ARTICLES AT OUR DATABASE
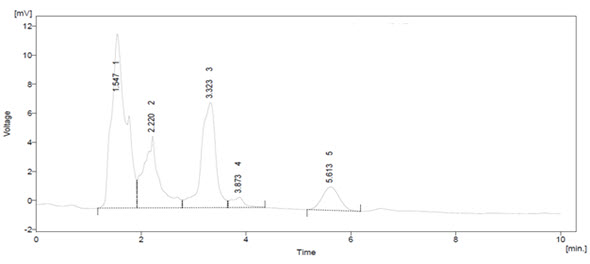
Figure – 3: HPLC analysis of Quercetin content in Terminalia arjuna
Quercetin content in plant extract
|
Sl.no |
Sample name |
Area |
Quercetin (Microgram/gram) |
Quercetin (Milligram/gram) |
|
1 |
Quercetin |
1296.19 |
|
|
|
2 |
T. arjuna |
138.80 |
1070.85 |
1.07 |
Table – 5: HPLC analysis of Quercetin
|
Cell line: 3T3L1 |
Conc. µg/ml |
O.D at 590 nm |
% Viability |
|
Control |
0.5911 |
100.00 |
|
|
Terminalia arjuna |
10 |
0.5825 |
98.55 |
|
20 |
0.5752 |
97.31 |
|
|
40 |
0.5798 |
98.09 |
|
|
80 |
0.5661 |
95.77 |
|
|
160 |
0.5651 |
95.60 |
|
|
320 |
0.5372 |
90.88 |
Table – 6: Cytotoxic study of Terminalia arjuna
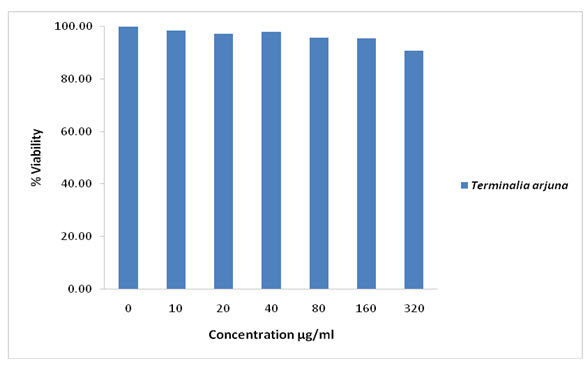
Figure – 4: Cytotoxic study of Terminalia arjuna
DISCUSSION:
From Table – 1, phytochemical compounds which includes alkaloids, terpenoids, steroids, reducing sugars, sponins, flavonoids, proteins and steroids. Phenol and Tannin are absent.
From Table – 2 and Figure – 1, studies on Hydroxyl radical scavenging assay using Quercetin as standard and compared the results with IC50 (half maximal inhibitory concentration) values the Terminalia arjuna root extract IC50 value were found less in Terminalia arjuna root extract than Quercetin. Hence it is understood that the Terminalia arjuna (IC50:28.01µg/ml) had less inhibitory concentration when compare to Quercetin (IC50: 30.35ug/ml). It has radical scavenging property but not to the extent of standard Quercetin.
From Table – 3, 4 and Figure – 3, 4, the flavonoids were quantified at 254nm using peak area by comparison with a calibration curve derived from the quercetin. The HPLC chromatograms from root of Terminalia arjuna the main difference was in peak eluted at 3.4min. External flavonoids were already analyzed using HPLC method in various plant extracts. The peaks in this study shown marked increased in peak area in case of Terminalia arjuna when compared with standard quercetin.
From Table – 5, the calibration curve results, the amount of Quercetin, in the sample injected was calculated. Terminalia arjuna contain 1.07 mg/g of quercetin. Other peaks (#1) in both the HPLC chromatogram Terminalia arjuna extracts indicated the presence of other chemical constituents The present method was applicable for determining quercetin in any aerial part of plant material using HPLC technique.
From Table – 5 and Figure – 4, the studies on 3T3L1adipocyte cell line using MTT assay after completing sub cell culture collected the cells when they reach about 70-80% confluency, showed significant proliferation of 3T3L1 cells growth. These results suggest that these plants have more proliferative capability on 3T3L1 cells compared to control and shown significant dose-dependent inhibition of growth of 3T3L1cells. Hence the Terminalia arjuna extract was found to be a powerful anti diabetic component that can inhibit the growth of 3T3L1cell lines.
CONCLUSION:
Our results are in accordance with the above findings, and showed that Terminalia arjuna possess maximum phytochemicals. The above literatures lend credibility to the observation that Terminalia Arjuna is good in radical scavengers. The maximum hydroxyl scavenging IC50 valve of standard Quercetin and Terminalia Arjuna was found to be 30.35 and 28.01 respectively. The MTT assay states that it was found that there were cytotoxic effects with increasing concentration on3T3-L1 cell line from 10µg to 320µg concentration when compared to the untreated 3T3-L1 cell line.
REFERENCES:
1. Chang C.C, Lin K.Y, Peng K.Y, Day Y.J, Hung L.M (2016) ; Resveratrol exerts anti-obesity effects in high-fat diet obese mice and displays differential dosage effects on cytotoxicity, differentiation and lipolysis in 3T3-L1 cells. Endocr. J. 63(2) : 169 – 178.
2. Expert Committee on the Diagnosis and Classification of Diabetes Mellitus. Report of the expert committee on the diagnosis and classification of Diabetes Mellitus. Diabetes Care 1997, 20(7): 1183 – 1197.
3. Francisco Javier Ruiz-Ojeda, Azahara Iris Rupérez, Carolina Gomez-Llorente Angel Gil 1, 2, 3 Concepción María Aguilera (2016) ; Cell Models and their Application for Studying Adipogenic Differentiation in Relation to Obesity. Int. J. Mol. Sci., 17(7): 1040.
4. Giri RR, Giri KR, Patel SS and Palandurkar KM (2012) ; Effect of Terminalia arjunain accelerating healing process of experimentally fractured tibia of rats: A preliminary study. Research Journal of Pharmaceutical, Biological and Chemical Sciences ; 3(4); 417-425
5. Green, H, Kehinde O (1976) ; Spontaneous heritable changes leading to increased adipose conversion in 3T3 cells. Cell , 7(1): 105–113.
6. Hemant R J, Bhutani K K (2002) ; Antioxidant properties of Indian Medicinal plants. Phytother. Res, 16(8): 771 – 773.
7. Kangas L: Bioluminescence of cellular ATP (1984) : A new method for Evaluating cytotoxic agents in vitro. Med. Biol. 62(6): 338–43.
8. Khaliq F, Parveen A, Singh S, Gondal R, Hussain ME, Fahim M (2013) ; Improvement in myocardial function by Terminalia Arjuna in streptozotocin- induced diabetic rats: possible mechanisms. J Cardiovasc Pharmacol Ther , 18(5) : 481 – 489.
9. Kumar PJ, Clark M: Textbook of Clinical Medicine. Pub Saunders (London) 2002, 1099 – 1121.
10. Manna P, Sinha M, Pal P, Sil P C (2007) : Arjunoic acid a tri terpenoid saponin ameliorates arsenic induced cytotoxicity in hepatocytes. Chemico boil interacts, 170 (3) : 187 – 200.
11. Manna P, Sinha M, Pal P, Sil P C (2008) : Protection of arsenic induced testicular oxidative stress by arjunolic acid. Redox Rep , 13(2): 67 – 77.
12. Olatunde Farombi E, Olayide Alanni O, Godwin Emerole O (2002) ; Antioxidant and scavenging activities of flavanoid extract (Kolaviron) of Garcinia kola seeds. Pharma. Biol, , 40(2): 107 – 116.
13. Padmaa M Paarakh, Terminalina Arjuna, Rox B W, Arn (2010) ; A Review. International journal of pharmacology , 6(5): 515 – 534.
14. Poulos S.P, Dodson M.V, Hausman G.J (2010) ; Cell line models for differentiation: Preadipocytes and adipocytes. Exp. Biol. Med , 235(10) : 1185 – 1193.
15. Segelman A B, Fransworth N R, Quimbi M D, L Loide (1969); Biological and phytochemical evaluation of plants. Pub met , 32 (1) : 52 – 58.
16. Sumitra M, Manikandan P, Kumar D.A, Arutselvan N, Balakrishna K, Manohar B.M, Puvanakrishnan R (2001) : Experimental myocardial necrosis in rats: role of arjunolic acid on platelet aggregation, coagulation and antioxidant status. Mol. Cell Biochem , 224(1-2) : 135 – 142.
17. Vishwanath D, Srinivasan H, Patil M.S, Seetarama S, Kumar S.A, Dixit M.N (2013) : Novel method to differentiate 3T3 L1 cells in vitro to produce highly sensitive adipocytes for a GLUT4 mediated glucose uptake using fluorescent glucose analog. J. Cell Commun. Signal , 7(2) : 129–140.
18. Wang H J, Jin Y X, Shen W, Neng J, Wu T, Li Y J, Fu Z W (2007) : Low dose Streptozotocin (STZ) combined with high energy intake can effectively induce type-2 diabetes through altering the related gene expression. Asian Pac J. Clin Nutr. , 16(1): 412 – 417.
NOW YOU CAN ALSO PUBLISH YOUR ARTICLE ONLINE.
SUBMIT YOUR ARTICLE/PROJECT AT editor-in-chief@pharmatutor.org
Subscribe to Pharmatutor Alerts by Email
FIND OUT MORE ARTICLES AT OUR DATABASE


