ABOUT AUTHORS:
Sandeep Kumar Patro*, M.Jhansi, Dr.A.M.S.Sudhakar Babu, Sk.Asief, P.Ramesh Babu
A.M.Reddy memorial college of pharmacy, Narasaraopet.
Sandeepkumarpatro2@gmail.com
ABSTRACT
Study of drug - excipient compatibility is an important process in development stage of dosage forms. Incompatibility between drugs and excipients alter drug stability and bioavailability &there by affect their safety and efficacy. Dosage form is a pharmaceutical drug delivery system, which is a combination of drug(s) and non-drug components called as excipients. Drug is a chemical substance obtained from either natural, synthetic or semi synthetic source, which is used for the treatment, curing, prevention or mitigation of a disease or disorder in human beings or animals Excipients are nondrug components which are serve specific purposes like shape, stability, solubility, elegance, palatability etc. of a dosage form. These are also called as adjuvants, additives or pharmaceutical aids. The evaluation of drug-excipient compatibility is therefore an essential aspect of any preformulation study. To evaluate the drug- excipient compatibility different techniques such as Thermal analysis, Differential scanning calorimetric (DSC) study, Infra red spectrophotometric study (IR), Isothermal stress testing (IST), High performance liquid chromatography (HPLC),Thin layer chromatography (TLC), Solution calorimetry were adopted.
REFERENCE ID: PHARMATUTOR-ART-2040
INTRODUCTION
The formulation of a stable and effective dosage form requires careful selection of excipients used to facilitate administration, promote consistent release and bioavailability of the drug and to protect the active moiety from the environment. To facilitate the development of novel drug delivery systems, the demand of new excipients has been increased. Excipients is selected and used because it contributes one or more functional attributes to the product characteristics. The quality of medicines depends not only on the active principles and production processes, but also on the performance of the excipients. In earlier days, excipient(s) were considered inactive ingredients, but they may have tremendous effect on performance of active pharmaceutical ingredients in dosage form. The magnitude of this effect will depend upon physicochemical properties of drugs as well as quantity and quality of excipients usedAlthough often regarded as ‘inert’, excipient can in fact readily interact with drugs. The evaluation of drug-excipient compatibility is therefore an essential aspect of any preformulation study. The two commonly employed compatibility screening techniques are isothermal stress testing of binary drug-excipient mixtures and thermal analysis using either DSC or differential thermal analysis (DTA).
Incompatibility between drug and excipient can alter stability and bioavailability of drugs, thereby, affecting its safety and/or efficacy. Study of drug–excipient compatibility is an important process in the development of a stable solid dosage form. Drug–excipient compatibility testing at an early stage helps in the selection of excipient that increases the probability of developing a stable dosage form. A number of techniques can be used to indicate the drug/ excipient interaction. Differential scanning calorimetry (DSC) is one of the well-developed techniques used in detection of incompatibilities in drug/ drug and drug/excipient interactions. Differential thermal analysis (DTA) is similar to DSC in many respects and analogous information about the same range of thermal events can be observed. Other non-thermal methods that have been used to indicate the drug/excipient interactions include infrared spectroscopy, optical microscopy and HPLC studies.
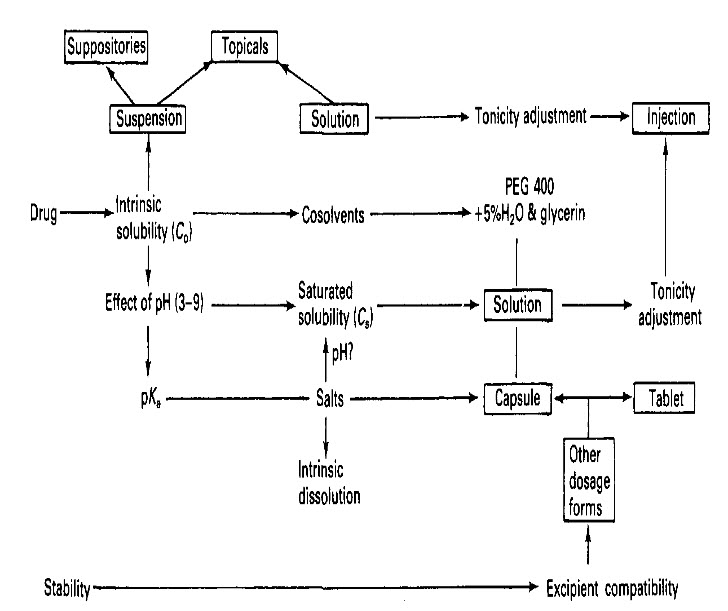
A generic development pathway: the relationship between preformulation and formulation in dosage form development. The formulation stages are shown in boxes and the preformulation stages are unboxed.
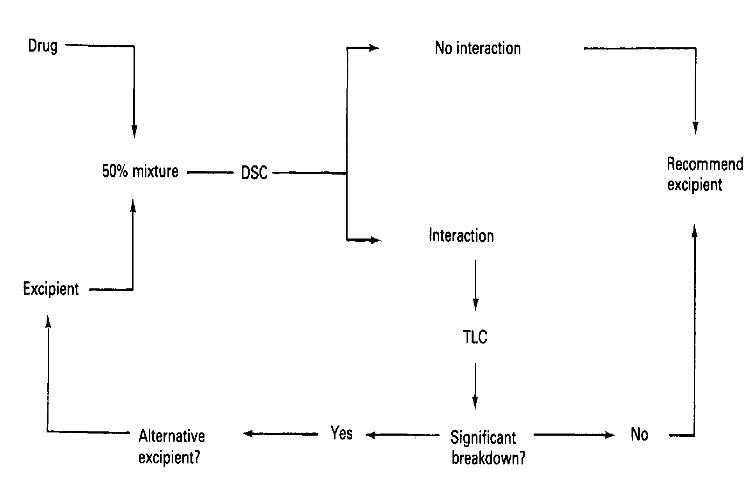
Scheme to identify chemically compatible excipients using DSC with confirmatory TLC.
THERMAL ANALYSIS
Thermal analysisis a branch of materials science where the properties of materials are studied as they change with temperature. Several methods are commonly used – these are distinguished from one another by the property which is measured:
- Dielectric thermal analysis(DEA): dielectric permittivity and loss factor
- Differential thermal analysis(DTA): temperature difference
- Differential scanning calorimetry(DSC): heat difference
- Dilatometry(DIL): volume
- Dynamic mechanical analysis(DMA) : mechanical stiffness and damping
- Evolved gas analysis(EGA) : gaseous decomposition products
- Laser flash analysis(LFA): thermal diffusivity and thermal conductivity
- Thermogravimetric analysis(TGA): mass
- Thermomechanical analysis(TMA): dimension
- Thermo-optical analysis(TOA): optical properties
Simultaneous Thermal Analysis (STA) generally refers to the simultaneous application of Thermogravimetry(TGA) and differential scanning calorimetry(DSC) to one and the same sample in a single instrument. The test conditions are perfectly identical for the TGA and DSC signals (same atmosphere, gas flow rate, vapor pressure of the sample, heating rate, thermal contact to the sample crucible and sensor, radiation effect, etc.). The information gathered can even be enhanced by coupling the STA instrument to an Evolved Gas Analyzer (EGA) like Fourier transform infrared spectroscopy(FTIR) or mass spectrometry (MS).
Thermodynamic Terms
In a DSC experiment, thermodynamic parameters are associated with heat-induced macromolecular transitions. For a typical macromolecule, the molar Cp is measured as a function of temperature, subsequently, yielding the following thermodynamic parameters:
The partial Cp of a molecule
DSC measures the partial Cp of a sample. The Cp of the solution containing a macromolecule is measured with respect to the Cp of buffer in the absence of macromolecules. Hence, the instrument measures only part of what could be actually measured, which is the difference between sample and reference cells. The sample could be a protein, tRNA, a protein-DNA complex, a protein-lipid complex, or something else.
The Cp at constant pressure is a temperature derivative of the enthalpy function [Cp=(ΔH/ΔT)p], and thus, the enthalpy function can be measured through integration of the Cp [H(T)=∫T/T0 Cp(T)dT+H(T0)].
ΔH, Change in Entropy (ΔS), ΔCp of the Tm
For any biomolecule in aqueous solution, there would be equilibrium between the native conformation (folded) and its denatured state (unfolded). Stability of the native conformation is based on the extent of Gibbs free energy (ΔG) of the system and thermodynamic relationships between ΔH and ΔS. A negative magnitude of ΔG represents higher stability of the native conformation than that of the denatured state. The more negative ΔG, the greater the stability. During the unfolding process of a protein, forces that play a key role in stabilization need to be broken. At temperatures where entropy is the dominant factor, conformational entropy overcomes the stabilizing forces, leading to unfolding of the protein.
DSC measures ΔH of unfolding as a result of heat denaturation. The transition midpoint Tm is considered as the temperature, where 50% of the protein owns its native conformation, and the rest remains denatured. Higher Tm values would be representative of a more stable molecule. During the same experiment, DSC is also capable of measuring the ΔCp. Associated with protein unfolding process, ΔCp occurs as a result of changes in hydration of side-chains, which are buried in the native conformation but become exposed to the solvent in a denatured state.
Calorimetric enthalpy (ΔHcal) means the total integrated zone below the thermogram peak, which indicates total heat energy uptake by the sample after suitable baseline correction affecting the transition.
van't Hoff enthalpy (ΔHVH) is an independent measurement of the transitional enthalpy according to the model of the experiment. ΔHVH is determined through the shape analysis of an experimental graph of Cpex versus T.
The state of the transition is evaluated by comparing ΔHVH with ΔHcal. If ΔHVH is equal to ΔHcal, the transition occurs in a two-state mode. In such processes, meaningful thermodynamic results are determined through van't Hoff measurements of equilibrium results. When ΔHVH is more than ΔHcal, the intermolecular cooperation is shown, which is exposed, for example, as aggregation. Comparison between ΔHVH and ΔHcal also indicates the cooperative nature of the transition. Particularly, the ΔHVH/ΔHcal ratio gives an estimation from the fraction of the structure, which is melted as a thermodynamical value. The value is also named as the size of the cooperative unit.
Cp for the transitional state is obtained through the difference between pretransitional and post-transitional baselines of a DSC process. The curve of Cp against T can be changed to Cp/T versus T through dividing the raw Cp value by T and drawing the results as a function of T. By integration, this curve results in the transition entropy (ΔS), which is expressed as (ΔS) = ∫(Cp/T) dT. Hence, an individual DSC thermogram can result in ΔH, ΔS, and ΔCp.
After knowing the above data, transition-free energy (ΔG) can be given at each temperature (T) through the thermodynamic equation ΔG = ΔH − TΔS.Although ΔS and ΔG can be obtained by DSC results, the values are more unreliable than the ΔH and ΔCp values determined directly because of coupling and propagating of errors.
Absolute Cp
Apparent Cp can be obtained by DSC results. It includes the contribution of water displacement by the protein in the sample cell, which could have a negative value. Correction for the water displacement effect and normalization to a mole of protein offer the absolute Cp. The value is obtained from doing a series of DSC measurements at different protein concentrations.
Determined absolute heat capacities by DSC could be used to characterize long-range interactions and cooperative phenomena, which have been shown to occur in denatured proteins.
DIFFERENTIAL SCANNING CALORIMETRY
Differential scanning calorimetry or DSC is a thermoanalyticaltechnique in which the difference in the amount of heat required to increase the temperature of a sample and reference is measured as a function of temperature. Both the sample and reference are maintained at nearly the same temperature throughout the experiment. Generally, the temperature program for a DSC analysis is designed such that the sample holder temperature increases linearly as a function of time. The reference sample should have a well-defined heat capacity over the range of temperatures to be scanned.
The technique was developed by E.S. Watson and M.J. O'Neill in 1962, and introduced commercially at the 1963 Pittsburgh Conference on in 1964. The term DSC was coined to describe this instrument which measures energy directly and allows precise measurements of heat capacity.
Detection of phase transitions
The basic principle underlying this technique is that when the sample undergoes a physical transformation such as phase transitions, more or less heat will need to flow to it than the reference to maintain both at the same temperature. Whether less or more heat must flow to the sample depends on whether the process is exothermic or endothermic. For example, as a solid sample melts to a liquid it will require more heat flowing to the sample to increase its temperature at the same rate as the reference. This is due to the absorption of heat by the sample as it undergoes the endothermic phase transition from solid to liquid. Likewise, as the sample undergoes exothermic processes (such as crystallization) less heat is required to raise the sample temperature. By observing the difference in heat flow between the sample and reference, differential scanning calorimeters are able to measure the amount of heat absorbed or released during such transitions. DSC may also be used to observe more subtle physical changes, such as glass transitions. It is widely used in industrial settings as a quality control instrument due to its applicability in evaluating sample purity and for studying polymer curing.
DSC curves
The result of a DSC experiment is a curve of heat flux versus temperature or versus time. There are two different conventions: exothermic reactions in the sample shown with a positive or negative peak, depending on the kind of technology used in the experiment. This curve can be used to calculate enthalpies of transitions. This is done by integrating the peak corresponding to a given transition. It can be shown that the enthalpy of transition can be expressed using the following equation:
ΔH = KA
where ΔH is the enthalpy of transition, K is the calorimetric constant, and A is the area under the curve. The calorimetric constant will vary from instrument to instrument, and can be determined by analyzing a well-characterized sample with known enthalpies of transition.
Applications
Differential scanning calorimetry can be used to measure a number of characteristic properties of a sample. Using this technique it is possible to observe fusion and crystallization events as well as glass transition temperatures Tg. DSC can also be used to study oxidation, as well as other chemical reactions.
Glass transitions may occur as the temperature of an amorphous solid is increased. These transitions appear as a step in the baseline of the recorded DSC signal. This is due to the sample undergoing a change in heat capacity; no formal phase change occurs.
As the temperature increases, an amorphous solid will become less viscous. At some point the molecules may obtain enough freedom of motion to spontaneously arrange themselves into a crystalline form. This is known as the crystallization temperature (Tc). This transition from amorphous solid to crystalline solid is an exothermic process, and results in a peak in the DSC signal. As the temperature increases the sample eventually reaches its melting temperature (Tm). The melting process results in an endothermic peak in the DSC curve. The ability to determine transition temperatures and enthalpies makes DSC a valuable tool in producing phase diagrams for various chemical systems.
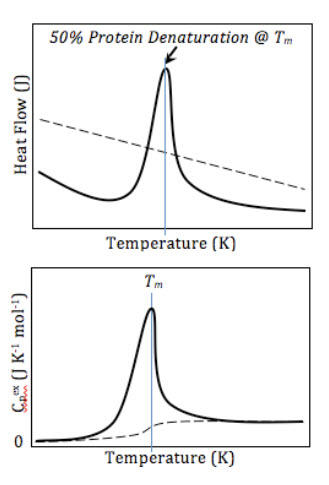
Top: A schematic DSC curve of amount of energy input (y) required to maintain each temperature (x), scanned across a range of temperatures. Bottom: Normalized curves setting the initial heat capacity as the reference. Buffer-buffer baseline (dashed) and protein-buffer variance (solid).
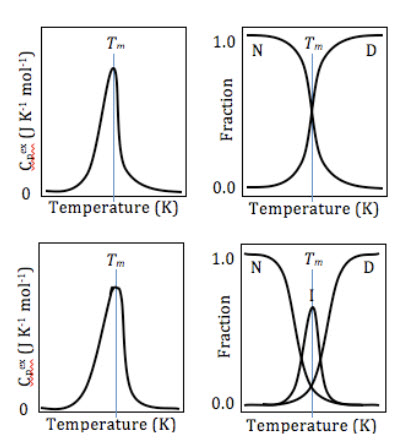
Normalized DSC curves using the baseline as the reference (left), and fractions of each conformational state (y) existing at each temperature (right), for two-state (top), and three-state (bottom) proteins. Note the minuscule broadening in the peak of the three-state protein's DSC curve, which may or may not appear statistically sigExamples
The technique is widely used across a range of applications, both as a routine quality test and as a research tool. The equipment is easy to calibrate, using low melting indium at 156.5985 °C for example, and is a rapid and reliable method of thermal analysis.
Polymers
DSC is used widely for examining polymeric materials to determine their thermal transitions. The observed thermal transitions can be utilized to compare materials, however, the transitions do not uniquely identify composition. Composition of unknown materials may be completed using a technique such as IR. Melting points and glass transition temperatures for most polymers are available from standard compilations, and the method can show polymer degradation by the lowering of the expected melting point, Tm, for example. Tm depends on the molecular weight of the polymer and thermal history, so lower grades may have lower melting points than expected. The percent crystalline content of a polymer can be estimated from the crystallization/melting peaks of the DSC graph as reference heats of fusion can be found in the literature.DSC can also be used to study thermal degradation of polymers using an approach such as Oxidative Onset Temperature/Time (OOT), however, the user risks contamination of the DSC cell, which can be problematic. Thermogravimetric Analysis (TGA) may be more useful for decomposition behavior determination. Impurities in polymers can be determined by examining thermograms for anomalous peaks, and plasticisers can be detected at their characteristic boiling points. In addition, examination of minor events in first heat thermal analysis data can be useful as these apparently "anomalous peaks" can in fact also be representative of process or storage thermal history of the material or polymer physical aging. Comparison of first and second heat data collected at consistent heating rates can allow the analyst to learn about both polymer processing history and material properties.
Liquid crystals
DSC is used in the study of liquid crystals. As some forms of matter go from solid to liquid they go through a third state, which displays properties of both phases. This anisotropic liquid is known as a liquid crystalline or mesomorphous state. Using DSC, it is possible to observe the small energy changes that occur as matter transitions from a solid to a liquid crystal and from a liquid crystal to an isotropic liquid.
Oxidative stability
Using differential scanning calorimetry to study the stability to oxidation of samples generally requires an airtight sample chamber. Usually, such tests are done isothermally (at constant temperature) by changing the atmosphere of the sample. First, the sample is brought to the desired test temperature under an inert atmosphere, usually nitrogen. Then, oxygen is added to the system. Any oxidation that occurs is observed as a deviation in the baseline. Such analysis can be used to determine the stability and optimum storage conditions for a material or compound.
Safety Screening
DSC makes a reasonable initial safety screening tool. In this mode the sample will be housed in a non-reactive crucible (often gold, or gold plated steel), and which will be able to withstand pressure (typically up to 100 bar). The presence of an exothermic event can then be used to assess the stability of a substance to heat. However, due to a combination of relatively poor sensitivity, slower than normal scan rates (typically 2-3 °/min - due to much heavier crucible) and unknown activation energy, it is necessary to deduct about 75-100 °C from the initial start of the observed exotherm to suggest a maximum temperature for the material. A much more accurate data set can be obtained from an adiabatic calorimeter, but such a test may take 2–3 days from ambient at a rate of a 3 °C increment per half hour.
Drug analysis
DSC is widely used in the pharmaceutical and polymer industries. For the polymer chemist, DSC is a handy tool for studying curing processes, which allows the fine tuning of polymer properties. The cross-linking of polymer molecules that occurs in the curing process is exothermic, resulting in a positive peak in the DSC curve that usually appears soon after the glass transition.[4][5][6]
In the pharmaceutical industry it is necessary to have well-characterized drug compounds in order to define processing parameters. For instance, if it is necessary to deliver a drug in the amorphous form, it is desirable to process the drug at temperatures below those at which crystallization can occur.
General chemical analysis
Freezing-point depression can be used as a purity analysis tool when analysed by differential scanning calorimetry. This is possible because the temperature range over which a mixture of compounds melts is dependent on their relative amounts. Consequently, less pure compounds will exhibit a broadened melting peak that begins at lower temperature than a pure compound significant to the naked eye.
DSC TECHNIQUES
MEMS-DSC
MEMS is a method applied in manufacturing three-dimensional silicon-based structures with specific geometrical, mechanical, and electrical characteristics to operate certain functions. The idea of MEMS-DSCs was formed as a result of two functional problems of conventional DSCs, which prevent them from performing effectively in biomolecular structural transitions. The problems could be summarized as: inadequate sensitivities and use of external heaters to control the device chamber temperatures.
MEMS-DSC is a polymer-based and miniaturized DSC with integrated microfluidics for analyzing structural transitions of biological molecules in liquid phase. MEMS-DSC contains all of the essential components, including a heating resistor, a temperature sensor, a sensor to determine temperature differences, a well-defined thermal conductance, and a container.
MEMS-DSC contains two microfluidics chambers, which have their respective inlets and outlets connected through microchannels. Each chamber is embedded by an air space for maximum thermal isolation and minimum thermal mass. In addition, each chamber contains a polymeric membrane, which with the microfluidic channels and chambers allow efficient handling and measurements of 1 μl samples.
One thermopile is integrated with its hot and cold junctions (formed between Ni and Cr) on the membranes in the sample and reference chambers. Hence, using a low-noise thermopile temperature sensor and optimized thermal structures, sensitivity at approximately 50 nW could be obtained. Also, a resistive temperature sensor and heater exist on each membrane to make a temperature control on the silicon chip. The resistive heaters and temperature sensors allow varying temperatures with prescribed rates. An island from Cu is enclosed to the backside of the membranes to extend their temperature uniformity.
For analysis, one chamber is filled with a sample and the other with a reference buffer. Temperatures of sample and buffer are controlled in a closed loop by the sensors and heaters. Minimum differences of the temperatures between the sample and buffer are measured by the thermopile. Any difference in the temperatures reflects structural changes of the sample and is used to assess the thermodynamic characteristics of the molecules.
The most known applications of MEMS-DSC have been reported for measurement of protein denaturations, yielding melting points in agreement with the literature values by basic DSCs. For instance, Wang et al. applied this system to measure thermodynamic parameters of lysozyme when thermally unfolded. As their MEMS calorimeter was equipped with a thermopile device, they could also monitor the thermal activity of the protein by thermopile output voltage. This capability leads to computation of differential Cp versus scanned temperatures. The obtained result (Tm∼68.1°C) was in excellent agreement with the literature value (Tm∼66.2°C), and the calorimeter showed that it can indeed be applied for structural transitions of biomacromolecules in liquid.
IR-Heated DSC
IR-heated DSC is a heat-flux DSC, which is comprised of a DSC sensor assembly for receiving a sample that is installed in a cavity within an elongated cylinder and an IR lamp assembly disposed of circumferentially around the elongated cylinder having a length substantially similar to that of the cylinder. The measurement assembly comprises an elongated, high thermal conductivity cylinder having a cavity in which the DSC sensing assembly is situated and a high emissivity outer surface. The IR lamp assembly preferably comprises a plurality of tubular lamps, each having a longitudinal axis arranged parallel to the axis of the elongated cylinder and an IR reflector comprising a plurality of partial cylindrical surfaces, which each describes as a cylindrical shape with a focus collinear with the axis of each tubular lamp.The IR furnace is used to heat a measuring assembly that incorporates a high thermal conductivity enclosure similar to that of a conventional DSC. The enclosure reduces temperature difference errors that result from heat exchange among the sensor, sample pans, and their surroundings. Given the size of the enclosure, much more IR energy from the lamps must be delivered to the measuring assembly to achieve a desired heating rate, and more energy must be removed to achieve a desired cooling rate.
The calorimeter further comprises a thermal resistor coupled to the measurement assembly, wherein the thermal resistor is disposed of substantially outside of a region whose perimeter is defined by a cavity within the lamp assembly and a heat sink thermally coupled to the thermal resistor and to the IR reflector. The heat-flux DSC includes a single thermal resistor used to thermally connect the measuring assembly to the external heat sink located externally to the reflector.The thermal resistor is also located externally to the reflector, wherein the resistor is disposed of outside of the region defined by the reflector cavity. The thermal resistor may be comprised of a solid material having the requisite composition and geometry to create the desired heat-flow restriction, or it may be a small gap filled with gas, such that the gas thermal conductivity and the gap dimension create the desired heat-flow restriction. When the thermal resistor comprises a gas-filled gap, the gas composition may be changed to modify the magnitude of its thermal resistance. Rather than using a separate cooling system for the reflector, it is also coupled to the heat sink so that it too is cooled by the heat sink. In this manner, the cooling rates and the minimum temperature achieved by the apparatus are improved. In addition, the device is simplified by elimination of a separate cooling system for the IR reflector.
The exterior surface of the DSC enclosure that surrounds a measurement assembly is an elongated circular cylinder that is approximately equal in length to a reflector cavity and lamp assembly that forms an IR heating assembly. In this manner, the DSC enclosure intercepts a greater fraction of the energy emitted by the lamps and reflected by the reflector.
The DSC enclosure comprises a high emissivity exterior surface and a single high emissivity material. It comprises an enclosure, such as a cylindrical enclosure, whose emissivity is not high in an inner portion of the cylinder walls but whose exterior surface is coated or laminated with a high emissivity layer to greatly increase the absorption of radiation arriving at the surface. In addition, in embodiments of the device, the measuring assembly is constructed without a surrounding quartz tube, which is conventionally used to enclose the measuring assembly. This further improves heat-exchange efficiency and also allows the lamps to be positioned closer to the measuring assembly, which in turn, allows the reflector surface area to be reduced. The ratio of heated area to reflector area is thus increased, further improving the efficiency of IR heating.
A single heat sink is used in the DSC apparatus and is located externally to the IR furnace reflector so that the heat sink is not heated directly by radiation, still further improving the efficiency of IR heating. The heat sink may be cooled by circulating water or some other fluid as a coolant. Alternatively, the heat sink may be cooled by evaporation of a subcooled liquid, which may be the refrigerant in a vapor compression refrigeration system or an expendable coolant, such as liquid nitrogen, whose vapor is discharged to the atmosphere.
IR-heated DSC is also named as rapid-heating DSC (RHDSC). The calorimeter can offer heating rates up to 2000°C min–1, providing a new opportunity to characterize unstable polymorphs as a result of the likelihood that form changes can be inhibited at higher heating rates. Hence, Gaisford et al.used RHDSC to isolate and characterize paracetamol form III. In fact, they could isolate paracetamol form III from the glass and then quantify its melting point by heating it fast enough to inhibit the solid-solid transition to form II. This was achieved using heating rates more than 400°C min–1.
In summary, this type of DSC is configured to provide more rapid sample heating and cooling rates in comparison with conventional systems. Additionally, configurations of the system provide a more efficient arrangement for heating a DSC when the heat source is a plurality of lamps emitting IR radiation. More versatile sample measurements are provided by embodiments in which a heat-flux DSC includes a configurable thermal resistor. Thus, the thermal conductivity of the thermal resistor can be decreased during sample heating and increased during sample cooling, which allows the sample heating rate and sample cooling rate to be maximized independently during a single experiment.
MTDSC
MTDSC provides the amplitude and phase signals [alternating current (AC) signals] and the total heat-flow signal equivalent to that given by DSC simultaneously in a single experiment. The name MTDSC was copyrighted by TA Instruments. The technique used a conventional DSC, and the signals were produced by a deconvolution procedure carried out by a computer. A sinusoidal temperature modulation is the program used most often; however, there are many different forms of temperature programs for this aim.
In addition to the technique, a simple theory and method of interpretation were introduced that focused on the differences between the AC and nonreversing signals [direct current (DC) signals]. Briefly, MTDSC is an advanced technique, in which the total heat-flow signal is obtained as the temperature of the sample, and reference is heated according to a basic heating rate, upon which, a temperature oscillation has been superimposed. The total heat-flow signal can then be deconvoluted to obtain one or more deconvoluted signals representative of, for example, the rapidly reversible (AC) and/or nonrapidly reversible (DC) components of the heat flow.
The main idea of the deconvolution procedure was the importance of disentangling the sample response, which depends on temperature from the response, which depends on rate of temperature changes. The basis of MTDSC is according to simultaneously measuring the Cp of the sample using the response to the linear ramp and the response to the modulation and comparing those. For the inert sample, there are no significant temperature gradients between the sample temperature sensor and the center of the sample; both methods should give the same value. The fact that during transitions, these two techniques give different values is interesting.
The best-known advantages of MTDSC are the ability to separately measure one or more components of the total heat-flow signal; an improved ability, compared with conventional DSC, to measure transformations or other thermal events that are overlapped in temperature and/or in time; and improved resolution by allowing for the use of a relatively slow, underlying heating rate.251 The most commonly encountered types of processes that are studied by MTDSC are in polymeric materials. The appropriate specific kinetic functions could be obtained as chemical reactions and related processes, glass transitions, and polymer melting.
The results of averaging the MHF signal are equivalent to conventional DSC and can be recovered. The fact is important, as the information DSC provides is very useful. The sample's vibrational Cp, independently of any other process that is occurring, such as a chemical reaction, could be measured by looking at the in-phase response to the modulation. This signal leads to Cp directly. Also, the out-of-phase response can be expressed as the kinetic or in complex notation, the imaginary Cp. However, it is generally approximated by taking the derivative with respect to temperature of the heat flow generated by the reaction or other process. This signal can be used to determine the activation energy for a reaction. The nonreversing signal gives a measure of the energy that arises from the chemical reaction.
The Tg, as measured by the reversing Cp, is a function of frequency. The Tt, as measured by the total Cp on cooling, is a function of cooling rate. There is equivalence between these two observations, as changing the frequency of the modulation and the cooling rate alters the time-scale over which the measurement is made. Aging below the glass transition produces an enthalpy loss that is recovered as a peak overlaid on the glass transition. However, this aging does not, at low degrees of annealing, have a great effect on the reversing signal, and this is intuitively satisfactory, as the aging effect is not reversible on the time-scale of the modulation.
Polymer melting is the result of a distribution of species, all melting at their equilibrium melting temperature, and subsequently, the enthalpy of melting is found in whole or, in part, in the reversing signal. Principally, this type of melting behaves in a similar manner to Cp, where there is no cooling during the modulation cycle. Hence, the reversing signal no longer has the same meaning as it does when considering chemical reactions and glass transitions, as the reversing signal contains a contribution from an essentially nonreversing process.
GFMDSC
GFMDSC modulates a DSC by setting the properties of a gas in thermal contact with the sample and the reference in the calorimeter. The device allows the use of MDSC at high modulation rates compared with the modulation rates used with MTDSC.
The major heat-flow path between the sample or reference and the furnace is the purge gas in the furnace chamber. The composition of the purge gas in the furnace chamber of a DSC cell is modulated by alternately purging the DSC with a high thermal conductivity gas (such as helium) and with a low thermal conductivity gas (such as nitrogen). This characteristic modulates the properties of the calorimeter cell. When there is no heat flow between the sample or reference and the furnace, because of equilibrium between the sample and reference with the furnace, the composition of the purge gas is irrelevant, and there is no modulated signal. However, if the sample is not in thermal equilibrium with its surroundings, modulating the thermal conductivity of the purge gas modulates the flow of heat to the sample or reference and thus, produces a modulated signal.
As typical DSC cells have relatively small volumes, MDSCs can be modulated at relatively high rates using this technique.If the temperature of the furnace is modulated at one frequency, and the composition of the purge gas is modulated at substantially different frequency, then a multiplexed signal would be created.
Instead of the flow rate, the temperature of the temperature-controlling gas is modulated.A combination of furnaces may be used to obtain the desired sample and reference temperatures. For instance, a relatively large thermal mass furnace may be used for the linear portion of the sample and reference temperatures, and separate low thermal mass furnaces may be used to modulate the sample or reference temperatures. As the thermal mass of the modulation furnaces is relatively low, the sample or reference temperatures can be modulated at relatively high modulation rates.
The technique provides improved methods and apparatus for modulating the temperature of a sample or a reference in a MDSC. Also, it is another characteristic of the device to modulate the heat flow to and from a sample and a reference in a MDSC by modulating the composition of the purge gas in the modulated calorimeter. Additionally, the technique modulates the temperature of a sample or a reference in a MDSC by modulating the flow rate of a gas controlling the temperature of the sample or a reference in the modulated calorimeter.
There are several ways for purge gas to contribute the experiments. For instance, the flowing gas helps to remove moisture or oxygen, which may accumulate and damage the cell over the time. Also, the gas supplies for a smooth thermal blanket, which limits localized hot-spots that can lead to artifactual heat flow. The purge gas exists for more efficient heat transfer between the constantan disc and the sample pan, resulting in more sensitivity and faster response time. Additionally, it helps to cool the cell so that faster cooling rates and wider modulation parameters may be obtained.
In summary, this equipment could be used in MDSC or DSC mode to contribute the experiment in several ways, such as to help to remove moisture or oxygen that may accumulate and damage the cell over time, to provide a smooth thermal blanket that eliminates localized hot-spots, which can lead to artifactual heat flow, and to provide more efficient heat transfer between the constantan disc and the sample pan, resulting in more sensitivity and faster response time. In fact, the purge gas by this system helps to cool the cell so that faster cooling rates and wider modulation parameters may be achieved. Hence, to optimize the MDSC experiment and generate accurate and reproducible results, a flowing inert purge gas using this equipment should generally be applied.
PNDSC
Traditional DSC requires relatively large amounts of test material, and thermal analyses on nanoscale samples are difficult; however, it is not impossible. Its application in nanoscience, where sample sizes are small, is rather limited. As the properties of nanomaterials may differ significantly from their bulk counterparts, a DSC that is sensitive enough to probe nanoscale quantities is desirable. On the other hand, traditional DSCs are limited to taking one measurement at a time, and a new sample must be loaded between each measurement. This severely limits the use of a traditional DSC in combinatorial studies at the nanoscale.
PNDSC is a power-compensation DSC, which included a plurality of cell structures being used to define a selective region for calorimetric measurements of a nanomaterial. Heating units have been positioned on the cell structures to provide the required energy to perform calorimetric analyses in each of the cell structures. The cell structures and the heating units are arranged so as to allow the calorimetric system to perform, in a combinatorial manner, calorimetric measurements associated with the nanostructure.
The calorimetric system is used for the combinatorial analysis of complex nanoscale material systems. The PNDSC is a micro-machined array of calorimetric cells. This new approach to combinatorial calorimetry greatly expedites the analysis of nanomaterial thermal characteristics. Additionally, a set of samples can be analyzed simultaneously, greatly reducing the time for such a study when compared with a conventional, one-at-a-time approach.
PNDSC combines DSC and combinatorial analysis in a novel way, which is ideal for analyzing complex material systems. The core of the system is micro-machined, which included a 5 × 5 array of calorimetric cells. The system reduces the measurement time of complex nanomaterials by at least an order of magnitude.The device promises to revolutionize the development of such materials, providing the raw material data for nanoscience innovation and design.
The calorimeter includes a heating element in a double-spiral pattern. Such a layout will improve the thermal efficiency of the device and expand its capability for kinetic analyses. Incorporation of vanadium oxide, which has a thermal coefficient of resistivity of ∼2%/K, will increase temperature measurement sensitivity, particularly in the range compatible with biomaterials. Additionally, microfluidic channels in this device expand its applicability to fluid samples.
PPC
Two popular types of calorimeters are DSCs and isothermal titration calorimeters (ITCs). DSC increases or decreases the temperature of the system at a given rate automatically, while monitoring any temperature differential that arises between the two cells. Minute differences between the amount of heat absorbed or released by the sample cell in comparison with the reference cell can be measured and related to the test material.
In ITC, the calorimeter maintains a constant temperature, and the concentration of an additional material added to the cells is changed. The added substance could be a ligand, which is bonded to the test material in the sample cell. The calorimeter measures the heat absorbed or released, as the newly introduced ligand binds to the test. Various information about the interaction between the test sample and the ligand (such as stoichiometry, binding constant, and heat of binding) can be determined by repeating the titration experiment using multiple additions of the ligand until binding is completed.
The idea of PPC was formed in response to the following problems. First, the analysis of volumetric characteristics of biopolymers in dilute solution has always been difficult and needed tedious experiments using densitometric or dilatometric techniques to determine partial molar volumes. The latter, measuring volume changes for biopolymer unfolding, is also problematic and most often done using large, reinforced optical cells up to high pressures. On the other hand, as the basic calorimeters can only collect data in response to changes in one intensive variable (i.e., temperature or concentration), the information that existing calorimeters obtain on the test sample is limited.
The PPC calorimeter includes: a reference cell and a sample cell, where the reference cell contains a liquid, and the sample cell contains a solution that includes the liquid and a test substance; varying the pressure above the liquid in the sample cell and the solution in the reference cell; and determining a differential heat effect between the sample cell and the reference cell in response to a change in the pressure used by the pressure system.
PPC measures heat change, resulting from a pressure change above a solution containing a dissolved substance. It leads to considerably greater accuracy for measuring critical volumetric parameters of, e.g., biopolymers in solution. Also, it provides information about biopolymer solvation currently unavailable from any other techniques. Additionally, PPC calorimeter obtains data resulting from variations in either of two intensive variables: temperature and pressure.
The device uses small pressure perturbation to solutions in a reference cell and a sample cell at different temperatures and compares the heat absorbed or released by the two cells in response to each pressure perturbation . Certain thermodynamic properties of the test substance in the sample cell can be assessed through these measurements. For instance, some PPC methods are particularly useful for determining the thermal coefficient of expansion of a macromolecule and for determining the macromolecule's volume change as it unfolds. The thermal coefficient of expansion of the substance at the known temperature could be obtained using the first and second laws of thermodynamics. However, these terms cannot be measured with sufficient accuracy using existing technology.
Technically, PPC includes a sample cell, a reference cell, and a pressure system that applies a variable pressure to the sample cell. Additionally, there is a pressure controller that controls the pressure applied by the pressure system to the sample cell. The calorimeter includes a heat-monitoring system, which subsequently determines the differences between the amount of heat absorbed or released by the sample cell and by the reference cell. This monitoring system has a temperature sensor that monitors a temperature differential between the cells when it arises in response to a change in the pressure used by the pressure system.
The sample cell is a vessel shaped to contain a liquid and a test substance (e.g., a biopolymer), and the pressure system applies the variable pressure to a liquid-holding portion of it.The reference cell is substantially identical in mass and volume to the sample cell, and it contains a liquid too.
The calorimeter has an electrical controller that is electrically coupled to the pressure controller. The electrical control system includes a software program, which causes the pressure controller to periodically vary the pressure used by the pressure system. Also, the computer program keeps in memory information sufficient to calculate the temperature differentials between the sample and reference cells.
Unfolding studies of proteins and protein stability analysis is one of the most prominent applications of PPC.As a protein unfolds by heating to a temperature higher than its melting point, the volume of the molecule changes, as hydrophobic side-chains ordinarily buried within the native protein are exposed to the exterior, and becomes solvated. This volume change is an important structural parameter and is measurable using PPC. As Palma and Curmi have indicated, the thermal expansion between folding and unfolding of proteins can help to explain and predict protein stability. Hence, the thermal expansion from the heat released or absorbed after short pressure pulses on protein solutions would be obtainable. Therefore, the data are useful in some applications, such as bioengineering studies.
PPC can also be used to determine the coefficient of thermal expansion and the volume change for molecules other than proteins. The volume change can be measured for molecules that undergo a structural transition driven by temperature, such as DNA and RNA, or certain lipid vesicles, carbohydrates, or synthetic polymers.Thermal coefficients are calculated for essentially any organic or inorganic substance, including any solute in an aqueous or nonaqueous solvent.
SRDSC
The idea of SRDSC was formed because of one disadvantage of the power-compensation systems. The problem was their effectiveness over the temperature range–170 to 730°C. Hence, the development of higher temperature DSC calorimeters has concentrated on the heat-flux design, and the self-referencing DSC was an embodiment to solve this weakness.
SRDSC technique, as a heat-flux DSC, was applied, in which the difference in heat-flow rate between the sample and the furnace is monitored against time or temperature, and the sample is subjected to a temperature program. Self-referencing DSC is a high-quality, medium-range temperature, low-cost DSC, which is used in industrial characterization and materials study.The heat-flux calorimeter measures the heat flow across a circular plate within a circular furnace in the uniform set. The heat is transferred between the furnace and the sample through the flat plate, which has a central sample location whose temperature is monitored by a thermocouple.
Multiple radial thermocouples are provided, centrally located under the sample cell, and at four reference parts at a certain distance between the furnace walls and the middle of the plate.The thermocouples provide an averaged temperature signal from which the differential signal may be derived. The signal is directly proportional to the heating rate and the Cp of the sample. Additionally, it should show improved baseline reproducibility, as there is less systematical thermal asymmetry.
SRDSC has a single position in its center to place a sample, but it has no place for a reference. This absence avoids any baseline inconsistency as a result of device asymmetry, and also, it nullifies any thermal noise at interface of the reference plate.
For demonstrating the ability of the SRDSC, the physical aging of amorphous polyethylene terephthalate (PET) was carried out at 338 K to measure low-energy transition compared with power-compensation DSC.21 The temperature at specific times would be raised at 10 K min–1, through the glass transition, to 368 K and back to 338 K at 2.5 K min–1. The process was repeated immediately to obtain the unaged glass transition, which was subtracted from each physical aging peak, and the remaining area was associated with the enthalpy of physical aging. SRDSC curves of PET at various stages of physical aging caused by physical aging were clearly significant, and the results were the same as those for power-compensation DSC reported previously.
HPer DSC
As the conventional DSC has weakness in achieving highly controlled, constant rates in cooling, the idea of supplying a DSC that can operate a bit faster or even at much higher heating rates has received a great deal of attention. The most important reasons for this aim include: most processes occur at much higher rates than are usable by conventional DSC, and some polymers and pharmaceuticals are in metastable states. Hence, the idea of HPer DSC was formed to realize suitable conditions and correlate the results of thermal analyses to make improvements in the product characteristics. In other words, HPer DSC (hyper DSC/high-speed DSC) can clarify metastability phenomena and solve its related problems.
Instrumentally, the increasing rates need a decreasing size of related components of the measuring device (such as measuring cell) to extend the thermal conductivity paths. In addition, decreasing the sample mass up to 1 μg is the other essential requirement. Consequently, this type of calorimeter should have a small furnace and offers the advantage of the power compensation in design. Thus, it provides direct flow-rate assessments and the ideal temperature control on the sample for significant results.
The existing HPer DSC, so-named power compensation Pyris 1 or Diamond DSC, has small furnaces and then precisely regulated cooling and heating rates, based on that fact that the temperature range of the measurements and the accessories have been used for cooling, respectively. Also, developing the high-speed pulse-calorimeter has realized the extremely high heating rates up to 6 × 10°C/min. In addition, development of the ultra-fast chip DSC led to the use of subnanograms of materials to achieve constant heating and cooling rates. Obtaining realistic conditions is a major challenge that occurs, for example, in high cooling rates in polymer processing. Various phenomena influence verification and crystallization of the polymer. Hence, measuring under realistic conditions by HPer DSC realizes the use of high heating rates and mimics practical conditions.
Another challenge that can be met by HPer DSC is metastability of macromolecules and pharmaceuticals. Metastability correlates to common phenomena known in thermal analyses of the materials, such as hot or cold crystallizations, recrystallization, supercoiling, amorphization, and annealing.Understanding the kinetics of metastability, related processes can be realized using the HPer DSC technique.For instance, Vanden Poel and Mathot have shown that the technique could be used as a powerful analytical tool for the study of this phenomenon in
polymer studies. They investigated the crystallization and melting behavior of some well-known polymers (such as polypropylene, polyoxymethylene, and polyamide 6 in nano- or micrometer scales) using HPer DSC with consideration of a variety of cooling and heating rates. The study cleared the capability of using accurate conditions of low or high and cooling or heating rates to assess the metastability of polymers and their related kinetics of transitions in detail. Many advantages by HPer DSC have been reported in literature. The best known of these benefits include increased sensitivity, increased production, quantitative measurements of C p and crystallinity, studying of kinetics, studying of reorganization phenomena, preventing of undesired cold crystallization and recrystallization, solid-solid transformations,matching rates occurring routinely, mimicking of rates in processing, such as extrusion and injection molding,and measuring minute amounts of materials (e.g., amorphous content in predominantly crystalline samples) less than a few micrograms in practice.
DIFFERENTIAL THERMAL ANALYSIS
Differential thermal analysis (or DTA) is a thermoanalytic technique, similar to differential scanning calorimetry. In DTA, the material under study and an inert reference are made to undergo identical thermal cycles, while recording any temperature difference between sample and reference. [1] This differential temperature is then plotted against time, or against temperature (DTA curve or thermogram). Changes in the sample, either exothermic or endothermic, can be detected relative to the inert reference. Thus, a DTA curve provides data on the transformations that have occurred, such as glass transitions, crystallization, melting and sublimation. The area under a DTA peak is the enthalpy change and is not affected by the heat capacity of the sample.
Apparatus
A DTA consists of a sample holder comprising thermocouples, sample containers and a ceramic or metallic block; a furnace; a temperature programmer; and a recording system. The key feature is the existence of two thermocouples connected to a voltmeter. One thermocouple is placed in an inert material such as Al 2 O 3 , while the other is placed in a sample of the material under study. As the temperature is increased, there will be a brief deflection of the voltmeter if the sample is undergoing a phase transition. This occurs because the input of heat will raise the temperature of the inert substance, but be incorporated as latent heat in the material changing phase. [2]
Today's Instruments
In today’s market most manufactures no longer make a true DTA but rather have incorporated this technology into a Thermogravimetric analysis (TGA), which provides both mass loss and thermal information. With today’s advancements in software, even these instruments are being replaced by true TGA-DSC instruments that can provide the temperature and heat flow of the sample, simultaneously with mass loss..
What is Differential Thermal Analysis?
- Difference in temperature, ΔT, between a sample and a reference material is measured when they are subjected to a controlled temperature program (usually T increases linearly with time).
- 10 mg of sample (s) and inert reference (r) are contained in Al pans each with thermocouple, held heating block, with thermocouple.
- Both sample and reference material must be heated under carefully controlled conditions. If the sampleundergoes a physical change or a chemical reaction, its temperature will change while the temperature ofthe reference material remains the same. That is because physical changes in a material such as phasechanges and chemical reactions usually involve changes in enthalpy, the heat content of the material.
- There is a constant temperature difference ΔT between s and r since they have different heat capacities.But when the sample undergoes an endo (exo) thermic change ΔT becomes different.
Instrumentation
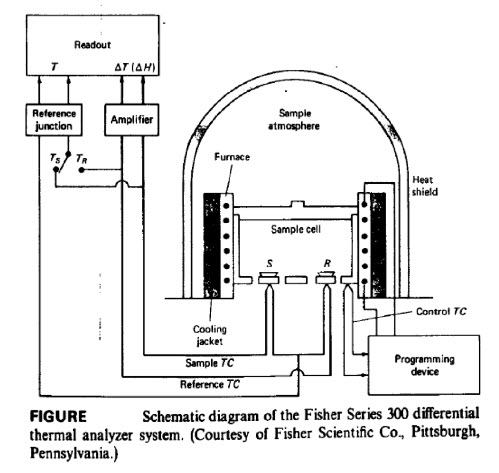
Instrumentation and working
- The sample is loaded into a crucible, which is then inserted into the sample well (marked S). A reference sample is made by placing a similar quantity of inert material (such as Al2O3) in a second crucible. This crucible is inserted in the reference well, marked R. The dimensions of the two crucibles and of the cell wells are as nearly identical as possible; furthermore, the weights of the sample and the reference should be virtually equal.
- The sample and reference should be matched thermally and arranged symmetrically with the furnace so that they are both heated or cooled in an identical manner.
- The metal block surrounding the wells acts as a heat sink. The temperature of the heat sink is slowly increased using an internal heater. The sink in turn simultaneously heats the sample and reference material.
- A pair of matched thermocouples is used. One pair is in contact with the sample or the sample container;the other pair is in contact with the reference.
- The output of the differential thermocouple, Ts - Tr or ΔT, is amplified and sent to the data acquisition system. This allows the difference in temperature between the sample and the reference to be recorded as a function of either the sample temperature, the reference temperature or time. If there is no difference in temperature, no signal is generated, even though the actual temperatures of the sample and reference are both increasing.
- Operating temperatures for DTA instruments are generally room temperature to about 1600 OC; some DTA equipments are capable of operating from -150 OC to 2400 OC. To reach the very low sub-ambient temperatures, a liquid nitrogen cooling accessory is needed. Some low temperatures (but, not -150 OC)may be reached with electrical cooling devices or with forced air-cooling.
- When a physical change takes place in the sample, heat is absorbed or generated. For example, when a metal carbonate decomposes, CO2 is evolved. This is an endothermic reaction; heat is absorbed and thesample temperature decreases. The sample is now at a lower temperature than the reference. Thetemperature difference between the sample and reference generates a net signal, which is recorded.
- Modern DTA instruments have the ability to change atmospheres from inert to reactive gases, as is donein TGA. As is the case with TGA, the appearance of the DTA thermal curve depends on the particle sizeof the sample, sample packing, the heating rate, flow
- characteristics inside the furnace, and other factors.Thermal matching between the sample and the reference is often improved by diluting the sample withthe inert reference, keeping the total masses in each crucible as close to each other as possible.
- Sample crucibles are generally metallic (Al, Pt) or ceramic (silica) and may or may not have a lid. Manymetal pans with lids have the lid crimped on using a special tool. Best results are obtained when the areaof contact between the sample and the pan or crucible is maximized.
- Samples are generally in the 1–10 mg range for analytical applications.
DTA thermogram of a polymer
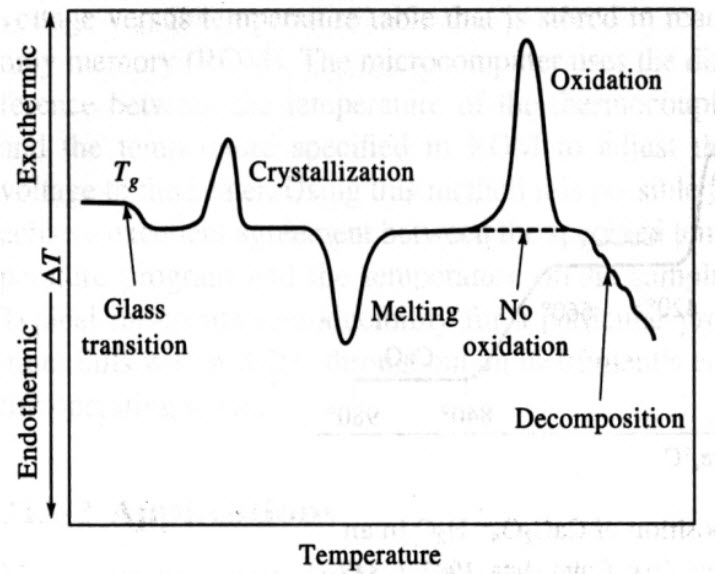
Analysis of a polymer shows several features due to physical and chemical changes, including:
Glass transition: glassy, amorphous polymer becomes flexible, ΔH = 0, but change in Cp. Often Tg ~ 2/3 Tm.
Crystallization of amorphous polymer into microcrystals is exothermic. Oxidation peak would be absent in N2 atmosphere
Applications of DTA
1. To construct phase diagrams and study phase transitions.
2. To find ΔH Peak areas depend upon sample mass, m, enthalpy change ΔH of the process, and geometric and conductivity factors such as heating rate and particle size (included in a constant k for a certain substance).
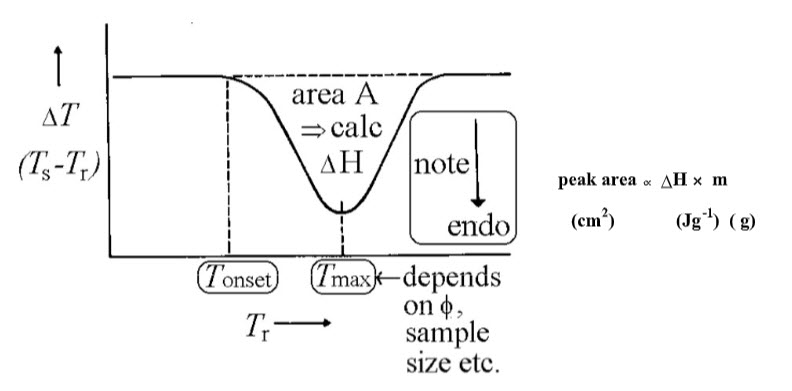
Usually the sample peak area is compared with a standard undergoing an enthalpy change at a similar T (since the calibration constant depends on T), under the same conditions, e.g. indium MPt 156.4 oC; ΔHfusion = 28.5 J g-1
1. To fingerprint substances
2. To determine M.Pt., B.Pt., decomposition temperatures of organic compounds .
3. To characterize inorganic materials
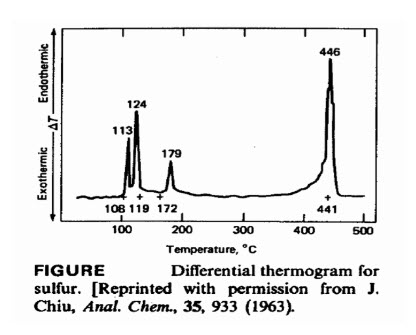
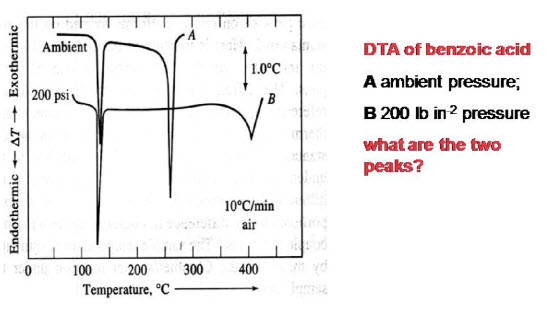
The peak at 113°C corresponds to a solid-phase change from the rhombic to the monoclinic form, whilethe peak at 124°C corresponds to the melting point of the element. Liquid sulphur is known to exist in at least three forms, and the peak at 179°C apparently involves atransition among these. The peak at 446°C corresponds to the boiling point of sulphur.
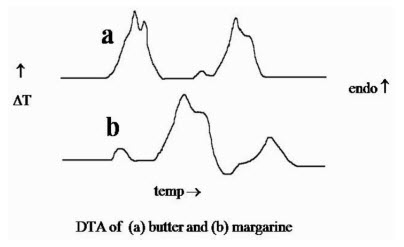
4. To quantitatively analyze polymer mixtures
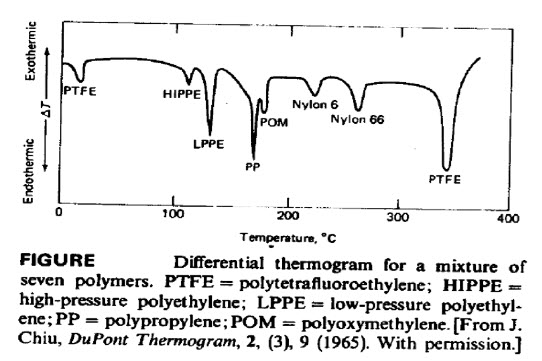
This is a thermogram of a physical mixture of seven commercial polymers. Each peak corresponds to thecharacteristic melting point of one of the components. Poly tetrafluoroethylene
(PTFE) has an additional lowtemperature peak, which arises from a crystalline transition. Clearly, differential thermal methods can be usefulfor qualitative analysis of polymer mixtures.
5. To characterize polymers
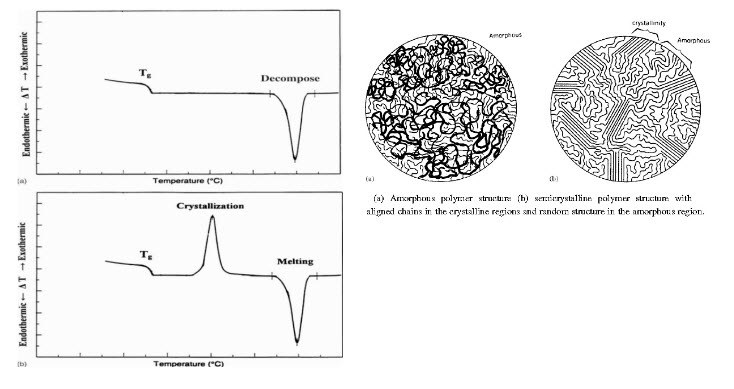
Schematic DTA thermal curves for the totally amorphous polymer structure and the semi- crystalline polymer structure. Both show Tg ; only the semi-crystalline polymer has a crystallization exotherm.
Effect of atmosphere on DTA thermogram
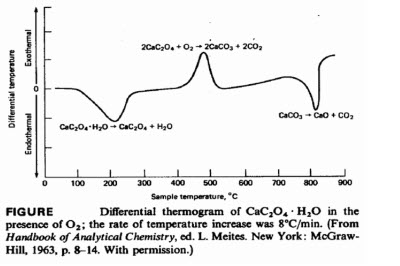
• The two minima indicate that the sample becomes cooler than the reference material as a consequence of the heat absorbed by two endothermic processes; equations for these decomposition reactions are shown below the minima.
• The single maximum indicates that the reaction to give calcium carbonate and carbon dioxide is exothermic.
• When the differential thermogram is obtained in an inert atmosphere, all three reactions are endothermic, and the maximum is replaced by a minimum; here, the reaction product from the decomposition of calcium oxalate is carbon monoxide rather than carbon dioxide.
CONCLUSION
Compatibility study in preformulation stage of formulation development is now become anessential step. The thermoanalysis provides information about the thermal stability and decomposition of drug and used excipients. DSC is a powerful technique for obtaining the thermoanalytical parameters of biomolecules and nanomaterials. Additionally, recent advances have made it possible to assess the purification yield of some pharmaceutical drugs such as antibodies.As a thermoanalytical method, the technology can predict stability of biomolecules in various environmental conditions such as pH, ionic strength, and osmolites.Some types of this instrument can reveal volumetric features of the sample in different pressures. In addition, the interaction of biomolecules and nanoparticles could be tracked via the calorimeters. An alternative technique, which shares much in common with DSC, is differential thermal analysis (DTA). Both DSC and DTA provide similar information. DSC measures the energy required to keep both the reference and the sample at the same temperature whereas DTA measures the difference in temperature between the sample and the reference when they are both put under the same heat.
REFERENCES
1. D. A. Skoog, F. J. Holler, and T. A. Nieman, Principles of instrumental analysis, 5/e, Harcourt Publishers, 2001.
2. J. W. Robinson, E. M. S. Frame, and G. M. Frame II, Undergraduate Instrumental Analysis, 6/e, Marcel Dekker, 2005.
3. P. Gabbott, Ed., Principles and Applications of Thermal Analysis, Blackwell, 2008.
4. Hohne G, Hemminger W, Flammersheim H-J. Differential Scanning Calimetry: An Introduction for Practitioners. Berlin, Germany: Springer-Verlag, 1996.
5. Privalov PL, Potekhin SA. Scanning microcalorimetry in studying temperature-induced changes in proteins. Methods Enzymol 1986;131:4–51. [PubMed]
6. Even J, Bertault M, Girard A, Délugeard Y, Marqueton Y. Optical and calorimetric studies on the role of lattice mode softening in assisting a thermally enhanced solid state reaction. Chem Phys Lett 1997;267:585–589.
7. Von Stockar U, Marison IW. The use of calorimetry in biotechnology. Bioprocess Eng 1989;40:93–136.
8. Weber PC, Salemme R. Applications of calorimetric methods to drug discovery and the study of protein interactions. Curr Opin Struc Biol 2003;13:115–121. [PubMed]
9. Varghesea N, Vivekchanda SRC, Govindaraja A, Rao CNR. A calorimetric investigation of the assembly of gold nanorods to form necklaces. Chem Phys Lett 2008;450:340–344.
10. Haynie DT. Biological Thermodynamics. Cambridge, UK: Cambridge University Press, 2008.
11. Haines PJ, Reading M, Wilburn FW. Differential thermal analysis and differential scanning calorimetry. In Brown ME, editor. (ed): Handbook of Thermal Analysis and Calorimetry, vol 1 The Netherlands: Elsevier Science BV; 1998;279–361.
12. Danley RL. New heat flux DSC measurement technique. Thermochim Acta 2002;395:201–208.
13. Zucca N, Erriu G, Onnis S, Longoni A. An analytical expression of the output of a power- compensated DSC in a wide temperature range. Thermochim Acta 2002;143:117–125.
14. Danley RL. Differential Scanning Calorimeter, European Patent 1 139 083 A1, 2001.
15. Wang L, Zhao Y, Ng E, Lid Q. A MEMS differential calorimeter for biomolecular characterization. Proceedings of the IEEE International Conference on Micro Electro Mechanical Systems (MEMS), Art. No. WP39, 2005;814–817.
16. Danley RL. Infrared Heated Differential Scanning Calorimeter, World Patent 2008 153 910 (A1), 2008.
17. Reading M, Hourston DJ. Modulated-Temperature Differential Scanning Calorimetry. New York, NY, USA: Springer, 2006.
18. Reading M. Method and Apparatus for Gas Flow Modulated Differential Scanning Calorimetry, US Patent 0 056 241 87 A, 1997.
19. Vlassak JJ, McCluskey PJ. Parallel Nano-Differential Scanning Calorimetry, US Patent 2007 286 769 A1, 2007.