About Authors:
Nitesh Solanki*, Ankit Chaudhary
Saraswati Institute of pharmaceutical sciences,
Dhanap, Gandhinagar.
*solankinitesh1188@gmail.com
Abstract:
The present research work aims to develop a simple, sensitive, accurate and reproducible method for the estimation of Moxonidine by spectrophotometric method. An absorbance maximum for moxonidine was found to be at 249 nm using methanol as a solvent. Linearity for Moxonidine was observed in concentration range of 5-15 μg/ml. The obtained correlation coefficient was 0.9979. The accuracy was evaluated by recovery study and recovery result was obtained between 98.75 % to 100.98 % and the relative standard deviation below 2% was achieved. Validation was done as per ICH guidelines. Proposed method can estimate Moxonidine in Tablet dosage form without the interference of common excipients.
REFERENCE ID: PHARMATUTOR-ART-1862
INTRODUCTION
Moxonidine (Moxo) isa selective agonist at the imidazoline receptor subtype I (I1). This receptor subtype is found in both the rostralventro-lateral pressor and ventromedial depressor areas of the medulla oblongata. Therefore causes a decrease in sympathetic nervous system activity and therefore, a decrease in blood pressure. Compared to the older central-acting antihypertensive, drug binds with much greater affinity to the imidazoline I1-receptor than to the α2-receptor. In contrast, clonidine binds to both receptors with equal affinity. In addition, it may also promote sodium excretion, improve insulin resistance and glucose tolerance and protect against hypertensive target organ damage, such as kidney disease and cardiac hypertrophy.. Chemically it is 4-chloro-N-(4, 5-dihydro-1H-imidazol-2-yl) - 6-methoxy-2-methylpyrimidin-5-amine. Moxo is available as tablet dosage form in market for the treatment of Hypertension and Cardiovascular disorder.[1-14]. The review of literature reveals that no any method is reported for estimation of Moxo individually or in combined dosage form. Therefore the present research work aims to develop a simple, sensitive and accurate method for estimation of Moxo in its dosage form by spectrophotometric method.
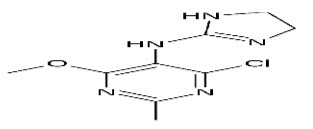
Figure 1: Structure of Moxonidine
Experimental work:
Materials
The pure drug Moxo was obtained as a gift sample from Torrent Pharmaceutical Pvt Lmt. Gandhinagar, Methanol of AR grade was purchased from Rankem (RFCL limited) New Delhi. Formulation used was Moxo tablet (Moxonidine-20 mg). The spectrophotometer used was Shimadzu UV Visible Spectrophotometer 1800 model with spectral bandwidth of 0.5 nm and wavelength accuracy (with automatic wavelength correction) of ± 0.1 nm. All the apparatus and instruments used were calibrated and validated.
Method
Preparation of Stock Solutions
The standard stock solutions of Moxo was prepared by dissolving 10 mg Moxo in methanol and final volume was adjusted with same solvent in 100 ml of volumetric flask to get strength of 200 μg/ml. Further dilution was carried out by diluting 10 ml of standard stock solution in 100 ml volumetric flask with methanol to get 100 μg/ml of Moxo.
Preparation of calibration curve
Determination of λmax of Moxo [15-16]
Standard solution of MOXO (5, 7.5, 10, 12.5 and 15 μg/ml) were scanned (Figure 2) and three different λmax (249 and 267 nm) were obtained but at 267 nm responses were not linear, So 249 nm was selected as λmax of Moxo.
Preparation of Sample Solution from Tablet Dosage form
Twenty tablets were weighed accurately and a quantity of tablet powder equivalent to 20 mg of Moxo was transferred to 100 ml volumetric flask, 80 ml of methanol was added to the same flask, sonicated for 5 min and diluted to 100 ml with methanol and filtered through Whattman filter paper No. 41. Transfer 0.5 ml of solution into 10 ml volumetric flask and dilute to the mark with methanol to get a final concentration 10 μg/ml of Moxo. The sample solution was scanned in the wavelength range of 200 – 400 nm and absorbance was measured at 249 nm. The % drug found was calculated by regration equation.
Result and Disscution: [8]
Validation of the developed method was carried out as per ICH guideline (Q2R1). Parameter such as linearity, accuracy, precision, LOD and LOQ were taken up as parameter for method validation.
Calibration Curve (Linearity)
A calibration curve was plotted over a concentration range of 5-15 μg/ml for Moxo. Accurately measured standard stock solution of Moxo (0.5, 0.75, 1.0, 1.25 and 1.5 ml) were transferred to a separate series of 10 ml of volumetric flasks and diluted to the mark with methanol. The absorbance of each solution was measured at 249 nm. Calibration curves were constructed for Moxo by plotting absorbance versus concentrations at 249 nm. Each reading was average of five determinations (Figure 3).
Precision
The intra-day and inter-day variation for determination of Moxo was carried out five times in the same day and five consecutive days and % RSD were calculated. The method was found to be precise due to low values of the %RSD (Table no1).
Accuracy (% Recovery)
Accuracy of the method was determined in terms of % recovery of standard. Recovery studies were carried out by addition of standard drug solution at the level of 50 %, 100 % and 150 % to the preanalyzed sample. In this method the known concentration standard drug was added to the assay sample. The average percent recoveries for Moxo are shown in Table 2.
LOD and LOQ
The LOD and LOQ of developed method were studied as per ICH guidelines. Several approaches for determining the LOD & LOQ are possible, depending on the procedure i.e., a non-instrumental or instrumental. Among them here employed method was,
Where, σ = the standard deviation of response,
S = the slope of calibration curve.
The results obtained are shown in Table 1.
Table 1: Optical and Regression Characteristics and Validation Parameters of Moxo
|
Parameters* |
Moxo |
|
|
λmax (nm) |
249 |
|
|
Beer’s law limit (μg/ml) |
5-15 |
|
|
Regression equation |
y = 0.0416x + 0.013 |
|
|
Standard Deviation of Slope |
0.0416 |
|
|
Standard Deviation of Intercept |
0.013 |
|
|
Correlation coefficient (r2) |
0.9979 |
|
|
Linearity Range (μg/ml) |
5-15 |
|
|
Intra-day |
Precision (%RSD) |
0.1321-1.5708 |
|
Inter-day |
0.8269-2.0538 |
|
|
LOD (μg/ml) |
0.340 |
|
|
LOQ (μg/ml) |
0.847 |
|
Table 2: Accuracy Study Data
|
Accuracy |
Amt taken |
Amt added |
Amt found |
% recovery |
s.d |
% recovery |
|
50% |
3 |
3 |
5.9221 |
98.7019 |
0.4484 |
98.702 ± 0.45 |
|
100% |
3 |
6 |
9.0682 |
100.7585 |
0.2531 |
100.76 ± 0.25 |
|
150% |
3 |
9 |
12.0667 |
100.5608 |
0.1351 |
100.56 ± 0.13 |
*Average of five determination, SD=standard deviation
Table 3: Result of Tablet Analysis
|
Brand Name |
Label Claim (mg) |
Amount Found (mg)* |
% Amount Found*± S.D. |
|
Moxo |
20 |
19.83 |
19.83±0.19 |
* Mean of five estimations
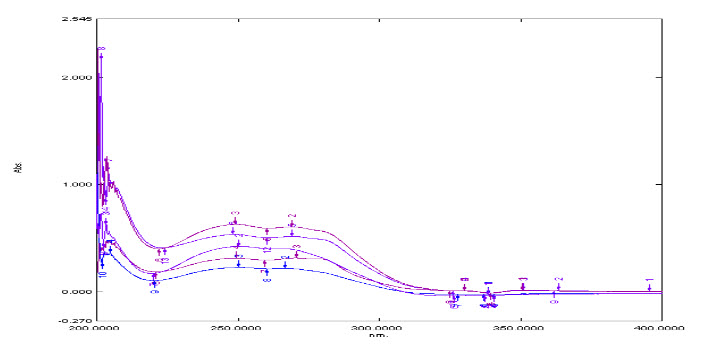
Figure 2: Overlay spectra of Moxo
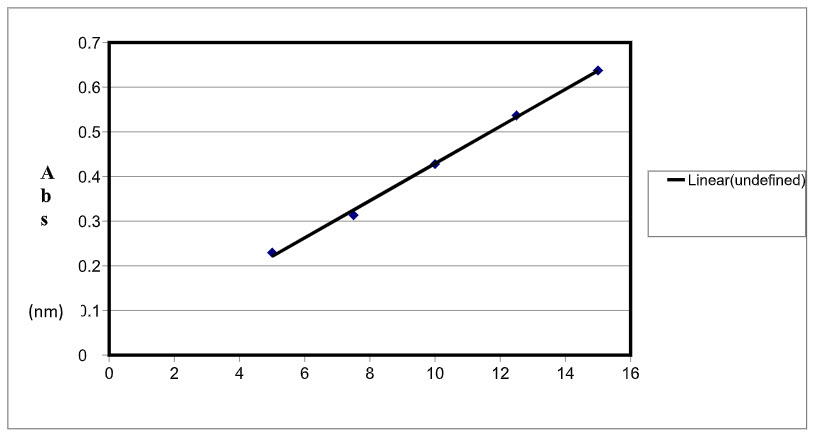
Figure 3: Calibration curve of Moxo at 249 nm
DISCUSSION
The calibration graph for Moxo was constructed by plotting the absorbance versus their corresponding concentrations Good linearity was found over the range of 5-35 μg/ml. Calibration curve of Moxo is shown in Figure 3. Beer’s law was obeyed in the concentration range of 5-15 μg/ml and correlation coefficient was found to be 0.9979. The proposed method was also evaluated by the assay of commercially available Moxo tablet (n = 5). The % average assay was found to be 99.15 % (Table 3). The accuracy of the method was further assessed by applying the standard addition technique. The results obtained indicate the additives present do not interfere with analysis of the tablet. The proposed method has been applied to the assay of Moxo in tablet dosage form.
CONCLUSION
All these factors lead to the concluded that the proposed method is accurate, precise, simple and sensitive and can be applied successfully for the estimation of Moxo in tablet without interference.
Acknowledgments
The authors are thankful to Torrent pharmaceutical Pvt. Ltd. for providing gift sample of Moxo. The authors are also thankful to Saraswati Institute of Pharmaceutical Sciences, Dhanap, Gandhinagar for providing all facilities require to complete work.
REFERENCES AND NOTES
1.Joel G, Lee L, Goodman and Gilman’s, The Pharmacological basis of therapeutics; 10th Edn, International Edition; McGraw Hill Publishers Medical Publishing Division, New York, 2001,pp 829,859-860.
2.Net Doctor, “ clinical pharmacology of Hypertension”, December 2012
netdoctor.co.uk/ate/Hypertension
3.Parfit KM., The complete drug reference; 35th Edn; Pharmaceutical press, London UK, Vol-1, 2007, pp 1034-1037.
4.Rang H, Dale M, Ritter J, Moore P., Pharmacology; 5th Edn; Churchill Livingstone, Elsevier Science Ltd, 2003, pp 307.
5.Barar F, Essentials of Pharmacotherapeutics, S.Chand & Comapany Ltd; Reprint 2004, pp 298-301, 239-49.
6.Page C., Curtis M., Walker M., Hoffman B., Integrated Pharmacology; 3rd Edn;, Mosby Elsevier, 2006, pp 324-326.
7.Tripathi K., Essential of Medical Pharmacology; 5th Edn; New Delhi, Jaypee Brothers Medical Publishers, 2003, pp 48-52.
8.Dipiro J., Talbert R., Yee G., Matzke G., Wells B., Posey L., Pharmacotherapy- A Pathophysiological Approach; 6th Edn; The Mc Graw- Hill companies, 2005, pp 429-452.
9.Minneman K., Wecker L., Larner J., Brody T., Brody’s Human Pharmacology - Molecular to clinical; 4th Edn; Elsevier Mosby, 2005, pp 235-250.
10.Basic information of antihypertensive drug, October 2012 mims.com/India/drug/info/antihypertensive drug/
11.Wikipedia, ”Antihypertensive class of drug”, October 2012 en. wikipedia.org/wiki/Antihypertensive drug/
12.Messerli f., “Drug: a new and versatile antihypertensive”, J. cardio. Pharmacol. 2000, 35(4), 53-56.
13.Schechter M., Mitchell G, Niziol C., Abhyankar B.,” Antihypertensive efficacy of drug in primary care: a 'real-life' study”, Int. j. clini., 2003, 57, 479-482.
14.CDSCO, “List Of New Drugs Approved 2007”, October 2012
cdsco.nic.in/list_of_new_drugs_approved_jan2007/
15.Connors AK., Textbook of Pharmaceutical Analysis; 3rd Edn, A Wiley Intersciences Publication, 1999, pp173-234.
16.Davidson AG., Beckett AH., Stenlake JB., Practical Pharmaceutical Chemistry; 4th Edn, CBS Publishers, 2002, part-2, pp 275-337.
17.International Conference on Harmonization Q2 (R1), Validation of analytical procedures: text and methodology, International Conference on Harmonization, IFPMA, Geneva, 2005.
NOW YOU CAN ALSO PUBLISH YOUR ARTICLE ONLINE.
SUBMIT YOUR ARTICLE/PROJECT AT articles@pharmatutor.org
Subscribe to Pharmatutor Alerts by Email
FIND OUT MORE ARTICLES AT OUR DATABASE