{ DOWNLOAD AS PDF }
 ABOUT AUTHORS
Durgesh Rameshlal Parakh1*, Jayshri K. Madagul1, Harshad Rajendra Mene2, Moreshwar P. Patil1, Sanjay J. Kshirsagar1
1 Department of Pharmaceutics,
MET’s Institute of Pharmacy, Adgaon, Nashik, Maharashtra, India.
2 Department of Pharmaceutics,
Government College of Pharmacy, Osmanpura, Aurangabad, Maharashtra, India.
*aryanparakh57@gmail.com
ABSTRACT
A new simple and sensitive RP-HPLC method was developed and validated for quantification of Mebendazole in Active Pharmaceutical Ingredient (API) and pharmaceutical formulation.The gradient RP-HPLC method was developed on Agilent (India) C18 250 × 4.6 mm, 5 μ column using mobile phase as acetonitrile: water pH 3.0 with orthophosphoric acid (90:10 v/v) at a flow rate of 1 mL/min and detection was carried out at 234 nm using UV-Visible detector (UV 3000 M). The method was validated linearity, limit of detection, limit of quantification, precision, ruggedness, robustness, accuracy and specificity were found to be satisfactory. The method was found to be linear in the concentration range of 20-100 μ/mL with correlation coefficient of 0.999. The method was validated according to the ICH guidelines and was proved to be specific, linear, accurate, precise and economical for the analysis of Mebendazole.
[adsense:336x280:8701650588]
REFERENCE ID: PHARMATUTOR-ART-2409
|
PharmaTutor (Print-ISSN: 2394 - 6679; e-ISSN: 2347 - 7881) Volume 4, Issue 5 Received On: 21/12/2015; Accepted On: 04/01/2016; Published On: 01/05/2016 How to cite this article: Parakh DR, Madagul JK, Mene HR, Patil MP, Kshirsagar SJ; RP-HPLC method development and validation for Quantification of Mebendazole in API and Pharmaceutical Formulations; PharmaTutor; 2016; 4(5); 46-51 |
INTRODUCTION
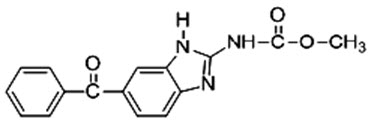 Figure 1. Chemical structure of Mebendazole
Mebendazole, methyl (5-benzoyl-1H-benzimidazol-2yl) carbamate[1] (Figure 1), is broad spectrum anthelmintic agent[1]. It is active against nematodes infections like whipworm (Trichuris trichura), threadworm (Enterobius vermicularis), roundworm (Ascaris lubricoides), hookworm (Ancylostoma duodenale, Necator americanus), etc[1]. It is BCS class II drug having low aqueous solubility (71.3 mg/L) and High permeability (Log P = 2.8) which may leads to variable absorption of mebendazole [1]. It undergo extensive hepatic first pass metabolism [2]. It has very low bioavailability (5-10%) and maximum amount of drug is protein bound (90-95%) [1-2].
Analysis of the drug is the most important for the formulation development. Hence there is a need to develop a validated method for the analysis of Mebendazole from API and pharmaceutical formulations. It is white to slightly yellow, amorphous powder, almost odourless. It is practically insoluble in water, alcohol, methylene chloride, ether, chloroform and in dilute mineral acids whereas freely soluble in formic acids [1-3]. It irreversibly block glucose uptake in susceptible helminthes, thereby depleting glycogen stored in parasites [1-3]. It is official in Chin., Eur., Int., US, British, Indian, and Viet. Pharmacopoeia [4]. It is available as chewable tablet, suspension and sachets in market [4]. It is given as 100 mg twice daily for 3 consecutive days. Repeated after 2-3 weeks if needed (to kill ova developed later) [3]. The estimation of Mebendazole in bulk and in tablet dosage form was done by UV [5-6] and RP-HPLC method in alone or combination with forced degradation studies [7-14]. There are many reported methods for analysis of Mebendazole either alone or in combination with other drugs in pharmaceutical dosage forms or individually in biological fluids. The quantification of Mebendazole in human plasma by LC-MS has been reported The estimation of Mebendazole in bulk and in tablet dosage form was done by UV and RP-HPLC method in alone or combination with forced degradation studies [7-14]. There is a need for a simple, rapid, cost effective and reproducible method for development of Mebendazole. Therefore objective of the study was to develop a simple, accurate, precise, cost effective and reproducible RP-HPLC method for estimation of mebendazole as per International Conference on Harmonization (ICH) guidelines Q2(R1) [15].
MATERIALS AND METHODS
Materials
Mebendazole was gifted from Holden Pharmaceuticals (Nashik, India). Methanol was purchased from Merck (Mumbai, India). The aceotonitrile (ACN) was obtained from Fischer scientific co. (Mumbai, India). Aerosil 200 was purchased from Research lab fine chem Industries (Mumbai, India). The HPLC grade water was produced by double distillation method in laboratory. Membrane filters of 0.45 μ was of Millipore pvt. Ltd. (Bangalore, India). All the chemicals and reagents used were of analytical grade.
Equipment
It consist of RP-HPLC (Agilent, India) equipped with binary pump (P-3000 M, reciprocating), UV/Visible detector (UV 3000 M) and Rheodyne injector port with 20 μL loop. The output signal was monitored and processed using HPLC Workstation software. Greece C18 column (250 × 4.6 mm; 5μ particle size) was purchased from Phenomenex (USA).
[adsense:468x15:2204050025]
EXPERIMENTAL
Method Development
Solvent Selection
Various solvents like water, methanol, chloroform, acetonitrile were selected for the solubility and stability study and it was found that Mebendazole was soluble in the following solvents; formic acid, N, N-dimethyl formamide, 0.5 M methanolic hydrochloride, etc.In the present investigation 0.5 M methanolic hydrochloride was selected as a solvent.
Chromatographic conditions
Chromatographic analysis was performed on HPLC column at 40o C. The mobile phase consisted of ACN: Water pH 3.0 with orthophosphoric acid (90:10 v/v). The mobile phase was degassed in an ultrasonic bath (PCI analytics, India).
Preparation of standard solution
Standard stock solution was prepared by dissolving accurately weighed 10 mg of mebendazolein 50 mL of solvent (0.5 M methanolic hydrochloride). Keep it on sonicator bath for 15 min. After 15 minutes, the volume was made up to the mark with 100 mLvolumetric flask with same solvent to give a solution of 100 mg/mL.
Analysis of formulation
Weight equivalent to 10 mg was weighed accurately. Transferred it to 100 mL volumetric flask, dissolved in 50 mL of 0.5 M methanolic hydrochloride by ultrasonication of the flask for 15 minutes and volume was made up to the mark with respective solvent.
Validation of the method [15]
System suitability
The system suitability was determined by calculating retention time, no. of theoretical plates (T. plate no.) and tailing factor (asymmetry). It was resulted from HPLC method analysis of Mebendazole.
Linearity and range
The linearity of an analytical procedure is its ability (within a given range) to obtain test results which are directly proportional to the concentration (amount) of analyte in the sample. The range of an analytical procedure is the interval between the upper and lower concentration (amounts) of analyte in the sample (including these concentrations) for which it has been demonstrated that the analytical procedure has a suitable level of precision, accuracy and linearity.
The linearity of the analytical method was demonstrated over the concentration range of 20-100 µg/mL of the target concentration for both the drugs. Aliquots of 2, 4, 6, 8 and 10 mL were pippeted out from working standard solution into series of 100 mL volumetric flasks. The volume was made up to the mark with 0.5 M Methanolic Hydrochloride. The calibration curve was obtained by plotting peak area versus concentration.
Limit of Detection (LOD)
The detection limit is the lowest amount of analyte in a sample which can be detected but not quantitated.
LOD = 3.3 × σ/S
Where,
σ = standard deviation of response and S = slope of calibration curve
Limit of Quantification (LOQ)
The quantitation limit is the lowest amount of analyte in a sample which can be quantitatively determined.
LOD = 10 × σ/S
LOD = 3.3 × σ/S
Where,
σ = standard deviation of response and S = slope of calibration curve
Precision
The precision of an analytical procedure expresses the closeness of agreement (degree of scatter) between a series of measurements obtained from multiple sampling of the same homogeneous sample under the prescribed conditions. Precision may be considered at three levels: repeatability (intra-day), intermediate precision (inter-day)and reproducibility. In order to determine the repeatability of method, three different concentration solutions of 48, 60, 72 µg/mL of mebendazole solution were prepared in triplicate (n = 3). The intermediate precision was determined by analyzing 3 samples (n = 6) of 60 μg/mL on three consecutive days. Recovery (%), relative standard deviation i.e. RSD (%) and standard error (SE) were calculated.
Ruggedness
The ruggedness is degree of reproducibility of test results under verify of condition like different analysts, different instruments and different days.
To establish ruggedness of the proposed method the solutions of 60 µg/mL of Mebendazole standard solution was prepared and analyzed with the change in the different analyst.
Robustness
The robustness of an analytical procedure is a measure of its capacity to remain unaffected by small, but deliberate variations in method parameters and provides an indication of its reliability during normal usage.
The robustness of the proposed method the solutions of 60 µg/mL of mebendazole standard solution was prepared and analyzed by changing flow rate. The flow rate was selected as deviated to normal flow rate ± 0.1 mL/min i.e. 0.9 and 1.1 mL/min for Mebendazole standard solution.
Accuracy
The value which is accepted either as a conventional true value or an accepted reference value and the value found. This is sometimes termed trueness. Accuracy of proposed method was ascertained on the basis of recovery study. Recovery studies were carried out by spiking standard working solution to preanalyzed sample solution (formulation) at three different levels 80 %, 100 % and 120%. Each sample was prepared in triplicate (n = 3) and all the samples were analyzed by the proposed method. Recovery (%), relative standard deviation i.e. RSD (%) and standard error (SE) were calculated.
Specificity
Specificity is the ability to assess unequivocally the analyte in the presence of components which may be expected to be present. Typically these might include impurities, degradants, matrix, etc.
Specificity was done by using an excipient, Aerosil 200 (adsorbent). The three different concentrations of standard solution at three levels 80 %, 100 %, 120 % respectively was spiked on Aerosil 200 concentration (60 µg/mL). At each levels of the amount, three determinations were performed to check effect of Aerosil 200. Recovery (%), relative standard deviation i.e. RSD (%) and standard error (SE) were calculated.
NOW YOU CAN ALSO PUBLISH YOUR ARTICLE ONLINE.
SUBMIT YOUR ARTICLE/PROJECT AT editor-in-chief@pharmatutor.org
Subscribe to Pharmatutor Alerts by Email
FIND OUT MORE ARTICLES AT OUR DATABASE
RESULTS & DISCUSSION
Method Development
Various solvent mixtures were tried for the analysis of Mebendazole. However, ACN: Water in the ratio of 90:10 (v/v) was given sharp peak with and good symmetry. The flow rate was set depending on the peak shape, tailing factor and time required for the analysis. The chromatogram was shown in Figure 2.
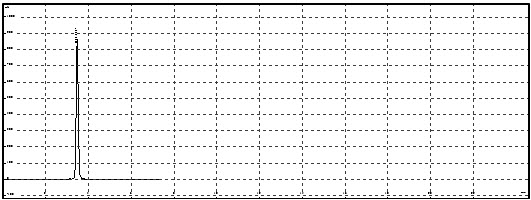
Figure 2.HPLC chromatograph of 100 μg/mL standard
Validation of the method
System suitability
Table 1. System suitability parameter for Mebendazole 100 μg/mL standard
|
Sr.No |
Parameter |
Mean ± SD* |
|
1 |
RT |
3.473 ± 0.0095 |
|
2 |
Area |
6249868 ± 39.3573 |
|
3 |
T. plate no. |
5516.67 ± 1.5275 |
|
4 |
Asymmetry |
1.1 |
|
5 |
Run time |
7.3733 ± 0.00577 |
*(n = 3)
System suitability parameters were evaluated and the values were shown in Table 1. These values are within given range mentioned in ICH guidelines and hence method proved to specific and precise. All the parameters were proved that the chromatographic system used was suitable for the analysis of Mebendazole in API and formulations.
Linearity and range
The calibration curve of Mebendazole was plotted using peak area vs. concentration and shown in Figure 3. The method has shown good linearity for Mebendazole (R2 = 0.9829) in the concentration range of 20-100 μg/mL.
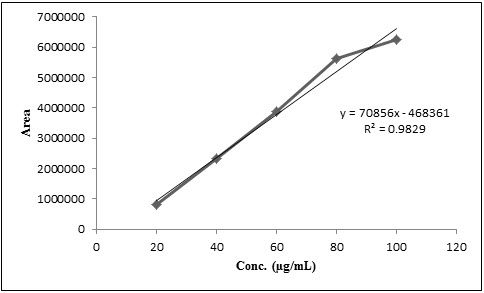
Figure 3. Calibration curve of Mebendazole
Limit of Detection (LOD) and Limit of Quantitation (LOQ)
The limits of detection (LOD) and limits of quantitation (LOQ) which represents the sensitivity of the proposed method were determined. The LOD and LOQ value obtained are 3.77 μg/mL and 12. 29 μg/mL respectively. It indicates the high sensitivity of the proposed method. The low values of LOD and LOQ indicates that the method can be used for detection and quantification of Mebendazole over a very wide range of concentration.
Precision
Precision of proposed method was determined by intra-day and inter-day precision and it was expressed in terms of percent relative standard deviation (% RSD). For Intra-day and Inter-day precision % RSD were found in the range of 0.002958-0.01846 and 0.03823-0.0902 respectively. Results of precision study are summarized in Table 2 and Table 3. As the %RSD was found to be very less (<2%), which limits of ICH guidelines and the method proved to be reproducible.
Table 2.Intra-day precision study
|
Sr. No. |
Conc. (μg/mL) |
Mean area |
% Recovery (RSD) ± SE |
|
1 |
48 |
2895946 ± 534.67 |
98.92 (0.018463) ± 308.6931 |
|
2 |
60 |
3785904 ± 111.98 |
100.07 (0.002958) ± 64.6555 |
|
3 |
72 |
4583105.33 ± 321.06 |
99.02 (0.007005) ± 185.3657 |
*(n = 3)
Table 3. Inter-day precision study
|
Sr. No. |
Conc. (μg/mL) |
Mean area ± SD |
% Recovery (RSD) ± SE |
|
1 |
48 |
2895700.67 ± 1107.11 |
98.91 (0.038233) ± 639.1886 |
|
2 |
60 |
3785605.33 ± 3413.83 |
100.06 (0.0902) ± 1970.9771 |
|
3 |
72 |
4581772 ± 1847.63 |
98.99 (0.040326) ± 1066.73146 |
*(n = 3)
Ruggedness
In the ruggedness study, the influence of small, deliberate variations of the analytical parameters on area of drug was examined. The factor selected was change in analyst. Results of ruggedness study indicate that the selected factor remained unaffected by small variations with % RSD of 0.0037-0.0568, which confirms the ruggedness of method. Results are shown in Table 4.
Table 4. Ruggedness data for Mebendazole
|
Sr. No. |
Level of addition |
Conc. (μg/mL) |
Mean area ± SD* |
% Recovery (RSD) ± SE* |
|
1 |
80% |
48 |
2895667 ± 107.69 |
98.91 (0.0037) ± 62.1798 |
|
2 |
100% |
60 |
3784113 ± 2149.53 |
100.02 (0.0568) ± 1241.03 |
|
3 |
120% |
72 |
4583987 ± 693.99 |
99.03 (0.0151) ± 400.678 |
*(n = 3)
Robustness
In the robustness study, the influence of small, deliberate variations of the analytical parameters on area of drug was examined. The factor selected was change in flow rate. Results of robustness study indicate that the selected factor remained unaffected by small variations with % RSD of 0.0006-0.1165, which confirms the robustness of method. Results are shown in Table 5.
Table 5. Robustness data for Mebendazole
|
Sr. No. |
Flow rate (mL/min) |
Mean area ± SD* |
% Recovery (RSD) ± SE* |
|
1 |
0.9 mL/min |
3695330 ± 4305.7 |
97.93 (0.1165) ± 2485.9 |
|
2 |
1 mL/min |
3784113 ± 2149.53 |
100.02 (0.0568) ± 1241.03 |
|
3 |
1.1 mL/min |
3819364 ± 693.99 |
100.85 (0.0006) ± 13.3167 |
*(n = 3)
Accuracy
The accuracy of method was ascertained by performing recovery study at three concentration levels i.e. 80%, 100% and 120%. The percent recovery obtained indicates non-interference from the excipients used in the formulation. The results of recovery study are given in Table 6.
Table 6. Statistical validation of recovery studies
|
Level of addition |
Standard API (μg/mL) |
Formulation stock added (μg/mL) |
Mean area ± SD* |
% Recovery (RSD) ± SE* |
|
80% |
48 |
48 |
7180675 ± 11.27 |
99.96 (0.00016) ± 6.5064 |
|
100% |
60 |
60 |
7990769 ± 190.535 |
99.49 (0.00238) ± 110.006 |
|
120% |
72 |
72 |
8791809 ± 126.95 |
99 (0.00144) ± 73.2947 |
*(n = 3)
Specificity
The specificity of proposed method was ascertained by performing study at three concentration levels i.e. 80%, 100% and 120%. The mean recovery of added excipient at each level was found to be 97.82-99.18%. The % RSD was found to be 0.04402-0.1533. The percent recovery obtained indicates non-interference from the excipients used in the formulation. The results of specificity study are given in Table 7.
Table 7. Statistical validation of specificity studies
|
Level of addition |
Standard API (μg/ml) |
Aerosil 200 added (μg/mL) |
Mean area ± SD* |
% Recovery (RSD) ± SE* |
|
80% |
48 |
48 |
2892868 ± 2542.64 |
98.83 (0.08789) ± 1467.99 |
|
100% |
60 |
60 |
3748055 ± 5745.44 |
99.18 (0.1533) ± 3317.13 |
|
120% |
72 |
72 |
4521880 ± 1990.75 |
97.82 (0.04402) ± 1149.36 |
*(n = 3)
The results of validation parameters showed that proposed method was found to be simple, accurate, economic, sensitive, and precise and can be adopted for estimation of mebendazole in API and formulation.
CONCLUSION
The developed RP-HPLC method was found to be simple, sensitive, accurate, precise, and reproducible. The values of % recovery was close to 100% indicating reproducibility and accuracy of the proposed method shows that the method could find practical application hence, utilized as routine quality control analysis.
Acknowledgement: The author is thankful to principal, MET’S Institute of Pharmacy, Bhujbal Knowledge City, Nashik for providing facilities to carry out the research work. The author wishes to express his gratitude to Holden Pharmaceuticals (Sinner, Nashik, India) for providing gift sample of Mebendazole.
REFERENCES
1. Block J. H. and Beale, J. M. Wilsons and grisvolds textbook of organic medicinal and pharmaceutical chemistry, 11th ed. Lippincott Williams and Wilkins, Philadelphia; 2004; pp. 265-266, 953.
2. Maryadele J.O. The Merck Index, 14th ed. Merck research laboratories, Merck & Co., Inc., Whitehouse station, NJ, USA; 2006; pp. 5768.
3. Sweetman S.C. Martindale The complete drug reference, 36th ed. Pharmaceutical press, London; 2009; pp. 108.
4. United States Pharmacopoeial Convention. The United States Pharmacopoeia 29, National Formulary 24, Twinbrook parkway, Rockville MD; 2006; pp. 1316.
5. Parakh D.R., Patil M.P., Sonawane S.S. and Jain C.P. Development and Validation of Spectroscopic Method for Estimation of Mebendazole in Bulk and Pharmaceutical Formulation. World J Pharm Res; 2015; 4(7):2223-2235.
6. Swamy N., Prashanth K.N. and Basavaiah K. Spectrophotometric assay of mebendazole in dosage forms using sodium hypochlorite. J App Spect; 2014; 81(3):525-533.
7. Turabi Z.M., Khatatbeh O.A., Al-Abed D.N. RP-HPLC method development and validation for the simultaneous determination of mebendazole and the two preservatives methylparaben and propylparaben in pharmaceutical oral suspension dosage form. Int J Pharm Sci Drug Res; 2014; 6(1):70-74.
8. Al-Kurdi Z.I., Al-Jallad T. and Jaber A.M.Y. High Performance liquid chromatography method for determination of methyl 5-benzoyl-2 benzimidazole carbamate (mebendazole) and it’s main degradation product in pharmaceutical dosage forms. Talanta; 1999; 50(5):1089-1097.
9. Argekar A.P., Raj S.V., Kapadiya S.U. Simultaneous determination of mebendazole and pyrantel pamoate from tablets by high performance liquid chromatography- reverse phase (RP-HPLC). Talanta; 1997; 44(11): 1959-1965.
10. Kulik A., Bialecka W., Podolska M., Puchniarz B.K. and Mazurek A. HPLC method for identification and quantification of benzimidazole derivatives in antiparasitic drugs. 2011; 68(6); 823–829.
11. Orsine E.M., Kedor-Hackmann E.R. and Santoro M.I. Simultaneous determination of thiabendazole and mebendazole in tablets by high performance liquid chromatography. Drug Dev Ind Pharm; 2000; 26(8):879-883.
12. Paula N.K. and Sena M.M. Validation of analytical methodology for simultaneous evaluation of mebendazole and thiabendazole in tablets by high performance liquid chromatography. Quimica Nova; 2013; 30(5);1-5.
13. Rao R.K., Agarwal N.K., Pavami K.H., Kumar B.P. and Mallikarjuna R. Analytical method development and validation for the simultaneous estimation of levamisole and mebendazole in bulk & tablet formulation by RP-HPLC method. Ind J Res Pharm Biotech; 2014; 952–957.
14. Su S.C., Chang C.L., Chang P.C., Chou S.S. Simultaneous determination of albendazole, thiabendazole, mebendazole and their metabolites in livestock by high performance liquid chromatography. J Food Drug Anal; 2003; 11(4):307–319.
15. ICH: Harmonised Tripartite Guideline, Validation of Analytical Procedures: Text and Methodology Q2 (R1); Nov 2005: 4-5.
NOW YOU CAN ALSO PUBLISH YOUR ARTICLE ONLINE.
SUBMIT YOUR ARTICLE/PROJECT AT editor-in-chief@pharmatutor.org
Subscribe to Pharmatutor Alerts by Email
FIND OUT MORE ARTICLES AT OUR DATABASE