{ DOWNLOAD AS PDF }
ABOUT AUTHORS:
Sagarika Panda1*, Srikanta Patra2
1 Jawaharlal Nehru Technological University Hyderabad, Kukatpally, Hyderabad, Andhra Pradesh, India;
2 National Institute of Pharmaceutical Education & Research (NIPER), Ahmedabad, Gujarat, India
*niperhsagarika@gmail.com
ABSTRACT
A highly sensitive, selective, reproducible, rapid and stability indicating RP-HPLC and spectrophotometric method has been developed and validated successfully for quantitative evaluation of ivabradine hydrochloride formulations. Chromatography was carried out at 25ºC on a 250 mm x 4.6 mm, 5µm, C18, 100Aº Kromasil column with phosphate buffer pH 7.4: methanol:: 35:65 and U.V. detector at λmax 286 nm. In HPLC method the retention time was about 7.4 minutes. Complete validation study for both the methods was carried out according to ICH guideline. Both methods were found to be selective, linear, accurate and precise in the specified ranges. Linearity of both the methods was achieved in the range 5 to 60 μg/ml with a correlation coefficient (r2) ≥ 0.999. The LOD and LOQ of HPLC method were 0.05 and 0.2 µg/ml, respectively. Intra-day and inter-day variability for both methods were <2% RSD. These methods were successfully used for quantification of ivabradine in drug-release studies from immediate-release tablets and controlled-release (CR) formulations.
INTRODUCTION
Ivabradine is a specific heart rate lowering agent, acting by reducing the rate of pacemaker activity in the sinoatrial node. Chemically 3-[3-({[(7S)-3,4-dimethoxybicyclo[4.2.0]octa-1, 3, 5-trien-7yl]methyl}methylamino)propyl]-1,3,4,5-tetrahydro-7,8-dimethoxy-2H-3-benzazepin -2-one and available in the form of hydrochloride salt. It is the first of the exciting new class of drugs that has the ability of slowing the depolarization slope, reducing heart rate to a degree similar to that achieved at rest with β-blockers. It selectively and specifically inhibits the cardiac sinus node ion channel, acting at the f-channel (If), an important current involved in generating the early phase of spontaneous diastolic depolarization in pacemaker cells, thereby reducing the frequency of action potential initiation and increasing the time required to reach the voltage threshold for action potential initiation, slowing the spontaneous firing and therefore heart rate. It reduces heart rate while maintaining myocardial contractility and atrioventricular conduction[1]. It is indicated in the treatment of chronic stable angina pectoris with normal sinus rhythm, where there is contraindication (eg, asthma, chronic obstructive pulmonary disease (COPD), or peripheral vascular disease) or intolerance to β-blockers [2].
Ivabradine is freely soluble in water, methanol, and acetonitrile. The drug is a basic drug and having pKa values≈ 8.02. Literature survey revealed that, analytical methods like LC with fluorescence detector and LC with tandem mass spectrometric detector for determination of ivabradine in biological samples were reported, however, all these involve long run times with complex extraction procedures[3-6]. Method for determination and quantification of ivabradine in bulk drug and pharmaceutical dosage form has also been reported[7-8] but no report of validation of the methods for forced degradation studies. As analysis of dosage forms under stability study is an important step for drug approval, analytical method should be validated so that the method will be good enough to detect any impurity originated in the dosage form during stability study. Though a stability indicating HPLC Method has been reported, it has its own limitation[9] by using formic acid as a buffer in the mobile phase.
Further, controlled release dosage form is evaluated with different dissolution media. No literature teaches about an analytical method which can be used to evaluate the controlled release formulation. So, a simple and specific RP-HPLC method using phosphate buffer in the mobile phase, with short run time was developed for the quality control analysis of ivabradine in compatibility samples, stability samples and also in dissolution samples as useful for analysis of controlled release formulation.
MATERIALS AND METHOD
Reagents, formulations and equipment
Ivabradine was supplied by Themis Medicare Ltd. (Mumbai, India) as gratis sample. The purity of the supplied ivabradine was 99.5% by HPLC analysis. All reagents used were of analytical grade and the solvents used were HPLC grade (Qualigens Fine Chemicals, Mumbai). Water used for HPLC was obtained after reverse osmosis (Millipore Mili-Q system) of triple distilled water. Four controlled release formulations of ivabradine with different excipients, different method of preparation were used to evaluate the developed methods. A HPLC system (Shimadzu Corporation, Japan) with a LC-10ATVP Shimadzu pump (Japan), UV detector SPD-M10AVP Shimadzu (Japan), and PDA detector SPD-M10AVP Shimadzu (Japan), system controller SCL-10AVP Shimadzu (Japan), Class- VP system manager software. A 250 mm x 4.6 mm, 5µm, C18, 100AºKromasil column (Sigma-Aldrich, US) with 10 mm x 4.6 mm, 5µm, C18, 100AºKromasil precolumn (Kromasil Eternity C18 Guard Cartridge by Sigma-Aldrich, US) was used for elusion.
Methods
UV spectrophotometric method and its validation
Preparation of Stock (100µg/ml) and standard Solution: Three stock solutions of ivabradine (100µg/ml) was prepared using Hydrochloric Acid Buffer pH 1.2, Phosphate Buffer solution pH 6.8 and demineralized water by dissolving the drug in a 100 ml volumetric flask in methanol, made upto the mark with respective media and shaken for 2 min on a mechanical shaker operated at 50 motions/min. Further dilution was made to achieve concentrations of 5, 10, 15, 20, 25, 30, 35, 40, 45, 50, 55 and 60µg/ml.
Analytical procedure: The standard drug solution (10µg/ml) using three different media was scanned in UV- Vis spectrophotometer (UV-2400PC Series, Shimadzu, Japan) over wavelength of 200nm-700nm. λmax was traced and calibration curve of absorbance at 286 nm versus concentration of standard solutions was constructed.
Method validation: The proposed method was validated for drug specificity, linearity, accuracy and precision. Dummy tablets and excipient blends, which contained selected excipients in the proportions as expected in the final formulations, were used to validate the method for specificity and recovery. Linearity of seven standard solutions with concentrations evenly distributed across the range 10–120% of drug assay (i.e. 5, 10, 20, 30, 40, 50 and 60µg/ml) in three dissolution media was established. Accuracy and precision was assessed using three replicates of three concentrations in the range and with six replicates for 100% drug release (i.e. 50µg/ml). To assess intra-day variation, calibration curve was prepared three times on the same day. The procedure was further repeated on three consequent days for determination of inter-day variability[10]. The results were expressed as %RSD of slopes and intercepts and 95% confidence intervals.
RP-HPLC method and its validation
Reagents and solutions: Mobile phase consisting of Methanol: 0.01M phosphate buffer pH 7.4 in the proportion of 65:35 was prepared. Mobile phase was filtered through 0.22μm nylon filter (Millipore) and deaerated in ultrasonic bath (Ultrasonic Cleaning Bath, Model UCB – 30, Spectra Lab).
Preparation of Stock (1000µg/ml) and Standard Solution: The standard stock solution of ivabradine HCl (1000µg/ml) was made in a 100 ml volumetric flask by dissolving the drug in methanol and made upto the mark with phosphate buffer pH 6.8 and mobile phase (Methanol: 0.01M phosphate buffer pH 7.4:: 65:35), sonicated for 10mins and finally filtered through 0.22 micron nylon syringe filter. Further dilution was made with respective media to achieve concentrations 5, 10, 15, 20, 30, 35, 40, 50, 55, 60µg/ml.
Chromatographic conditions: Chromatography was carried out on Shimadzu HPLC equipped with Class VP software for data processing. Samples were analyzed at 25ºC on a 250 mm x 4.6 mm, 5µm, C18, 100AºKromasil column with 10 mm x 4.6 mm, 5µm, C18, 100AºKromasil precolumn. UV–Vis detector (SPD-10A VP) was set at 286 nm and mobile phase was pumped at a flow rate of 1.0 ml/min. Sample injections of 50 μL each were made automatically using autosampler (SIL-10AD VP). For peak purity in the presence of excipients, a PDA detector (SPD-M10A VP) was used.
Stress Studies:In order to prove the selectivity of analytical method, the ivabradine HCl API, Placebo and its formulation were studied under various stressed conditions to perform forced degradation studies. Stress studies were carried out under the condition of acid/base hydrolysis with thermal and without thermal condition as mentioned in ICH guidelines[11-12].
The drug solutions were prepared with 0.1N HCl and 0.1 NaOH solutions and were treated with or without heating. The heating was done at temperature of 80ºC for 1 hour. Samples were withdrawn after 5th hr. The heat treated and untreated degradation solutions were kept for another 15 days and again sampling was done. Prior to HPLC analysis, each sample was neutralized and then diluted with mobile phase and passed through a 0.22μm nylon filter.
Method validation:
RP-HPLC method was validated for drug specificity, linearity, accuracy and precision and system suitability as per ICH guidelines[13]. Further, this method was used to evaluate solution stability. Peak purity and %recovery of ivabradine spiked in placebo blend were used for assessing specificity of the method. Calibration curve of ivabradine in mobile phase prepared using 40, 45, 50, 55, 60 µg/ml standard solutions were used for assay and to analyze compatibility samples. The limit of detection (LOD) and the limit of quantification (LOQ) were separately determined by diluting the standard concentrations. Accuracy and precision was assessed using three replicates of three concentrations (15, 35, 55μg/ml) in the range and with six replicates for 100% drug release (50μg/ml), in each medium. To assess intra-day variation, calibration curve was prepared thrice on the same day. The procedure was further repeated on three consequent days for determination of interday variability.
Application of proposed methods
Solution stability of ivabradine. Standard solutions of three different concentrations (5, 25, and 50 μg/ml) were stored in refrigerator (8ºC) (n = 3) and at 37±0.5ºC for 24 h and analyzed by both UV and HPLC. The solutions were analyzed after 2, 4, 6, 12, 18 and 24 hours to calculate the percentage agreement of the solutions after storage for assessing solution stability.
Dissolution studies of ivabradine formulations. Effectiveness of UV spectroscopic method in estimating ivabradine was confirmed by comparing with HPLC method. Dissolution studies of four controlled release formulations of ivabradine (prepared by different methods with different excipients) were conducted and the samples obtained were analyzed by both the methods. Assay was carried out for all the formulations using HPLC method. Three tablets from each batch were crushed and contents equivalent to 5mg was carefully transferred to a 50-ml beaker and repeatedly rinsed with mobile phase to ensure complete transfer (n =3). The contents of beaker were sonicated for 10 min and transferred to a 100-ml volumetric flask and volume made up with mobile phase, and then diluted to give a concentration of ~50 µg/ml. These samples were filtered through 0.22μm nylon filter and analyzed by RP-HPLC. Assay content of each formulation was taken as 100% in dissolution studies.
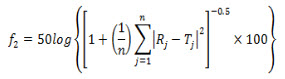
Dissolution studies were conducted using USP type I dissolution apparatus (Electrolab, India) operated at a rotation speed of 100 rpm. Five hundred milliliters of phosphate buffer pH 6.8 was used as dissolution medium. At each predetermined time points, 20 ml of sample was withdrawn from each vessel and equal volume was replaced with fresh buffer. Samples were analyzed by UV spectrophotometric method and HPLC method (n = 3). Dissolution profiles obtained thereof were compared using f2 value. The f2 value is a logarithmic reciprocal square root transformation of one plus the average means squared differences in percentage dissolved between the test (Ti) and reference (Ri) products over time points (n):
Centre for Drug Evaluation and Research, USFDA and Human Medicines Evaluation Unit of the European Agency for the Evaluation of Medicinal Products (EMEA) suggests that two dissolution profiles are similar if f2 is between 50 and 100[14].
Results and discussion
UV spectrophotometric method
The standard drug solution with water as well as with buffers of concentrations 10µg/ml and 50µg/ml was scanned in UV- Vis spectrophotometer over wavelength of 200nm-700nm in all the media. The experimentally determined λmax in water, hydrochloric acid buffer pH 1.2, phosphate buffer pH 6.8 was found to be 286nm versus concentration of standard solutions was constructed.
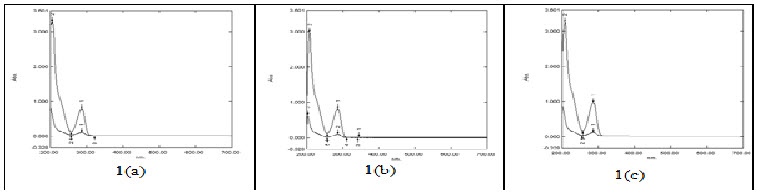
Fig. 1(a) UV scans of Ivabradine HCl solution (50µg/ml) in water; Fig. 1(b) UV scans of Ivabradine HCl solution (50µg/ml) in Hydrochloric Acid Buffer pH 1.2; Fig. 1(c) UV scans of Ivabradine HCl solution (50µg/ml) in Phosphate Buffer pH 6.8.
Method validation
Specificity: Specificity of the method was validated from the recovery of ivabradine spiked in the placebo blend. %Recovery (100.9) and %RSD (1.24) values of 50 µg/ml drug solution show validity of method for recovery. %Agreement (0.37 ± 0.5%) of solutions containing dummy tablets powder, which was not spiked with drug, showed that the interference of excipients is negligible.
Linearity and range: Linearity of the method was observed in expected concentration range 5–60 µg/ml (10–120%) in water, HCl Buffer pH 1.2, pH 6.8 phosphate buffer. Statistical analysis of the calibration curve was done and the results are summarized in Table 1 (a). Correlation coefficient (r2 = 0.999) shows the validity of Beer’s law. Percentage intercept was less than 2% of the response of 100% of test concentration in all the cases, indicating functional linearity between the concentration of analyte and the absorbance.
Table 1 (a)
|
Statistical analysis of calibration curves of Ivabradine HCl by UV methods |
||||
|
|
|
Water |
HCl Buffer (pH 1.2) |
Phosphate Buffer (pH 6.8) |
|
Linearity Range (µg/ml) |
5-60 |
5-60 |
5-60 |
|
|
Regression equation |
y = 0.015x + 0.003 |
y = 0.0189x + 0.0062 |
y= 0.016x+0.00026 |
|
|
S.D. Of slope (n=3) |
0.000153 |
0.000231 |
0.000151 |
|
|
S.D. Of intercept (n=3) |
0.00181 |
0.00127 |
0.00106 |
|
|
Correlation coefficient |
0.9998 |
0.9998 |
0.9999 |
|
|
% Intercept |
0.19 |
0.11 |
0.23 |
|
|
95% confidence intervals |
||||
|
Slope |
0.01461 to 0.01539 |
0.01831 to 0.01949 |
0.01561 to 0.01639 |
|
|
|
Intercept |
-0.00165 to 0.00765 |
0.00294 to 0.00947 |
-0.00247 to 0.00299 |
Table 1 (b)
|
Statistical analysis of calibration curves of Ivabradine HCl by HPLC methods |
|||
|
|
|
Phosphate Buffer (pH 6.8) |
Mobile Phase |
|
Linearity Range (µg/ml) |
5-60 |
40-60 |
|
|
Regression equation |
y = 73257.15x + 11249.43 |
y = 70466.76x + 178612.2 |
|
|
S.D. of slope (n=3) |
241.96 |
654.49 |
|
|
S.D. o f intercept (n=3) |
4471.23 |
31237.98 |
|
|
Correlation coefficient |
0.9992 |
0.9993 |
|
|
% Intercept |
0.76 |
1.87 |
|
|
95% confidence intervals |
|||
|
Slope |
72635.1 to 73879.2 |
68784.07 to 72149.42 |
|
|
|
Intercept |
-246.10 to 22744.9 |
98299.35 to 258925.05 |
Accuracy and precision. Accuracy and precision are demonstrated by %recovery and %RSD of three replicates of 15, 35, and 55 µg/ml solutions and six replicates of 50µg/ml solutions (Table 2).
Table 2
Accuracy and precision of UV spectroscopy and HPLC methods
|
Method |
Medium |
Drug concentration (μg/ml) |
Response |
|
|
% Agreement |
%RSD |
|||
|
UV Spectroscopy |
Water |
15 (n=3) |
100.733 |
0.5 |
|
35 (n=3) |
99.6 |
0.402 |
||
|
55 (n=3) |
100.133 |
0.115 |
||
|
50 (n=6) |
100.231 |
0.213 |
||
|
HCl buffer pH 1.2 |
15 (n=3) |
99.333 |
1.162 |
|
|
35 (n=3) |
100.133 |
0.461 |
||
|
55 (n=3) |
99.533 |
0.506 |
||
|
50 (n=6) |
100.012 |
0.621 |
||
|
Phosphate Buffer pH6.8 |
15 (n=3) |
101 |
1.457 |
|
|
35 (n=3) |
99.467 |
0.614 |
||
|
55 (n=3) |
100.267 |
0.115 |
||
|
50 (n=6) |
100.621 |
0.354 |
||
|
HPLC |
Mobile Phase |
15 (n=3) |
100.71 |
0.278 |
|
35 (n=3) |
100.611 |
0.292 |
||
|
55 (n=3) |
99.986 |
0.254 |
||
|
50 (n=6) |
100.833 |
0.469 |
||
|
Phosphate Buffer pH 6.8 |
15 (n=3) |
100.71 |
0.278 |
|
|
35 (n=3) |
100.611 |
0.292 |
||
|
55 (n=3) |
99.986 |
0.254 |
||
|
50 (n=6) |
100.833 |
0.469 |
||
Intra-day and inter-day variability. Results of intraday and inter-day precisions are given in Table 3. UV spectroscopic method passed the intermediate precision of intra-day and inter-day variability as %RSD of slopes of calibration curves, when analyzed on same day (n = 3) and on three consecutive days, was within 2%.
HPLC method
A reversed-phase HPLC method was developed with a specific procedure for the quality control analysis of ivabradine in compatibility samples, stability samples and in dissolution samples of matrix-based CR formulations. As shown in Fig. 2, ivabradine has a retention time of 7.4 min. Optimum wavelength for detection of ivabradine in different media was 286 nm at which much better detector responses were obtained.
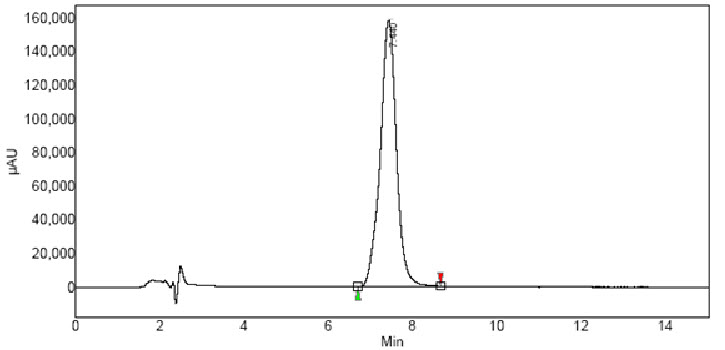
Fig. 2:Chromatogram of Ivabradine HCl in pH 6.8 phosphate buffer.
Method validation
Specificity. Specificity of the proposed method was performed by analyzing powdered dummy tablets spiked with appropriate amounts of drug (10 mg) diluted accordingly to obtain 5, 25, and 50µg/ml drug solutions. %Recovery of all three concentrations was within 98.3 and 101.1%. Further, well-resolved peak of ivabradine at 7.4 min without any interfering peaks indicates the specificity of the method (Fig. 2). Peak purity of ivabradine was studied using PDA in the presence of excipients. Short run time, peak symmetry and peak purity are the advantages that were found with the present HPLC method over the existing methods. Short run time is of particular interest during dissolution studies of CR formulation since a large number of samples are generated in each study.
Linearity and range: The calibration range in each medium was established by considering the practical range necessary for dissolution or assay, and to give accurate and precise results with good linearity. Detector response (area of peak) was plotted against concentration to obtain calibration curves. For assay of ivabradine in Controlled Release tablets, concentration range 80–120% drug concentration (40, 45, 50, 55 and 60µg/ml) in mobile phase was used. Whilst for analyzing dissolution samples, concentration range 10–120% (5, 10, 20, 30, 40, 50 and 60 µg/ml) drug solution in pH 6.8 phosphate buffer was used. Regression analysis was carried out on calibration curves and results are summarized in Table 1(b). Linearity of the calibration curves and the adherence to Beer’s law were validated by the high value of the correlation coefficient.
LOD and LOQ: LOD and LOQ were determined at a signal-to-noise ratio of 3 and 10, respectively, using Class- VP software (Shimadzu, Japan). LOD and LOQ were experimentally verified by diluting known concentrations of ivabradine in phosphate buffer till the peak obtained has more than 3- and 10-fold area of the S.D. of six determinations[15]. LOD and LOQ were found to be 0.05 and 0.2 µg/ml, respectively.
Accuracy and precision: Accuracy and precision of the proposed method were assessed as defined by ICH guidelines. Quantitative determinations of three standard solutions in three replicates within the specified range and six replicates at 100% (50µg/ml) drug concentration were performed and the results are in good agreement. %Agreement and %RSD show the validity for accuracy and precision (Table 2).
Intra- and inter-day variations. Table 3 gives the results obtained for intra-day and inter-day precisions. The percentage standard deviation (%RSD) of slopes for each standard curve obtained within day and between three consecutive days proves intermediate precision of inter-day and intra-day validations.
Table 3
Table 3
|
Inter-day Precision of Ivabradine Standards |
||||||
|
|
UV |
|
HPLC |
|||
|
water |
HCl Buffer (pH 1.2) |
Phosphate Buffer (pH 6.8) |
|
Phosphate Buffer (pH 6.8) |
Mobile Phase |
|
|
Slope |
||||||
|
Average |
0.0151 |
0.0189 |
0.0160 |
73298.00 |
70085.11 |
|
|
%RSD |
0.3832 |
0.3060 |
0.6250 |
0.3301 |
0.9338 |
|
|
Intercept |
||||||
|
Average |
0.0032 |
0.0058 |
0.0024 |
16018.00 |
184250.04 |
|
|
%RSD |
40.98 |
10.49 |
32.82 |
|
27.9138 |
20.1584 |
|
Intra-day Precision of Ivabradine Standards |
|
||||||
|
|
UV |
|
HPLC |
||||
|
water |
HCl Buffer (pH 1.2) |
Phosphate Buffer (pH 6.8) |
|
Phosphate Buffer (pH 6.8) |
Mobile Phase |
||
|
Slope |
|||||||
|
Average |
0.0151 |
0.0188 |
0.0160 |
73447.49 |
70088.44 |
||
|
%RSD |
1.0094 |
1.2306 |
0.9527 |
0.36648 |
0.8997 |
||
|
Intercept |
|||||||
|
Average |
0.0029 |
0.0055 |
0.0022 |
9705.2 |
190673.37 |
||
|
%RSD |
62.92 |
23.235 |
48.1046 |
|
27.5593 |
16.3830 |
|
3.2.1.6. Degradation Study:
The degradation samples were analyzed by HPLC using the above standardized method and the chromatographs were given below.
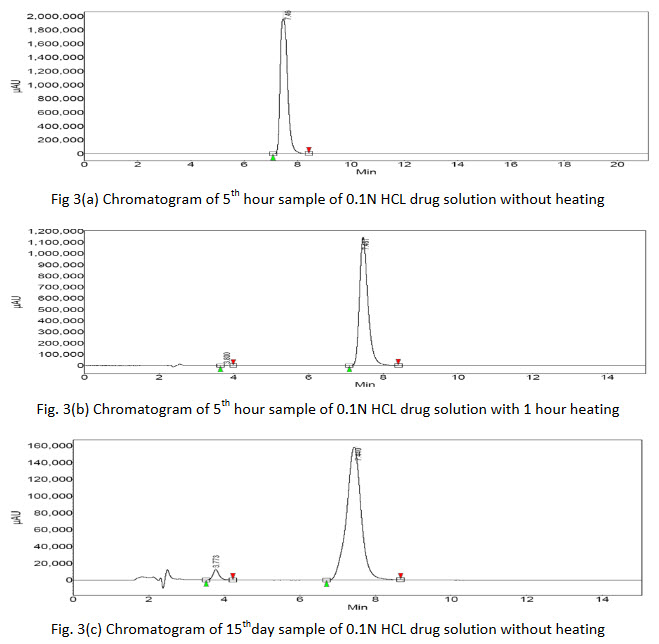
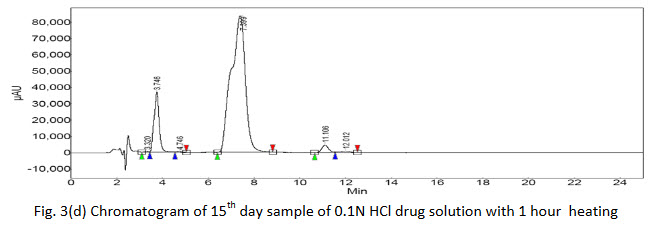
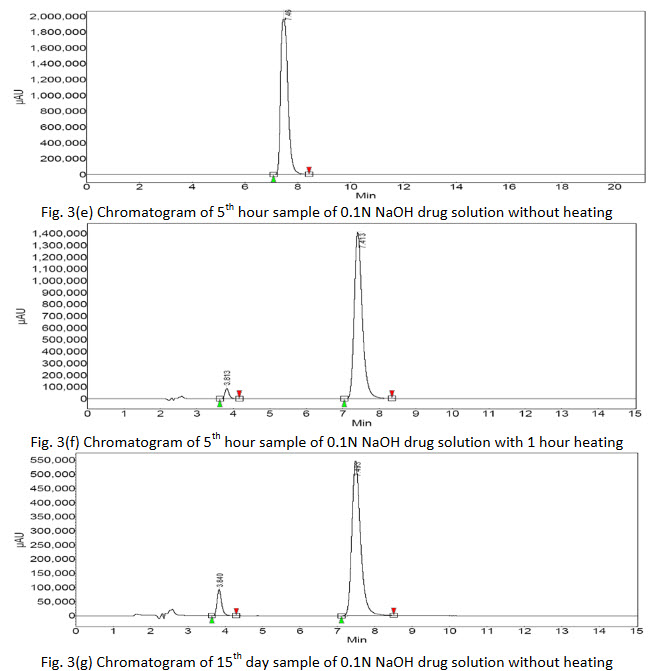
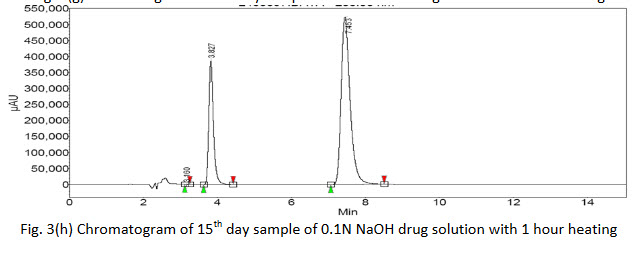
Degradation products were observed on the chromatograms (Fig. 3(a-h)). However, none of these degradants peak products interfered with the peak of interest. The results clearly indicate that there is no merging of the impurity peak with the main peak of drug.
Further, there was no degradation of the drug in acidic or basic media without heat treatment as no extra peaks were found in the chromatograms of 5th hour sample but additional peaks were found in chromatogram of 5th hour sample with 1 hour heat treatment showing that the drug was vulnerable to degradation with rise in temperature. The 15th day samples of both heat treated as well untreated acidic and basic drug solution showed extra peaks gave the indication of drug degradation. The area of the peak of pure drug of acidic media was found to be more of the same type basic sample which indicated that the drug was more susceptible to degradation in basic media. Again the chromatogram of 15th day of acidic solution of drug showed 5 extra peaks indicated that the drug or initial degraded product further breaking down to many molecules. The % assay of the degraded samples sum up with % of observed impurities peaks (by area normalization) bring close to 100%, suggests the HPLC method to be stability indicating.
Applications of the proposed methods
Solution stability
Solution stability of ivabradine in water, hydrochloric acid buffer pH 1.2 and phosphate buffer pH 6.8 was established using UV method; and in phosphate buffer pH 6.8 and mobile phase was established using HPLC method. Calculated concentration and percentage agreement of drug solutions (5, 25, and 50 μg/ml) stored at refrigerating and room temperatures were obtained using freshly prepared calibration curves and the results are summarized in Table 4.
Table 4
|
Method |
Medium |
Conc. (μg/ml) |
Solution stability at different point of time (hr) |
|||||
|
2 |
4 |
6 |
12 |
18 |
24 |
|||
|
|
|
|
% Agreement |
|||||
|
UV |
Water |
5 |
100 |
100 |
99.96 |
99.84 |
99.82 |
99.76 |
|
25 |
100 |
99.98 |
99.99 |
99.76 |
99.72 |
99.7 |
||
|
50 |
100.01 |
100 |
99.97 |
99.55 |
99.65 |
99.46 |
||
|
HCl buffer pH 1.2 |
5 |
100.02 |
100 |
99.99 |
99.94 |
99.23 |
9.12 |
|
|
25 |
99.99 |
99.94 |
99.12 |
98.95 |
98.45 |
98.25 |
||
|
50 |
101.1 |
99.89 |
99.78 |
99.8 |
99.45 |
99.6 |
||
|
Phosphate Buffer pH6.8 |
5 |
99.98 |
100 |
99.95 |
99.56 |
99.23 |
98.9 |
|
|
25 |
100 |
100 |
99.54 |
98.97 |
99.86 |
99.56 |
||
|
50 |
||||||||
|
HPLC |
Phosphate Buffer pH 6.8 |
5 |
101.02 |
100.04 |
99.95 |
99.28 |
98.45 |
98.6 |
|
25 |
100.05 |
99.97 |
99.57 |
99.45 |
98.78 |
98.5 |
||
|
50 |
99.99 |
100 |
99.78 |
99.23 |
98.89 |
98.56 |
||
Results show good agreement and indicate stability of ivabradine solutions for more than 24 h. It proves the solution of standard and sample solution at room temperature.
Dissolution studies of Ivabradine formulations
The proposed methods were applied to quantitatively estimate ivabradine release from four different controlled release tablet formulations. UV spectroscopic method showed satisfactory comparable results to that of the RP-HPLC method (Fig. 4). The results of analysis of the different controlled release formulations suggested that there is no interference from any excipients that are used in these formulations. Statistical analysis of the drug-release profiles obtained by both the methods was performed using similarity factor. Similarity factor, f2 value, is 74.23, 76.23, 69.57 and 72.56 for formulation I, II, III and IV respectively, indicating that the profiles generated by both the methods are similar.
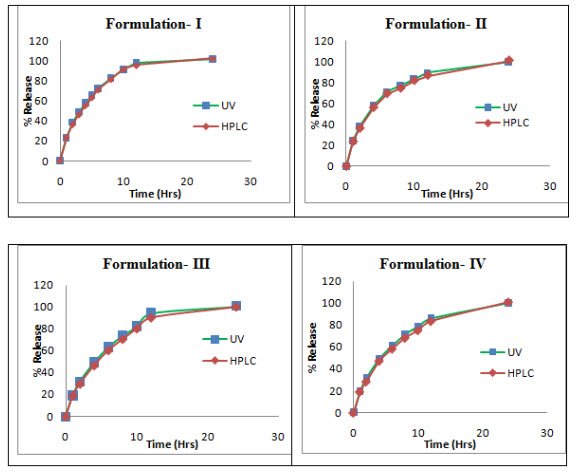
Fig. 4 Comparison of dissolution profiles of four controlled release formulations of ivabradine prepared by different methods with different excipients using UV and HPLC methods.
Conclusion:
The proposed UV spectroscopic and RPHPLC methods provide simple, accurate and reproducible quantitative analysis for determination of ivabradine hydrochloride in drug release studies. Proposed methods complied with ICH validation criteria and showed comparable results.
UV spectroscopic method has the advantages of lower cost and feasibility, and can be used for routine dissolution studies during CR formulation development.
ACKNOWLEDGEMENTS
The authors thank Themis Medicare Ltd. (Mumbai, India), for providing Ivabradine HCl as gift sample for this work. They also thank Dr. Aliasgar Shahiwala, Associate Professor, National Institute of Pharmaceutical Education & Research (NIPER), Ahmedabad and Prof. (Dr.) Harish Padh, Director, B.V. Patel Pharmaceutical Education and Research Development (PERD) Centre & Project Director, National Institute of Pharmaceutical Education & Research (NIPER), Ahmedabad, for providing required facilities to carry out this research work.
References
1. Difrancesco D, Camm JA: Heart rate lowering by specific and selective I(f) current inhibition with ivabradine. Drugs. 2004, 64:1757-65.
2. http://www.medicines.org.uk/emc/medicine/17188/SPC/Procoralan.
3. Bouchard MF, Simonin G, Bossant MJ, Neyret CB: Simultaneous determination of ivabradine and its metabolites in human plasma by liquid chromatography-tandem mass spectrometry. J. Chromat. B, Analyt. Technol. Biomed. Life Sci. 2000, 745:261-69.
4. Klippert P, Jeanniot JP, Polve S, Lefevre C, Merdjan H: Determination of ivabradine and its N-demethylated metabolite in human plasma and urine, and in rat and dog plasma by a validated high-performance liquid chromatographic method with fluorescence detection. J. Chromat. B, Analyt. Technol. Biomed. Life Sci. 1998, 719:125-33.
5. Prasad UK, Gray D, Purcell H: Review of the If Selective Channel Inhibitor Ivabradine in the Treatment of Chronic Stable Angina. Adv. Ther. 2009, 26:127-37.
6. Duffull SB, Chabaud S, Nony P, Laveille C, Girard P, Aarons L: A Pharmacokinetic simulation model for ivabradine in healthy volunteer. Eur. J. Pharm. Sci. 2000, 10:285-94.
7. Seerapu S, Srinivasan BP: Development and validation of RP-HPLC method for the estimation of ivabradine hydrochloride in tablets. Indian J. Pharm. Sci. 2010, 72:667-71.
8. Rahman MR, Asaduzzaman M, Islam SMA: Development and validation of RP-HPLC method for analysis of Ivabradine Hydrochloride in tablet dosage forms. Res. J. Pharm. Biol. Chem. Sci. 2012, 3:1032-43.
9. Maheshewari S, Khandhar AP, Jain A: Quantitative Determination and Validation of Ivabradine HCL by Stability Indicating RP-HPLC Method and Spectrophotometric Method in Solid Dosage Form. Eurasian J. Anal. Chem. 2010, 5:53-62.
10. Verma RK, Garg S: Validated high performance liquid chromatographic method for analysis of isosorbide mononitrate in bulk material and extended release formulations. J. Pharm. Biomed. Anal. 2002, 30:583-91.
11. ICH Q1A (R2) Stability Testing of New Drug Substances and Products. International Conference on Harmonisation, IFPMA, Geneva, 2003.
12. ICH Q1B Stability Testing of New Drug Substances and Products. International Conference on Harmonisation, IFPMA, Geneva, 1996.
13. Guidance for Industry, Q2B Validation of Analytical procedures: methodologies, US Department of Health and Human Services US FDA, Center for Drug Evaluation and Research, Rockville, MD, USA, November 1996.
14. Guidance for Industry, Oral extended (controlled) release dosage forms: in vivo bioequivalence and in vitro dissolution testing, US Department of Health and Human Services US FDA, Center for Drug Evaluation and Research, Rockville, MD, USA, 1993.
15. Panchagnula R, Bansal T, Varma MVS, Kaul CL: Reversed-phase liquid chromatography with ultraviolet detection for simultaneous quantitation of indinavir and propranolol from ex-vivo rat intestinal permeability studies. J. Chromat. B, Analyt. Technol. Biomed. Life Sci. 2004, 806:277-82.
REFERENCE ID: PHARMATUTOR-ART-2221
|
PharmaTutor (ISSN: 2347 - 7881) Volume 2, Issue 8 Received On: 06/06/2014; Accepted On: 08/06/2014; Published On: 01/08/2014How to cite this article: S Panda, S Patra; Rapid and Selective UV Spectrophotometric and RP-HPLC Methods for Dissolution Studies of Ivabradine Controlled-Release Formulations; PharmaTutor; 2014; 2(8); 201-213 |