ABOUT AUTHORS:
Amar Nagesh Kumar1, Reena jose2, Praswetha Reddy3
1 Lecturer, Department of Biochemistry, SSR Medical College, Mauritius
2 M. Sc Biotechnology, Yogi Vemana University
3 M. Sc Biochemistry, Mahatma Gandhi P.G College, Guntur
OBJECTIVE:To estimate the given samples of DNA qualitatively and quantitatively and know its purity and concentration.
BACKGROUND
Quantification of nucleic acids is commonly used in molecular Biology to determine the concentration of DNA and RNA present in the mixture As subsequent reaction or protocols using the nucleic acids sample of a required particular amount of optical performance. Both DNA and RNA exhibit strong absorbance of UV due to the presence of conjugated double bonds of the constant purine and pyramidine bases and these have characteristics of OD (optical density)of absorbance maximum at 260nm which is linearly related with the concentration of the DNA in the solution up to the OD value of 2 . The spectroscopic method is used to check the purity of DNA. Proteins are the major contaminants in the nucleic acid extracts and these have the maximum absorbance at 280nm. Value less than 1.8 signifies the presence of proteins as impurities.
[adsense:336x280:8701650588]
REFERENCE ID: PHARMATUTOR-ART-1134
MATERIALS & METHODS
Materials required
· SSC buffer(saline sodium citrate)pH 7
· Quarts cuvette
· Distilled water
· Tissue paper
· Conical flask
· Beaker
UV spectrophotometer
REAGENT PREPARATION:
SSC BUFFER 20ml
* 0.3Mtrisodiumcitrate 1.7 gm dissolved in 20ml of distilled water is 0.3 tri sodium citrate
* 3M sodium chloride
* 50 gm dissolved in 20ml of distil water is 3M sodium chloride
NOW YOU CAN ALSO PUBLISH YOUR ARTICLE ONLINE.
SUBMIT YOUR ARTICLE/PROJECT AT articles@pharmatutor.org
Subscribe to Pharmatutor Alerts by Email
FIND OUT MORE ARTICLES AT OUR DATABASE
PROCEDURE
Take 3ml of SSC buffer in the cuvette as blank .
Add 50μl of isolated DNA and make the volume up to 3ml by adding 2950µl ssc buffer.
Place the cuvettes in the spectrophotometer and measure the absorbance at 260nm and 280nm against blank .
The purity if the nucleic acids is determined by calculating the ratio of absorbance at both 260 and 280nm by using the following formula. O.D 260 nm/ O.D 280 nm. Concentration of DNA (µg/ml)=O.D.260X50Xdilution factor
For example:
|
Sample No O.D.260 O.D.280 O.D.260 / O.D.280 |
|
Sample 1 0.126 0.233 0.233/0.123=1.849 |
|
Sample2 0.118 0.226 0.266/0.118=1.915 |
Although O.D.260 / O.D.280 ratio of both the samples 1 and 2 is between 1.8 and 2.0 but sample A DNA Is better and pure because the ratio is close to 1.8.
While taking absorbance, the sample is diluted 100times, i.e. dilution factor is 100 times Conc. of DNA of sample1 = 0.233X50X100=1165µg/ml = 1.165µg/ml.
Quantification of plasmid DNA:-
Isolated DNA was quantified by measuring the absorbance at 260 and at 280 nm. The ratio of absorbance 260/280 was used to determine the quality of the isolated DNA .The concentration was calculated using the following formula
Concentration of the DNA = OD260 X 50 X dilution factor = mg of DNA /ml
Quantified DNA was diluted to 150 ng/ml and used for polymerase chain
Polymerase chain reaction-
Polymerase chain reaction was performed using primers that were designed from the pUC19 vector sequence (Table). Primers were commercially obtained from Sigma–Aldrich (Sigma-Aldrich Inc. St. Louis, Missouri 63178, USA). All the primers designed were 20 base pairs or more in length with GC content in the range of 40-80%. Tm was calculated according to the formula Tm(C) = 2(A+T) + 4(G+C) -5. The annealing temperature for each pair of PCR primers was optimized experimentally.
PCR amplification was carried out with following reaction parameters
dNTPs 200 µM
PCR reaction buffer 1X
Magnesium chloride 1.5 -2.5 mM
Primer (forward) 50 pmoles
Primer (reverse) 10 pmoles each
Templet DNA 150 ng
Taq DNA polymerase 1U
The final reaction volume was 50 µl.
The cycling conditions used:
Initial denaturation 94oC, 2 min
Denaturation 94oC, 45 sec
Annealing 54-62oC, 30sec
Elongation 72oC, 45 sec
Cycles 35
Final elongation 72oC, 10 min
Agarose gel electrophoresis:
0.8 to1.5% agarose gels were prepared by dissolving the required quantity of agarose in 1X Tris-Acetate-EDTA (40mM tris-acetate. 1mM EDTA) electrophoresis buffer by heating in a microwave oven, followed by addition of ethidium bromide to a final concentration of 0.25 ug/ml. The agarose solution was poured into a gel tray containing a comb, allowed to cool and solidify, and then placed in electrophoresis tank and submerged in 1X TAE buffer. DNA samples were mixed with 6X gel loading buffer (0.25% bromophenol blue, 0.25% xylene cyanol 40% w/v sucrose). Samples were loaded on the gel along with DNA size standards. Horizontal electrophoresis was carried out at approximately 80-100V. The gel was photographed under UV light using the gel documentation system.
Ethanol precipitation-
Ice cold ethanol (100%) was added in a ratio of 1:5 (500 ul polled reaction mix and 2.5ml of ice cold ethanol). The mix was mixed properly and left at -80degC for 1 hour. After the incubation the DNA was precipitated by spinning at 12000rpm for 10min. The pellet is washed in cold 70% ethanol then after a further centrifugation step the ethanol is removed, and the nucleic acid pellet is allowed to dry before being resuspended in nuclease free water.
NOW YOU CAN ALSO PUBLISH YOUR ARTICLE ONLINE.
SUBMIT YOUR ARTICLE/PROJECT AT articles@pharmatutor.org
Subscribe to Pharmatutor Alerts by Email
FIND OUT MORE ARTICLES AT OUR DATABASE
RESULTS
The PCR primers were optimized for the annealing temperatures, MgCl2 concentrations and template concentrations. The primers were standardized at a range (54degC- to 60degC) of annealing temperatures. The result was given in table (2). The amplification was good at 58degC for all the primers. The MgCl2 concentrations of 1.5mM and 2.5mM were used to standardize the primers. The result was given in the table (3). All the products were amplified at both the MgCl2 concentrations. Low MgCl2 concentration was used in subsequent analysis. The template concentrations chosen for the amplification were 100 ng and 150 ng. The result was given in the table (4). After the amplification of the individual fragments with a volume of 50 ul each were pooled together and precipitated with 100% ethanol. After the ethanol precipitation the pellet was resuspended in 100 ul of the nuclease free water and 3 ul of the sample was loaded on the gel along with the reference molecular weight marker from MBI fermantas. The concentrated molecular weight marker and the reference marker were shown in the Figure (4).
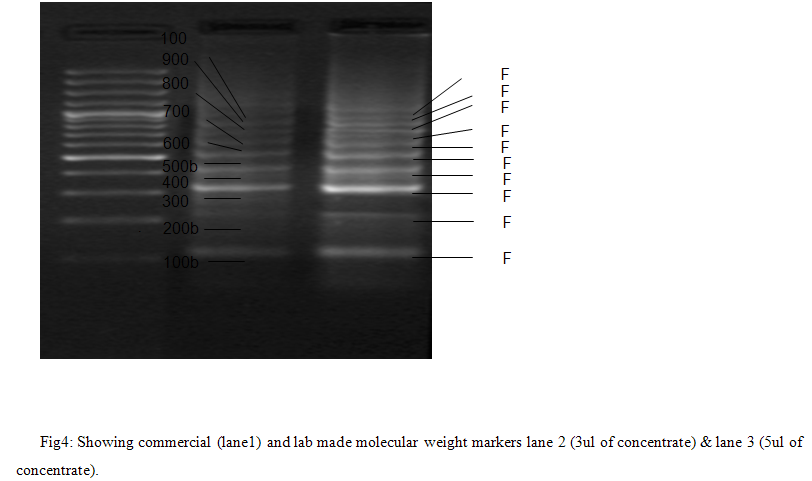
All the fragments intensity was good when compare to reference marker and the resolution between the marker bands between the home maid and commercial molecular weight markers were same.
|
S.NO |
Primer sequence |
|
1 |
F- 5’-TCGCGCGTTTCGGTGATGAC-3’ |
|
2 |
1R- 5’- CGGGCTTGTCTGCTCCCGGC-3’ |
|
3 |
2R-5’-TATTTCACACCGCATATGGT-3’ |
|
4 |
3R-5-’ATACGAAGAGGCCCGCACC-3’ |
|
5 |
4R-5’-AATTCACTGGCCGTCGTTTT-3’ |
|
6 |
5R-5-’TGGAATTGTGAGCGGATAAC-3’ |
|
7 |
6R-5-’GGGCAGTGAGCGCAACGCAA-3’ |
|
8 |
7R-5- ATTAATGCAGCTGGCACGAC-3’ |
|
9 |
8R-5-’CCTGCGTTATCCCCTGATTG-3’ |
|
10 |
9R-5-GTGATGCTCGTCAGGGGGGC-3’ |
|
11 |
10-5’-TCGGAACAGGAGAGCGCACG-3’ |
Table1: The sequence of the primers used for the amplification of the different fragments in the molecular weight marker
|
Primer |
Annealing temperature |
Result |
Annealing temperature |
Result |
Annealing temperature |
Result |
Annealing temperature |
Result |
|
MF+MR1 |
54degC |
No amplification |
56degC |
No amplification |
58degC |
Good amplification |
60degC |
No amplification |
|
MF+MR2 |
54degC |
No amplification |
56degC |
No amplification |
58degC |
Good amplification |
60degC |
No amplification |
|
MF+MR3 |
54degC |
No amplification |
56degC |
No amplification |
58degC |
Good amplification |
60degC |
No amplification |
|
MF+MR4 |
54degC |
No amplification |
56degC |
No amplification |
58degC |
Good amplification |
60degC |
No amplification |
|
MF+MR5 |
54degC |
No amplification |
56degC |
No amplification |
58degC |
Good amplification |
60degC |
No amplification |
|
MF+MR6 |
54degC |
No amplification |
56degC |
No amplification |
58degC |
Good amplification |
60degC |
No amplification |
|
MF+MR7 |
54degC |
No amplification |
56degC |
No amplification |
58degC |
Good amplification |
60degC |
No amplification |
|
MF+MR8 |
54degC |
No amplification |
56degC |
No amplification |
58degC |
Good amplification |
60degC |
No amplification |
|
MF+MR9 |
54degC |
No amplification |
56degC |
No amplification |
58degC |
Good amplification |
60degC |
No amplification |
|
MF+MR10 |
54degC |
No amplification |
56degC |
No amplification |
58degC |
Good amplification |
60degC |
No amplification |
Table2: Different annealing temperatures and the amplification of the PCR product
|
Primer |
Annealing temperature |
MgCl2 concentration |
Result |
MgCl2 concentration |
Result |
|
MF+MR1 |
58degC |
1.5mM |
Good amplication |
2.5mM |
Good amplication |
|
MF+ MR2 |
58degC |
1.5mM |
Good amplication |
2.5mM |
Good amplication |
|
MF+ MR3 |
58degC |
1.5mM |
Good amplication |
2.5mM |
Good amplication |
|
MF+ MR4 |
58degC |
1.5mM |
Good amplication |
2.5mM |
Good amplication |
|
MF+ MR5 |
58degC |
1.5mM |
Good amplication |
2.5mM |
Good amplication |
|
MF+ MR6 |
58degC |
1.5mM |
Good amplication |
2.5mM |
Good amplication |
|
MF+ MR7 |
58degC |
1.5mM |
Good amplication |
2.5mM |
Good amplication |
|
MF+ MR8 |
58degC |
1.5mM |
Good amplication |
2.5mM |
Good amplication |
|
MF+ MR9 |
58degC |
1.5mM |
Good amplication |
2.5mM |
Good amplication |
|
MF+ MR10 |
58degC |
1.5mM |
Good amplication |
2.5mM |
Good amplication |
Table3: Different MgCl2 concentrations and the result of the PCR amplification
|
Primer |
Annealing temperature |
MgCl2 concentration |
Template concentration |
Result |
Template concentration |
Result |
|
MF+MR1 |
580 C |
1.5mM |
100ng/µl |
Less amplification |
150ng/µl |
Good amplication |
|
MF+MR2 |
580 C |
1.5mM |
100ng/µl |
Less amplification |
150ng/µl |
Good amplication |
|
MF+MR3 |
580 C |
1.5mM |
100ng/µl |
Less amplification |
150ng/µl |
Good amplication |
|
MF+MR4 |
580 C |
1.5mM |
100ng/µl |
Less amplification |
150ng/µl |
Good amplication |
|
MF+MR5 |
580 C |
1.5mM |
100ng/µl |
Less amplification |
150ng/µl |
Good amplication |
|
MF+MR6 |
580 C |
1.5mM |
100ng/µl |
Less amplification |
150ng/µl |
Good amplication |
|
MF+MR7 |
580 C |
1.5mM |
100ng/µl |
Less amplification |
150ng/µl |
Good amplication |
|
MF+MR8 |
580 C |
1.5mM |
100ng/µl |
Less amplification |
150ng/µl |
Good amplication |
|
MF+MR9 |
580 C |
1.5mM |
100ng/µl |
Less amplification |
150ng/µl |
Good amplication |
|
MF+MR10 |
580 C |
1.5mM |
100ng/µl |
Less amplification |
150ng/µl |
Good amplication |
Table4: Different templateconcentrations and the result of the PCR amplification.
DISCUSSION The molecular weight markers are very important tools in molecular biology and in protein science. Any nucleic acid molecule to be sized should run along with known size standards. The known size standards available in 50ug and 250ug. That can be used for 220 and 1100 applications respectively. The price in market is ranging from 3000 rupees to 6000 rupees depends upon the company. Per application it costs around 15-30 rupees. If we can synthesize the marker in the laboratory the price will be 5rupees for application. To minimize the price we had synthesized the molecular weight marker in our laboratory. The marker constructed in the laboratory had the entire bands as commercially available marker. Higher molecular weight bands had low intensity that could be due to the low recovery of the DNA at the time of precipitation. precipitation protocol has to standardize to get proper molecular weight marker.
CONCLUSION Good intensified marker was developed by individual fragment amplification and pooling method. The resolution between all the fragments in the molecular weight marker was clear.
BIBLIOGRAPHY
- Joseph Sambrook and David W. Russel (2001). Molecular Cloning: A Laboratory Manual (3rd ed. ed.). Cold Spring Harbor, N.Y.: Cold Spring Harbor Laboratory Press. ISBN 0-87969-576-5. Chapter 8: In vitro Amplification of DNA by the Polymerase Chain Reaction
- Pavlov AR, Pavlova NV, Kozyavkin SA, Slesarev AI (2004). "Recent developments in the optimization of thermostable DNA polymerases for efficient applications". Trends Biotechnol. 22: 253–260. doi:10.1016/j.tibtech.2004.02.011. PMID 15109812.
- Rychlik W, Spencer WJ, Rhoads RE (1990). "Optimization of the annealing temperature for DNA amplification in vitro". Nucl Acids Res 18: 6409–6412. doi:10.1093/nar/18.21.6409. PMID 2243783..
- D.J. Sharkey, E.R. Scalice, K.G. Christy Jr., S.M. Atwood, and J.L. Daiss (1994). "Antibodies as Thermolabile Switches: High Temperature Triggering for the Polymerase Chain Reaction". Bio/Technology 12: 506–509. doi:10.1038/nbt0594-506.
- Chien A, Edgar DB, Trela JM (1976). "Deoxyribonucleic acid polymerase from the extreme thermophile Thermus aquaticus". J. Bacteriol 174: 1550–1557. PMID 8432.
- Lawyer FC, Stoffel S, Saiki RK, Chang SY, Landre PA, Abramson RD, Gelfand DH (1993). "High-level expression, purification, and enzymatic characterization of full-length Thermus aquaticus DNA polymerase and a truncated form deficient in 5' to 3' exonuclease activity". PCR Methods Appl. 2: 275–287. PMID 8324500.
- Pavlov AR, Pavlova NV, Kozyavkin SA, Slesarev AI (2006). "Thermostable DNA Polymerases for a Wide Spectrum of Applications: Comparison of a Robust Hybrid TopoTaq to other enzymes". in Kieleczawa J. DNA Sequencing II: Optimizing Preparation and Cleanup. Jones and Bartlett. pp. 241–257. ISBN 0-7637338-3-0.
- Chemical Synthesis, Sequencing, and Amplification of DNA (class notes on MBB/BIO 343)". Arizona State University. photoscience.la.asu.edu/photosyn/courses/BIO_343/lecture/DNAtech.html. Retrieved on 2007-10-29.
- Newton CR, Graham A, Heptinstall LE, Powell SJ, Summers C, Kalsheker N, Smith JC, and Markham AF (1989). "Analysis of any point mutation in DNA. The amplification refractory mutation system (ARMS)". Nucleic Acids Research 17 (7): 2503–2516.
NOW YOU CAN ALSO PUBLISH YOUR ARTICLE ONLINE.
SUBMIT YOUR ARTICLE/PROJECT AT articles@pharmatutor.org
Subscribe to Pharmatutor Alerts by Email
FIND OUT MORE ARTICLES AT OUR DATABASE