
About Author:
Mr. RAJU A. MODHAVADIYA
School of Life Sciences
University of Hertfordshire, UK
Abstract:
The main concept of the study was to find out the penetration of boots ibuprofen gel at different frequencies such as 20 kHz and 40 kHz through cellulose membrane exposed to ultrasound. Different sonicator bath were used for different frequencies. Ultrasound has been used to enhance penetration of ibuprofen from transdermal preparation. Boots ibuprofen gel was used in the experiment. Ibuprofen is a NSAIDs drug which is used to enhance healing effect against inflammation, pain and analgesics.
Frequency, intensities, duty cycle are the important factor. In this experiment frequency variable was used. 20 kHz and 40 kHz frequencies were used in this experiment.Boots ibuprofen gel max (10%) was used to measure the penetration of ibuprofen through the cellulose membrane exposed to ultrasound. By using the Franz diffusion cell penetration of ibuprofen was found out. An amount of ibuprofen permeated through cellulose membrane was found out using High Performance Liquid Chromatography (HPLC). Penetration of ibuprofen was found out more lower frequency. However the penetration ibuprofen also increase compare to control in first hour. The ANOVA result: sample assuming equal variances were performed to find out significance difference (P<0.05) between control and different ultrasound frequencies and also the rate gradients were measured. The P value got for the control and 40 kHz frequency was 0.123, which indicate that there is no significance difference observed for permeation of ibuprofen from gel . P value of control and 20 kHz frequency applying for 2 min was 0.05 which was similar P value, which shows that nearly significance observed between two value. The P value of control and 20 kHz for 5 minute was 0.002 which indicate that there was a significance observed between this two value. From the result it shows that lower frequency with more time give good penetration result.
[adsense:336x280:8701650588]
Reference Id: PHARMATUTOR-ART-1148
1.INTRODUCTION:
1.1 Transdermal drug delivery system (TDDS):
Transdermal delivery of drugs through the skin to the systemic circulation provides a convenient route of administration for a variety of clinical indications. Transdermal drug delivery system represents one of the most sophisticated drug delivery technologies to administer active pharmaceutical ingredients in lower doses and thereby achieving more stable blood levels. The administration of TDDS need not be repeated often, therefore encouraging patient compliance. Transdermal drug delivery facilitate the passage of therapeutic quantities of the drug substances through the skin and into the general circulation for systemic effect.(Ansel, 2005).
The most common form of delivery of drugs is the oral route. while this has the notable advantages of easy administration, it also has significant drawbacks such as poor bioavailability due to hepatic metabolism (first pass) and the tendency to produce high and low blood level, leading to a need for high and/or frequent dosing, which can be both cost prohibitive and inconvenient (Chien, 1992).
To overcome these difficulties development of new drug delivery system is needed, which will improve the therapeutic efficacy and safety of drugs by more precise (site specific) , spatial and temporal placement within the body thereby reducing both the size and number of doses. One of the methods which are most often utilized has been transdermal drug delivery meaning transport of therapeutic substances through the skin for systemic effect. This is closely related to percutaneous delivery, which is transport in to target tissues, with an attempt to avoid systemic effect (Roberts, 1997).
[adsense:468x15:2204050025]
1.1.1 Skin barrier: The stratum corneum develops a thin, tough, relatively impermeable which usually provides the rate limiting step in trasdermal drug delivery system. Sweat ducts and hair follicles are also paths of entry, but their are considered rather insignificant (Aulton, 2002).
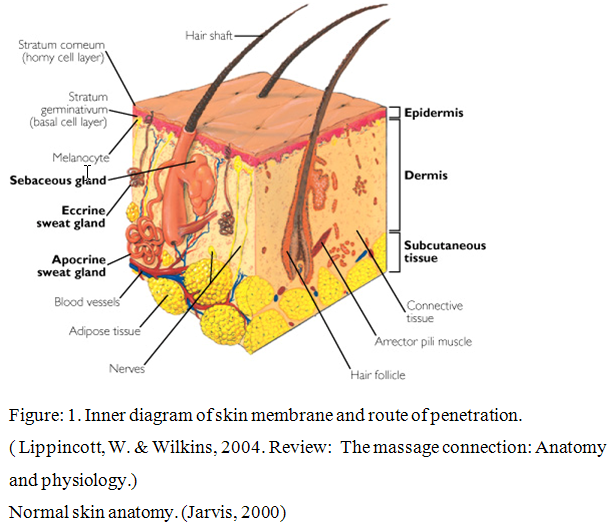
The skin is the largest organ of the body, with a surface area of 18 square feet. Its two main layers are the epidermis (outer layer) and dermis (inner layer). The epidermis has several strata (layers) that contain four cell types. Keratinocytes produce keratin, a protein that gives skin its strength and flexibility and waterproofs the skin surface. Melanocytes produce melanin, the dark pigment that gives skin its color. Merkel's cells are probably involved with touch reception. Langerhans' cells help the immune system by processing antigens (foreign bodies).
The stratum corneum, outermost layer is thick with rows of dead cells. These cells contain soft keratin, which keeps the skin elastic and protects underlying cells from drying out.
NOW YOU CAN ALSO PUBLISH YOUR ARTICLE ONLINE.
SUBMIT YOUR ARTICLE/PROJECT AT articles@pharmatutor.org
Subscribe to Pharmatutor Alerts by Email
FIND OUT MORE ARTICLES AT OUR DATABASE
1.3 Mechanism of TDDS:
There are two important layers of the skin: the dermis and epidermis. The outermost layer is approximately 100 to 150 micrometers thick and this layer has no blood flow and includes a layer within it known as stratum corneum. This is the layer which is most important for transdermal drug delivery as its composition allows it to keep water within the body and foreign substances out. Beneath the epidermis, the dermis contains a system of capillaries that transport blood throughout the body. If the drug passes the stratum corneum layer then it can enter the blood stream. A process known as passive diffusion. Lipid soluble substances readily pass through the intercellular lipid bi layers of the cell membrane whereas water soluble drugs are able to pass through the skin because of hydrated intracellular proteins. Using drug in this manner much more rapid and useful drug delivery is possible.
1.4 Benefits and limitation of TDDS:
1.4.1 Benefits:
The avoidance of first pass metabolism and other variables associated with the GI tract, such as pH, gastric emptying time (Kormic, et al., 2003).
Sustained and controlled delivery for a prolonged period of time (Yang, et al., 2004).
Reduction in side effects associated with systemic toxicity, i.e. minimization of peaks and troughs in blood drug concentration (Cramer, et al., 1994).
Improved patient acceptance and compliance (Payne, et al., 1998).
Direct access to target or diseased site, e.g. treatment of skin disorders such as psoriasis, eczema and fungal infection (Long, 2002).
Ease of dose termination in the event of any adverse reactions, either systemic or local (Cleary, et al., 1997).
Convenient and painless administration.
Ease of use may reduce overall health care treatment costs (Frie, et al., 2003).
Provides an alternative in circumstances where oral dosing is not possible (in unconscious or nauseated patients) (Kormic, et al., 2003).
1.4.2 Limitations:
A molecular weight less than 500 Da is essential to ensure ease of diffusion across the SC, since solute diffusivity is inversely related to its size (Bos, et al., 2000).
Sufficient aqueous and lipid solubility is required for the permeate to successfully transverse the SC (Yano, et al., 1986).
Pre systemic metabolism; the presence of enzymes, such as peptidases, in the skin might metabolise the drug in to form that is therapeutically inactive, thereby reducing the efficacy of the drug (Steinstrasser, et al., 1995).
Skin irritation and drug sensitization, referred to as the “Achilles heel” of dermal and trasdermal delivery. The skin is an immunological barrier may be provoked by exposure to certain stimuli, this may include drugs, excipients or components of delivery devices, resulting in erythema, oedema, etc (Murphy, et al. 2000)
1.5 Sonophoresis:
Sonophoresis is a process that increase the absorption of the drug by using an ultrasound device. It can be used by treating the area with the drugs and then that area is treated by ultrasound probes. Ultrasound increases the absorption by cavitations, micro streaming and also by heat. Different frequencies can be useful for the generation of sound waves. Frequencies like 20 – 50 kHz and 1-3 MHz can be useful. sound wave can be form at lowest frequency 20 kHz. Lower frequencies have a better capacity to make better penetration. (Tehzel, et al., 2003).
Mechanism of sonophoresis:
To understand how Sonophoresis works, it is necessary to understand the mechanics of the lipid/water bi-layers in the stratum corneum. They act as one of the principal lines of barrier defense to protect the lower layers of the dermis. It is at this point many of the substances with high molecular weights repelled. This is due to the microscopic gaps between the lipid heads of the bilayers being too small to allow them through. Sonophoresis acts by temporarily reducing the density of lipids in the intercellular domain of the bi-layers. This “disruption” occurs due to a combination of micromechanical, thermic and cavitation effects that effectively “open up” the intracellular pathways, allowing substances with high molecular weights a higher degree of penetration (Ralph Hill, 2004).
1.6 Benefits of sonophoresis:
Sonophoresis in skin treatment produces high permeability of the skin and this allows a higher absorption of the ingredients which are useful for therapy. This provides economical use of therapeutic agents and greater response due to higher penetration (S Mitragotri,2004).
1.7 Use of sonophoresis:
Sonophoresis is a process that exponentially increases the absorption of topical compounds (transdermaldelivery) into the epidermis, dermisand skin appendages. Sonophoresis occurs because ultrasoundwaves stimulate micro-vibrations within the skin epidermis and increase the overall kinetic energyof molecules making up topical agents. It is widely used in hospitals to deliver drugs through the skin. Pharmacists compound the drugs by mixing them with a coupling agent (gel, cream, ointment) that transfers ultrasonic energy from the ultrasound transducer to the skin. The ultrasound probably enhances drug transport by cavitation, microstreaming, and heating. Sonophoresis is also used in Physiotherapy.
In addition to its effects in delivering compounds into the skin, sonophoresis is being investigated as a way of drawing compounds such as glucose out of the skin. (Ansel, et al., 2010).
Unfortunately, many of the active ingredients used in skin treatment therapy are complex molecular formulations, and fail to fully pass through this protective layer due to the alternating layers of lipid & water performing their functions correctly.
Sonophoresis acts by temporarily reducing the density of lipids in the intercellular domain of the bi-layers. This “disruption” occurs due to a combination of micromechanical, thermal and cavitation effects that effectively “open up” the intracellular pathways, allowing substances with high molecular weights a higher degree of penetration. These “openings” are known as Lacunae
Sonophoresis mechanism depends on
1. Cavitation
2. Thermal effects
3. Connective transport
4. Mechanical stress
Where mechanical and connective transport does not play much important role as cavitations. Cavitation is main phenomena for sonophoresis (Joshi, et al., 2002).
1.8 Cavitation:
Cavitation in the skin especially in the stratum corneum (SC) helps to disruption of lipid bi-layer which help faster permeation of drugs while cavitation outside the skin does not play any major role in sonophoresis but it cause skin erosion (Joshi, et al., 2002)
Cavitation involves generation and formation of gaseous bubbles in a liquid medium. Cavitation helps to improve bioavailability of drugs. Cavitation occurs mainly due to nucleation of small and large gaseous bubbles which causes destruction of lipid bi-layer and forms an aqueous channel in skin from which drugs can more easily permeate in to body and produce faster action, but cavitation also depends on frequency that was used. Lower frequency reduced acoustic cavitation which aids drugs permeation in to body. For example penetration at 20 kHz was 1000 times more effective than therapeutic ultrasound.(Mitragotri, et al., 2000).
NOW YOU CAN ALSO PUBLISH YOUR ARTICLE ONLINE.
SUBMIT YOUR ARTICLE/PROJECT AT articles@pharmatutor.org
Subscribe to Pharmatutor Alerts by Email
FIND OUT MORE ARTICLES AT OUR DATABASE
1.9 Ultrasound:
Ultrasound is cyclic soundpressure with a frequencygreater than the upper limit of humanhearing. Although this limit varies from person to person, it is approximately 20 kilohertz(20,000 hertz) in healthy, young adults and thus, 20 kHz serves as a useful lower limit in describing ultrasound. The production of ultrasound is used in many different fields, typically to penetrate a medium and measure the reflection signature or supply focused energy. The reflection signature can reveal details about the inner structure of the medium. The most well known application of this technique is its use in sonographyto produce pictures of fetuses in the human womb.
Ultrasound can be divided in to three type
1. Power ultrasound (20-100 kHz frequency)
2. Therapeutic ultrasound (1- 3 MHz frequency)
3. Diagnostic ultrasound (frequency more then 3 MHz)
1.10 Method of using ultrasound:
When using ultrasound for therapeutic means it is essential to control and optimise variables such as ultrasound intensity, pulse length and frequency. It is necessary to use a coupling medium like gel to ensure efficient transfer of the ultrasound in to the body as air reflects ultrasound. Ultrasound is a useful technique for delivery of topical medicaments (Griffin et al. 1967). Ultrasound frequency varies from 1 MHz to 3 MHz and intensity is 0.5 to 3 w/cm2. Coupling agent like Aquasonic 100, EMS therasonic, JPM ultrasound gel, KY gel, phusiomed ultrasonic transmission gel, SKF eko-gel are available in market.(Poltawski et al., 2007).
1.11 Importance of ultrasound:
Recent studies have shown that ultrasound mediated transdermal drug delivery offers promising potential for noninvasive drug administration (Mitragotri et al. 1995). In the past, ultrasound has been used physicians to treat patients with local musculoskeletal inflammation using topically applied steroids (Bly et al. 1995). More recently, the use of ultrasound is being explored for chemical activation of drugs by for treatment of cancers (sonodynamic therapy). The focus of this research is to develop a practicable method for drug delivery using low frequency (20 kHz) ultrasound to enhance the transport of insulin across skin using novel transducer designs. Of note, high frequency ultrasound in the MHz range has been used for transdermal delivery of various proteins and drug. The difference between high (1-3 MHz) and low (≈20 kHz) frequency ultrasound appears to be that low frequency ultrasound enhances transdermal drug transport 1000 times greater than high frequency ultrasound (Mitragotri et al. 1996). The hypothesis for the physical mechanism is that low-frequency ultrasound enhances transdermal transport through aqueous channels in the stratum corneum((Johnson et al. 1996).Dignostic ultrasound is safe, reliable and cheap way to observe various organs of the body. It is used in almost every field of medicine.
1.12 Franz diffusion cell:
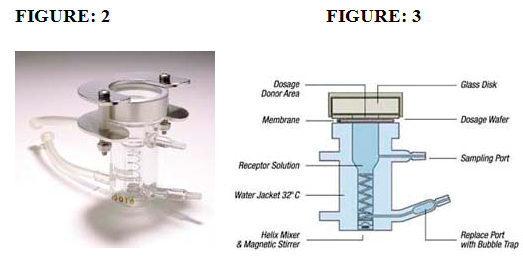
FIGURE:2 Franz diffusion cell used in the project
FIGURE:3 Schematic representation of Franz diffusion cell used in the project.
(References :- Scott, R.C., 1991.Prediction of percutaneous penetration, IBC Technical services, pp 107).
Franz diffusion cells are made of borosilicate glass components which are made up of two part. The upper part may be called the cell cap, cell top, donor chamber, or donor compartment. The lower portion is generally called the body of the cell; sometimes it is referred to as the receptor chamber but in the case of jacketed cells this is misleading as the receptor chamber is the innermost portion of the cell. The cellulose membrane is put between this upper and lower compartment. The upper part is donor compartment so the sample or drug put in upper part while the lower part is receptor chamber so filled with liquid like phosphate saline buffer. The lower part is in contact with the cellulose membrane. Bottom part also have has a sample port from which receptor liquid can be added and also aliquots can be withdrawn. The magnetic stirrer is put in the receptor chamber which is help to mix the donor sample homogenously coming from upper part with help of stirring device. Aliquots are withdrawn at the different time interval from sample port and same amount of receptor liquid is added at every time with the help of 10 ml syringe. Receptor chamber was covered with water jacket which maintains the temperature up to 40 C of receptor liquid. Temperature is maintained by inflow and outflow port of the receptor chamber with the heater.
Transdermal drug delivery is used for treatment of diseased skin and producing a local effect. Rate of transfer can be measured by the in-vivo and in-vitro techniques, such as the in vitro technique that uses a Franz diffusion cell. The size and the depth of the inlet compartment are important to avoid entrapment of air bubbles in the receptor compartment. It is a container which facilitates automated or manual removal of test sample from a receptor compartment of the diffusion cell. Absorption of drug can be measured by this cell. A test sample may be removing from the cell via a sampling port from the receptor compartment. Stirring device present in receptor compartment helps in even distribution. Refilling syringe attached with receptor compartment which helps to replaced liquid solution (PBS) in to receptor compartment when test sample have been withdrawn from the sampling port. Franz diffusion cells have an alter through which water at a constant temperature is circulated to maintain the temperature in the diffusion cell (Franz, et al., 1975).
1.12 Cellulose Membrane:
Now a day, different high performance membranes with variable surface chemistry have become subject of research due to their applications in biotechnology like in separation and isolation techniques. (L.R. Castilhoet al., 2002). These membranes can be use in medical applications as biocompatible material (J. Zhanget al., 2003).
Different membranes are used in the in-vitro drug delivery techniques like human skin, animal skin and synthetic membranes but now days synthetic membranes are used more like cellulose membrane, filter membrane because they are environmental friendly due to their biodegradability. Although they are more consistent than skin. Some time different in skin sample may be found because of the age of the person and area of body from which we got the skin. The skin of feet is too hard while skin of face region is to smooth because of this reason in experiment cellulose membrane was use which is made form biological material. It has a rigid structure and it consists of glycopyranose rings join by B-1-4 linkages. Before using the membrane it is soaked into distil water to make membrane soften and water allows membrane to swell ( Haigh et al., 1994).
1.14 Advantages of cellulose membrane:
·Same complex structure like stratum corneum layer of skin
·Stable structure
·Good mechanical strength
·Chemical inertness
·Good permeability
·Easily available
·Cheaper
·Can be used in affinity chromatography
·Useful in different diagnostic tools
1.15 Ibuprofen:
Ibuprofen is one of the non–steroidal anti-inflammatory drugs have analgesic activity comparable to that of paracetamol. Ibuprofen is a propionic acid derivative with anti-inflammatory, analgesic and antipyretic properties. It has fewer side effects then other non selective NSAIDs but its anti inflammatory properties are weaker. Doses of 1.6 to 2.4 g daily are needed for rheumatoid arthritis and it is unsuitable for conditions where inflammation is the prominent such as acute gout. Dexibuprofen is the active enantiomer of ibuprofen. It has similar properties to ibuprofen and is licensed for the relief of mild to moderate pain and inflammation.
Ibuprofen produces it effect by reversible inhibition of cyclo-oxygenase enzyme which is responsible for the inflammation by synthesis of prostaglandin. Prostaglandin is responsible for the inflammation process. It can be inhibit by using different NSAID. It can be given by two routes either orally or topically due to the more adverse effect associated with oral route like gastrointestinal effects, renal failure and heart failure so topical route is better than oral route because it have a lower plasma effects so it does not have any gastrointestinal effects and it has a very few side effects. A non steroidal drug like ibuprofen is very useful in rheumatoid arthritis (Heyneman, et al., 2000).
1.17 Gel formulation for topical use:
Different ibuprofen gel preparation available in market under the different name such as ibumousse, ibuleve, fenbid gel, ibugel, radian B ibuprofen gel, nurofen gel, phorpain gel, proflex cream, cuprofen gel. Different gel contain different amount of ibuprofen as well as other ingredients.
1. Ethyl hydroxyl cellulose: Emulsifying reagents, film forming reagents, water retention reagents, disperse reagent
2. Sodium hydroxide: Acid neutralizer (strong chemical base)
3. Benzyl alcohol: Use as a preservative due to bacteriostatic and antipruritic properties.
4. Isopropyl alcohol: Preservative, water solubilizer.
5. Purified water
Table:- List of different gel formulation which containing ibuprofen
|
Gel formulation |
Active ingredients |
|
Boots ibuprofen gel ( boots company PLC) |
Ibuprofen 10% w/w Ethyl hydroxyl cellulose Sodium hydroxide Benzyl alcohol Isopropyl alcohol Purified water |
|
Nurofen gel maximum strength (Crookes healthcare limited) |
Ibuprofen 10 % w/w Purified water Isopropyl alcohol Hydroxy ethyl alcohol Benzyl alcohol Sodium hydroxide |
|
Ibuleve gel (Diomed development limited) |
Ibuprofen 10 % w/w Industrial methylated spirit (IMS) Carbomers Diethyl amine Purified water |
Aim and objective:
Aim: To find out the penetration of transdermal preparation of ibuprofen (boots) at different frequency (20 kHz and 40 kHz) on cellulose membrane using ultrasound device (Sonophoresis).
Objectives:
(1)To find out the penetration of ibuprofen without applying any ultrasound frequency.
(2)To find out the penetration of ibuprofen at 40 kHz frequency for 10 minute using ultrasound device.
(3)To find out the penetration of ibuprofen at 20 kHz frequency for 2 minute using ultrasound device.
(4)To find out the penetration of ibuprofen at 20 kHz frequency for 5 minute using ultrasound device.
(5)To set up high performance liquid chromatography (HPLC) for analyse the ibuprofen.
NOW YOU CAN ALSO PUBLISH YOUR ARTICLE ONLINE.
SUBMIT YOUR ARTICLE/PROJECT AT articles@pharmatutor.org
Subscribe to Pharmatutor Alerts by Email
FIND OUT MORE ARTICLES AT OUR DATABASE
2. MATERIALS AND METHODS:
2.1 MATERIAL:
Boots Ibuprofen (10%)
Ibuprofen powder (sigma pharmaceutical)
HPLC grade methanol
HPLC grade water (MILLI-Q water)
Sodium acetate
Glacial acetic acid
Phosphate saline buffer (PBS)
The entire above chemical obtains from Fisher Scientific.
2.2 APPARATUS:
High performance liquid chromatography (HPLC) (Varian manufacture)
Galaxy prostar-210 software
Ultrasound device (20 kHz)
Ultrasound device (40 kHz)
Franz diffusion cell
Water circulating bath
Cellulose membrane
Magnetic stirrer
Syringe (1ml and 10ml).
The HPLC instrument is with UV detector.
1. Analytical (4-4.5 mm i.d.) (ug) persuite column was used in this experiment.
2.3 METHODS:
2.4 Preparation of acetate buffer:
The method for the preparation of acetate buffer was found from the British Pharmacopeia. It was made by dissolving 13.6 gm of sodium acetate and 6 ml of glacial acetic acid in 800 ml of de-ionised HPLC grade water and pH was adjusted up to 5.1 with the addition of 2.0 M NaOH and add sufficient water to the solution to make up to 1000 ml.
2.5 Preparation of mobile phase:
Take 250 ml of acetate buffer from the above preparation and add 750 ml of HPLC grade methanol to make up to 1000 ml of the mobile phase.
2.6 Preparation of ibuprofen stock solution:
Ibuprofen standard was provided by Sigma Laboratories. A standard solution was prepared by dissolving 50 mg of ibuprofen in 10 ml of HPLC grade methanol so that the final concentration was 5 mg/ml. Further dilutions in the range 5-50 ug/ml were made from 5mg/ml to prepare the standard curve of ibuprofen.
2.7 Experimental method:
The Franz diffusion cell was assembled as follows. Firstly the cellulose membrane was cut according to the size of the Teflon seal and soaked in the distilled water. The inner aperture of Teflon seal is 0.5 cm diameter. The membrane was placed between donor and receptor compartment and ring was put on it, after that boots ibuprofen gel was filled between donor and receptor compartment. Sample was collected at every 20 minute for first 1 hour and then at every 30 minute up to 4 hour so total experiment period was 5 hour. A 0.5 ml volume of sample was collected from Franz diffusion cell using 1 ml syringe and mix it into 1 ml of mobile phase. The sample was then analysed by high performance liquid chromatography (HPLC). Each sample was filtered before injection in to the HPLC. Different concentrations of the ibuprofen stock solution was made and injected in to HPLC and peak area was recorded to plot the standard calibration curve of ibuprofen.
2.8 Ultrasound application:
The first six replicates were carried out without applying ultrasound. Then two different frequencies were used 20 kHz and 40 kHz. Different instruments were required for different frequencies. These were taken from CMB laboratory of University of Hertfordshire. Ultrasound could be applied on using different frequencies and intensity. It could be set up by using different knob given in equipment. The cellulose membrane was put in 40 kHz frequency for 10 min.
The cellulose membrane is exposed to 20 kHz frequency for 2 minute.The cellulose membrane is also exposed to 20 kHz frequency for 5 minute. Six replicates were carried out for each frequency.
After applying the frequency the cellulose membrane was taken out and placed between the donor and receptor compartment. Sampling was reported as previously for the control.
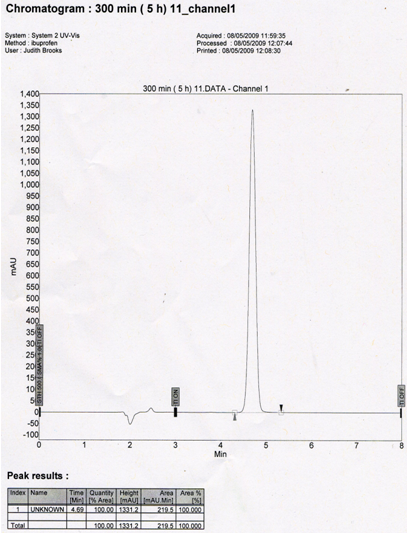
2.9 High performance liquid chromatography (HPLC) analytical method for ibuprofen:
The concentration of ibuprofen in receptor compartment was analysed by HPLC. It is a chromatographic system which is consists of manual sample injector. It consists of C-18 persuit column. The mobile phase which was a mixture of a 75% methanol and 25% of acetate buffer (Ph 5.1). It was delivered at a flow rate of 1ml/min and volume of sample was injected 20 ul. A series of the different concentration of the ibuprofen solution like 5 to 50 ug/ml was injected into column to take the standard curve of ibuprofen. UV detection was used at 222 nm. Then the sample were analysed in HPLC with retention time of 8 minute. Plot the graph of amount of ibuprofen vs. time. The peak were obtained and subjected by regression analysis. The flux of ibuprofen was carried out for each treatment. There was a linear relationship between the concentration of ibuprofen and its peak area as indicated by correlation coefficient (R2=0.989).
2.10 Data analysis method:
Standard calibration curve for the boots ibuprofen gel was plotted using Microsoft Excel programme and then an amount of ibuprofen (mg/ml) permeated through cellulose membrane surface area was plotted against time (min.) and linear phase was estimated for the graph and then regression analysis was performed to find THE GRADIENT of linear phase. The gradient represented the flux of ibuprofen for different test conditions
3.0 RESULTS:
3.1 Standard calibration curve of Ibuprofen:
The standard calibration curve was plotted using the data obtained in high performance liquid chromatography (HPLC) analysis. The line of best fit was used to find concentration of ibuprofen. The peak area shows line (R2= 0.989) of the concentration of ibuprofen (ug/ml). Graph shows that increase in area is directly proportional to the concentration of ibuprofen.
For calibrating standard calibration curve different concentration ibuprofen solution made in range of 5 to 50 ug/ml.
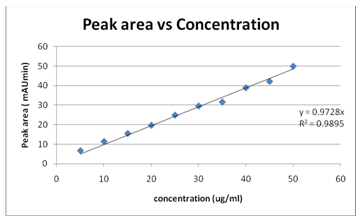
Graph:1 graph of peak area (mAUmin) vs concentration (ug/ml)
The main use of graph is to get the linear regression equation which was used to find out penetration rate of ibuprofen in control and ultrasound exposed sample.
NOW YOU CAN ALSO PUBLISH YOUR ARTICLE ONLINE.
SUBMIT YOUR ARTICLE/PROJECT AT articles@pharmatutor.org
Subscribe to Pharmatutor Alerts by Email
FIND OUT MORE ARTICLES AT OUR DATABASE
3.2 LINEAR REGRESSION EQUATION:
Linear regression equation is
Y= 0.972 X
Where Y= Peak area of sample obtained from HPLC
X= Concentration of ibuprofen
Concentration of ibuprofen can be found out using this linear regression equation. In this equation put the peak area in Y value. It can be calculated by re –arranging equation.
X=Y/0.972
By using this equation the concentration of ibuprofen was determined. Total amount of ibuprofen can also be calculated by using concentration obtained from equation and multiplying by the volume of receptor compartment in the Franz diffusion cell. It was also multiply by volume of mobile phase (1 ml) which was mixed with 0.5 ml of sample.
3.3 Total amount of ibuprofen:
Total volume of receptor compartment was 12 ml and from that 0.5 ml of sample was taken it was dissolved in 1 ml of mobile phase. Total volume of sample and mobile phase was 1.5 ml out of 1/3 part is only ibuprofen. Final amount of ibuprofen was 12x3=36. The concentration for each sample obtained from linear regression was multiply by 36. It indicates the amount of ibuprofen.
Amount of ibuprofen (ug) = concentration of ibuprofen x volume of cell (12 ml) x dilution factor (3)
Amount of ibuprofen (mg) = (concentration of ibuprofen x 36)/1000
Without frequency result
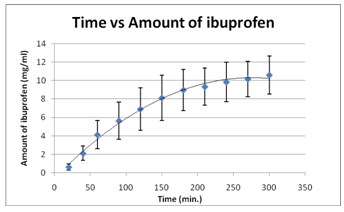 Figure: In- vitro release of boots ibuprofen gel treated without applying ultrasound.
The figure no represents the a data of table no present in appendix . It shows a running period time of 300 minute ( 5 hour). This graph demonstrates linear phase in first 90 minute (1.30 hour). It indicate that there was a gradually increase in amount of ibuprofen pass through cellulose membrane but after 90 minute it increase rapidly and it increase until 240 minute. After that there was a slightly increase in next one hour. Maximum penetration of ibuprofen through membrane was done at 240 minute. Highest amount of ibuprofen permeated through membrane was around 10.60 mg/ml.
40 kHz frequency result
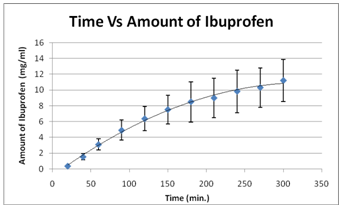
Figure: In- vitro release of boots ibuprofen gel max (10%) treated with ultrasound at 40 khz frequency for 10 minute.
The figure no represents the data of table no present in appendix . It shows a running period time of 300 minute ( 5 hour). This graph demonstrates linear phase in first 60 minute (1 hour). It indicate that there was a gradually increase in amount of ibuprofen pass through cellulose membrane but after 60 minute it increase rapidly and it increase until 300 minute. Maximum penetration of ibuprofen through membrane was done at 300 minute. Highest amount of ibuprofen permeated through membrane was around 11.20 mg/ml.
20 kHz 2 minute
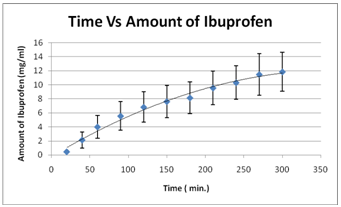
Figure: In- vitro release of boots ibuprofen gel max (10%) treated with ultrasound at 20 khz frequency for 2 minute.
The figure no represents the data of table no present in appendix . It shows a running period time of 300 minute ( 5 hour). This graph demonstrates linear phase in first 60 minute (1 hour). It indicate that there was a gradually increase in amount of ibuprofen pass through cellulose membrane but after 60 minute it increase rapidly and it increase until 300 minute. Maximum penetration of ibuprofen through membrane was done at 300 minute. Highest amount of ibuprofen permeated through membrane was around 11.86 mg/ml.
20 kHz 5 minute result
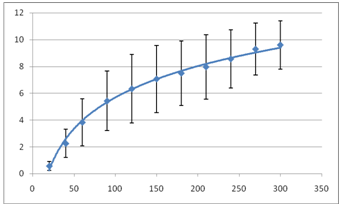
Figure: In- vitro release of boots ibuprofen gel max (10%) treated with ultrasound at 20 khz frequency for 2 minute.
The figure no represents the data of table no present in appendix . It shows a running period time of 300 minute ( 5 hour). This graph demonstrates linear phase in first 60 minute (1 hour). It indicate that there was a gradually increase in amount of ibuprofen pass through cellulose membrane but after 60 minute it increase rapidly and it increase until 300 minute. Maximum penetration of ibuprofen through membrane was done at 300 minute. Highest amount of ibuprofen permeated through membrane was around 9.603 mg/ml.
Comparisons of flux: Rate gradients (flux) could be found out using linear phase. Linear phase of graph was used to find flux. Slope values got from seven cells of control and ultrasound frequencies by using regression analysisof linear phase.
Comparison between flux of control and difference frequencies apply to boots ibuprofen gel max (10%).
Flux could be found out using the linear phase value. All regression analysis was done for linear phase to get slope value. Slope value for linear phase of control and different ultrasound frequencies could be seen in table
No present in appendix C.
Flux of boots ibuprofen gel at control and different ultrasound frequencies:
|
|
Control (mg/ml) |
40 KHz for 10 minute (mg/ml) |
20 kHz for 2 minute (mg/ml) |
20 kHz for 5 minute (mg/ml) |
|
CELL-1 |
0.04301 |
0.07550 |
0.07348 |
0.1034 |
|
CELL-2 |
0.07338 |
0.06530 |
0.07569 |
0.06056 |
|
CELL-3 |
0.02616 |
0.07328 |
0.08350 |
0.05398 |
|
CELL-4 |
0.05015 |
0.04396 |
0.05143 |
0.05388 |
|
CELL-5 |
0.02691 |
0.07129 |
0.07662 |
0.12623 |
|
CELL-6 |
0.02707 |
0.05091 |
0.06568 |
0.12174 |
|
CELL-7 |
0.03816 |
0.07652 |
0.06392 |
0.07296 |
|
|
|
|
|
|
|
MEAN |
0.04066 |
0.06525 |
0.07004 |
0.08467 |
|
SD |
0.01710 |
0.01285 |
0.01057 |
0.03178 |
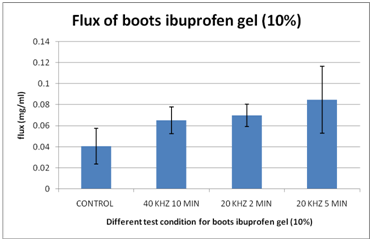 Figure : comparsion of rate gredient of ibuprofen gel control and different ultrasound frequency.
Table no represents the slope of control and ultrasound frequencies results for different franz diffusion cell. Statical results could be seen in results part. The above graph shows that the rate gredient was higher in 20 khz 5 min. The above graph clearly shows that as the ultrasound frequencies decrease the rate gredient (flux) was increase. The mean ± SD for control was 0.04066 ± 0.01710. The mean ± SD for 40 khz 10 min, 20 khz 2 min and 20 khz 5 min were 0.06525 ± 0.01285, 0.07004 ± 0.01057 and 0.08467 ± 0.03178 respectively.
NOW YOU CAN ALSO PUBLISH YOUR ARTICLE ONLINE.
SUBMIT YOUR ARTICLE/PROJECT AT articles@pharmatutor.org
Subscribe to Pharmatutor Alerts by Email
FIND OUT MORE ARTICLES AT OUR DATABASE
4.1 Discussion:
The main intension of this project was to find out the penetration of BOOTS ibuprofen at different frequencies using ultrasound device. Transdermal preparation used in this experiment was boots ibuprofen gel (10%). The penetration was calibrated by the Franz diffusion cell and final concentration of the ibuprofen was find out using the high performance liquid chromatography( HPLC). The penetration rate through the cellulose membrane was measured by using Franz- type diffusion cell and HPLC was used to analyse an amount of ibuprofen permeate through cellulose membrane.
As we shown from the result it indicate that as we increase the frequency the result was lower so that can indicate that the penetration of ibuprofen found out more at lower frequency then that of the higher frequency. A lower frequency is 1000 times better than higher frequency (Mitragotri, et, al., 2000). Lower frequency is also used to penetrate the protein through the skin. (Tiwari, et al., 2004). Now a day scientists are doing research on the insulin penetration through skin using novel transducers (Liu, et al., 2002).
Each transdermal preparation had a different penetration characteristic, which could be changed with different frequency and different intensity. The penetration result for 20 kHz 5 min was higher than all the other reading.
The ultrasound might be enhancing penetration of drug as temperature increase but it’s depend on different parameters like frequency, intensity, thermal effect of water and duration of intensity (Tiwari, et al., 2004). In this project we choose the frequency parameters to study the change for penetration of ibuprofen at different frequency. Temperature was recorded in this whole experiment and it was maintain at 40 c through the whole experiment.
One problem was found through the experiment was bubble formation which prevents the transfer of ibuprofen through the cellulose membrane (Mitragotri, et al., 2001). This is the reason for less penetration power at lower frequency at 20 kHz. Precautions were taken to prevent bubble formation.
Ingredients used in formulation might be affecting the penetration of ibuprofen.Boots ibuprofen gel contains hydroxyl ethyl cellulose. Cellulose was responsible for gel thickening agent. Viscosity of formulation could also impact on penetration through the membrane. (Poltawski & Watson., 2007).
The uv/ visible spectrophotometer were used to analyse presence and it showed consistent result at wavelength of 222 nm. It indicate that the highest peak area of ibuprofen. HPLC equipment used this time was already set up in a chemistry lab department of University of Hertfordshire. Different concentration of stock solution was measured and calibration curve was plotted.
The main intension for plotting the standard calibration curve was to get linear regression equation from which it could be easy to find concentration of ibuprofen. It plays a major role to find out an amount of ibuprofen.
As typical permeation profile described in the result section it devided in to 3 phases. Starting phase was lag phase where permeation of ibuprofen increased very slowly. It could be seen in first few minute then it show a linear phase where penetration of ibuprofen reached at maximum height and in last phase penetration of ibuprofen showed steady decrease in the result.
Reason for that one was diffusion principle as ibuprofen passes through the membrane from the donor compartment to receptor compartment. Ibuprofen gel was filled in donor compartment so concentration of ibnuprofen was high in donor compartment and as per diffusion principle amount of ibuprofen pass form high concentration to lower concentration. All the drug will not transfer to receptor compartment when equilibrium achieved between both compartment then drug stops move towards receptor compartment. It mean that when amount of ibuprofen become equal in both compartment then transfer of drug stop move toward receptor compartment so that was the reason why typical penetration profile show gradual decrease in amount of drug once it got achieved a maximum height. Ultrasound should be helpful to increase penetration of drugs through the different membrane ( Ueda, et al., 1995).
The lower frequencies like 20 Khz and 150 khz were more effective in trasdermal drug delivery system. (Tehzel, et al., 2003). Some study results were in favour of high frequencies like bommannan, et al., (1992) study also suggested that high frequency more then 2 MHz enhanced permeation of the drug. How ever thay reported that high frequency like 10 MHz AND 16 MHz were more effective than frequency such as 2 MHz. They facilitated the penetration os salicylic acid through an animal skin using different frequencies. Some clinical trial study suggested that high frequency ultrasound could be helpful in the treatment of defined margin ( small tumour ) in brest cancer( Wu, F. Et al., 2003). Some study show that ultrasound showed a little impact on transdermal delivery for low molecular weight heparin (Mitragotri & cost, et al., 2001).
In this experiment cellulose membrane exposed to continuous ultrasound for different frequencies. Pulsed ultrasound enhanced more penetration than contiouous ultrasound (Cagnie, B. et al., 2003). This would be one possible reason for less penetration through membrane using ultrasound because continuous ultrasound affect the permeation of ibuprofen. They also reported that ultrasound was more effective on synovial tissue than fat tissue.
Some other reason which affect the penetration of ibuprofen through membrane exposed to ultrasound like back diffusion from receptor compartment. Recent study performed in-vivo experiment using different gel formulation containing ibuprofen. They reported that for some topical preparation synthetic membrane should not be consider as a suitable model for skin when it was to measure permeation of drug because it has no capacity to reflect some complex interactions between skin and excipients of formulation. ( Herkenne, C. et al., 2007 ). They also reported that animal skin would be best model to predict in-vivo behaviour than synthetic membrane. Robertson & Baker et al., (2001) reported in their review that there where no significance difference observed between control and ultrasound for the treatment of pain using salicylic acid.
Air bubbles formation in receptor compartment or gel filled in the donor compartment would be responsible for less permeation of ibuprofen from cellulose membrane exposed to ultrasound and back diffusion would also be responsible for less permeation. However ibuprofen permeated through cellulose membrane exposed by using ultrasound was high in starting time. Permeation of ibuprofen could be enhanced by using ultrasound but treatment limited for only starting time so permeation of drug from formulation would be effective in treatment (Gullick, D.T. et al., 2005).
After getting the result the mean flux were calculated using linear phase for all graphs and for all the test condition. Mean flux values got from the linear phase were used to fine out the significance difference between the results. Significance difference was found out by performing the one way ANOVA. It was carried out for control and different ultrasound frequencies. Significance difference was accepted when P ≤ 0.05. According to statical analysis for control and different ultrasound frequencies value got for the significance difference was 0.004, which was lesser than 0.05 so there was a significance difference observed. Some the significance value was not lesser than 0.05 the reason for that might be back diffusion from receptor compartment, air bubbles.
Limitations:
This study had a number of limitations. The study was performed only for boots Ibuprofen gel (10%) but there are various ibuprofen preparation in market which also have to done and then compare the result of each preparation and find out which ingredient play a major role in ultrasound.
Sonicator bath used in this experiement were not same. Different sonicator bath used for different frequency. An equipment used for both frequency was different so there might be chances of difference in result. An instrument and chemicals provided for the study was also limited but it was according to limited time and fund. The result got for this experiment were good according to conditions and equipment.
Future improvement for the study:
In this study ultrasound used at lower frequency. It used in the range of kHz frequency but not in MHz so for future study higher frequency also used. Some previous result also indicate that higher frequency give good result in which frequency more than 2 MHz enhanced permeation of the drug. How ever thay reported that high frequency like 10 MHz and 16 MHz were more effective than frequency such as 2 MHz ( Wu, F. Et al., 2003). In this study ultrasound used alone to treat ibuprofen. Some time penetration enhancers might be helpful to increase permeation of different drug. Try out the other drug which have poor bioavailability at oral route may investigate for their permeability at transdermal route. Transdermal route suitable only for low molecular weight drug but if further research could be than it might be possible to delivery of molecule having high molecular weight.
Conclusion:
Form the result of the penetration at the different frequencies, it was concluded that among all the frequencies apply in the experiment the lower frequency (20 kHz) for 5 minute will give the higher penetration then other frequencies. As the frequency is higher than the penetration is lower. At lower frequencies the high penetration was found. Form the result there is clear indication each time the result is higher as the frequency was decrease.
NOW YOU CAN ALSO PUBLISH YOUR ARTICLE ONLINE.
SUBMIT YOUR ARTICLE/PROJECT AT articles@pharmatutor.org
Subscribe to Pharmatutor Alerts by Email
FIND OUT MORE ARTICLES AT OUR DATABASE


