About Authors:
Venkata Anil Kumar Sistla*, Dr.P.Venkateshwara Rao, P.Rajavel
Department of Pharmaceutical Analysis
A.M.Reddy Memorial College of Pharmacy,
Narasaraopeta - 522601,
Guntur Dt, India.
*anilkumar5831@gmail.com
{ DOWNLOAD AS PDF }
Abstract
A simple, selective, rapid, precise and economical reverse phase high pressure liquid chromatographic method has been developed for the simultaneous estimation of Paracetamol and Eperisone Hydrochloride in pharmaceutical Tablet dosage form. The mobile phase consisted of 60:40 % (v/v) of Methanol & 0.1% v/v orthophosphoric acid operated on isocratic mode. The flow rate is 1.0 ml/min. Chromatographic separation of Paracetamol and Eperisone Hydrochloride was performed on PHENOMENEX C18 column (150 X 4.6 cm, ODS, 5µm). The wavelength of detection is 270 nm. The injection volume is 20µL. The retention time of Paracetamol and Eperisone Hydrochloride are 2.21 ± 0.10 minutes and 2.74 ± 0.10 respectively. The run time of analysis is 6 minutes. The developed method was validated for parameters such as accuracy, precision, linearity, limit of detection, limit of quantitation. The influence of acid, alkaline, oxidative Stress and photolytic stress conditions on both the drugs was studied. Results indicated partial degradation in alkaline medium for Paracetamol and Eperisone Hydrochloride. The proposed method has been successfully used for the estimation in tablet dosage forms.
REFERENCE ID: PHARMATUTOR-ART-2059
1. Introduction
Paracetamol (Fig 1a) is chemically N-(4-hydroxyphenyl)acetamide. Paracetamol is official in all Pharmacopoeias. It is a widely used over-the-counter analgesic (pain reliever) and antipyretic (fever reducer).Paracetamol is classified as a mild analgesic. It is commonly used for the relief of headaches and other minor aches and pains and is a major ingredient in numerous cold and flu remedies. It act primarily in the CNS, increasing the pain threshold by inhibiting both isoforms of cyclooxygenase, COX-1, COX-2, and COX-3 enzymes involved in prostaglandin (PG) synthesis. Its exact mechanism of action is still poorly understood, but future research may provide further insight into how it works. The antipyretic properties of acetaminophen are likely due to direct effects on the heat-regulating centres of the hypothalamus resulting in peripheral vasodilation, sweating and hence heat dissipation.
Eperisone Hydrochloride (Fig 1b) is chemically (2RS)-1-(4-ethylphenyl)-2-methyl-3-(1-piperidyl)propan-1-one and hydrochloride. Eperisone hydrochloride is an antispasmodic drug. Eperisone acts by relaxing both skeletal muscles and vascular smooth muscles, and demonstrates a variety of effects such as reduction of myotonia, improvement of circulation, and suppression of the pain reflex. The drug inhibits the vicious circle of myotonia by decreasing pain, ischaemia, and hypertonia in skeletal muscles, thus alleviating stiffness and spasticity, and facilitating muscle movement. it acts at the level of spinal cord by blocking sodium channels and calcium channels. Eperisone HCl exerts its spinal reflex inhibitory action predominantly via a presynaptic inhibition of the transmitter release from the primary afferent endings via a combined action on voltage-gated sodium and calcium channels.
Literature review reveals that UV, HPLC methods are available for Paracetamol and Eperisone hydrochloride alone or in combined dosage forms. The aim of the present study was to develop accurate, precise and selective reverse phase HPLC methods for the simulated analysis of Paracetamol and Eperisone hydrochloride.
2. EXPERIMENTAL
2.1. Reagents and chemicals
Orthophosphoric acid (AR Grade, Merck ltd), Methanol (HPLC grade, Merck ltd), Milli-Q water, Paracetamol, Eperisone hydrochloride, glacial acetic Acid (GR Grade, SD Fine Chem Ltd). All other chemicals are of the highest grade commercially available unless otherwise specified. MYOSONE PLUS tablets for evaluation of the assay content were purchased from a local pharmacy.
2.2. Apparatus and chromatographic conditions
The Chromatographic system consisted of a Shimadzu Class VP Binary pump LC-10ATvp, SIL-10ADvp Auto sampler, CTO-10Avp Column Temperature Oven, SPD-10Avp UV-Visible Detector. All the components of the system are controlled using SCL-10Avp System Controller. Data acquisition was done using LC Solutions software.
The mobile phase consisted of 60:40 % (v/v) of Methanol & 0.1% v/v orthophosphoric acid operated on isocratic mode. The flow rate is 1.0 ml/min. Chromatographic determination of Paracetamol and Eperisone hydrochloride was performed on PHENOMENEX C18 column (150 X 4.6 mm id, ODS 2, 5µm). The wavelength of detection is 270 nm. The injection volume is 20µL.
2.3. Preparation of standard solutions, Calibration Standards & Quality Control Samples
Stock solutions of Paracetamol (1mg/mL), & Eperisone Hydrochloride (1mg/mL) were prepared separately in a volumetric flask using methanol and labeled accordingly. Suitable dilutions were then prepared using 50:50 %v/v Methanol & Milli-Q water as Diluent Solution. A Linear Calibration curve containing 7 non-zero standards were prepared using Diluent solution in the concentration range of 5-100 µg/mL for Paracetamol & 5-100 µg/mL for Eperisone hydrochloride. The calibration standard sample is then transferred into the auto sampler for analysis. Samples for Specificity (Sample with Paracetamol alone, sample with Eperisone hydrochloride alone, Blank Sample and sample containing both the drugs) were also prepared accordingly.
For the preparation of quality control samples, a separate stock containing approximately the same concentration of the Paracetamol and Eperisone hydrochloride were prepared and labeled as quality control stocks. From these stocks, quality control samples containing Paracetamol and Eperisone hydrochloride were prepared at three concentration levels namely LQC, MQC, and HQC so as to obtain low, median and high concentration quality control samples. The performance of the linear calibration curve is then evaluated using quality control samples.
2.4. Assay
The assay of tablets containing Paracetamol and Eperisone hydrochloride (Brand name: MYOSONE PLUS) is done. The active ingredients in each of 10 dosage units is taken by random sampling and analyzed by the developed method. For the current assay ten tablets were randomly taken and transferred separately into 100ml volumetric flasks and dissolved in 20 ml methanol. The solution was then ultrasonicated for 10min and then made up to volume. Required amount of solution is then taken and filtered through0.45μ nylon membrane and diluted with diluent solution so that the resultant concentrations are within the calibration range of the developed method. The samples are then analyzed by using the validated method. The sample is then injected in triplicate.
2.6 Method Validation
2.6.1 System Suitability
A sample containing mixture of Paracetamol (at concentration of 50μg/ml) and Eperisone hydrochloride (at concentration of 50μg/ml) was used as system suitability sample. System suitability was assessed by six replicate analysis. A percent coefficient of variation (% CV) less than 2 % for retention times for thedrugs is taken as the acceptance criterion.
2.6.2 Detection and Quantitation Limits (Sensitivity)
Limits of detection (LOD) and quantification (LOQ) (Fig-2) were estimated from both linearity calibration curve method and signal to noise ratio method. The detection limit was defined as the lowest concentration level resulting in a peak area of three times the baseline noise. The quantification limit was defined as the lowest concentration level that provided a peak area with signal to noise ratio higher than 5, with precision (%CV) and accuracy with (±) 20%.
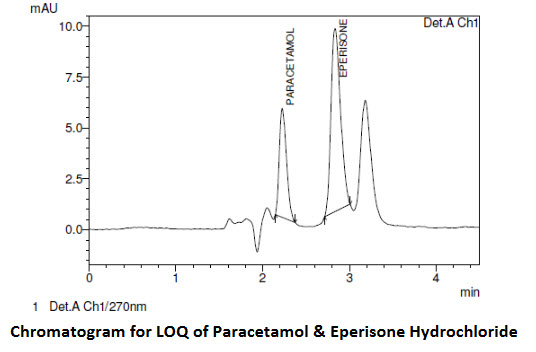
2.6.3 Linearity (Calibration Curve)
The calibration curve was constructed with seven non-zero standards ranging from 5 to 100 μg/mL for Paracetamol and 5–100 μg/mL for Eperisone hydrochloride. The linearity was evaluated by linear regression analysis, which was calculated by least square method. It is depicted in (Fig- 3).
2.6.4 Accuracy and Precision
Accuracy of assay method was determined for both intra-day and inter-day variations using triplicate analysis of the QC samples. Precision of the assay was determined by repeatability (intra-day) and intermediate precision (inter-day). Repeatability refers to the use of the analytical procedure within the laboratory over the shorter period of the time that was evaluated by assaying the QC samples during the same day. Intermediate precision was assessed by comparing the assays on different days (3 days).
2.6.5 Specificity
For demonstration of specificity, 4 samples namely blank sample, sample containing Paracetamol alone, sample containing Eperisone hydrochloride alone and sample containing the mixture of Paracetamol and Eperisone hydrochloride were prepared separately. Specificity of the method was determined by comparing results of all the samples (Fig-4). The developed method is said to be specific if the % interference calculated as peak area (if any) at the retention time of each of the analytes in the blank sample is less than 20% of peak area at the corresponding retention times of each of the drugs in the lowest calibration standard. Sample Specificity is also observed in the degradation study of the drug. None of the degraded products must interfere with the quantification of the drug.
2.6.6 Stress Degradation Studies
For Stress Degradation Analysis, 1 mL aliquots (in duplicate) of samples containing MQC level concentration are treated separately with 100 μL of 0.1N HCl (Acid stress), 0.1N NaOH (Alkaline stress), 5% v/v Hydrogen Peroxide (Oxidative Stress), for 24 Hrs. Samples for Photolytic stress are placed in a transparent glass vial & placed in a UV chamber for 24 Hrs. Samples are then injected for analysis. The results of analysis are then compared with similarly prepared fresh samples. The analysis is performed in triplicate.
3.0 RESULTS AND DISCUSSION
3.1 Method Development and Validation
The HPLC procedure was optimized with a view to develop an assay method. Therefore we evaluated the chromatographic behavior at different pH values ranging from pH 3.0 to pH 6.5 using various columns like Hypersil-BDS-C18, Symmetry C18, Ymc-pack C18, Ymc-pack pro, Spherisorb C18, Agilent Varian C18 columns have been tried with different buffer salts such ammonium Formate, ortho phosphoric acid, di-potassium hydrogen orthophosphate, in combination with acetonitrile, methanol and tetrahydrofuran. However less tailing and high theoretical plates are obtained with PHENOMENEX column C18 150 X 4.6 cm 5μm column. Mobile phase composition consisted of 60:40 % (v/v) of Methanol & 0.1% v/v orthophosphoric acid operated on isocratic mode. The flow rate of the method is 1.0 ml/min. Calibration standards were prepared in diluent solution containing 50:50 % v/v of methanol and milli-Q water. The wavelength of detection is 270nm. The column temperature is maintained at 25 OC. At the reported flow rate, peak shape was excellent; however increasing or decreasing the flow rate resulted in unacceptable tailing factor and poor peak shape. Hence 1.0 ml/min was optimized flow rate decreasing the consumption of the mobile phase, which in turn proves to be cost effective for long term routine quality control analysis. To evaluate the feasibility of the experiment under regular lab conditions, we assessed the stability of Paracetamol and Eperisone hydrochloride under room temperature and under normal light conditions.
3.2 Method Validation
3.2.1 System Suitability
The % RSD of the peak area for both drugs is within the acceptable criteria (Table-1). The efficiency of the column was expressed as the number of theoretical plates for the six replicate injections was around 7400 ± 75 for Paracetamol and 7299 ± 70 for Eperisone hydrochloride. The USP tailing factor was 1.34 ± 0.1 for Paracetamol while that of Eperisone hydrochloride is 1.45 ± 0.1.
3.2.2 Determination and Quantification Limits (Sensitivity)
Fig-2 represents the chromatogram of limit of detection and limit of quantification. The method is found to be sensitive which can be determined from the data obtained from the (Table-2).
3.2.3 Linearity
The linearity was demonstrated in triplicate. The results of the best fit line (y = mx + c) for the triplicate analysis is given in Table 3. The accuracy of the calibration standards was evaluated from the back calculated concentrations (Table 4). All the standards were found to be within the range of 90 -105% for Paracetamol and 90-105% for Eperisone hydrochloride.
3.2.4 Accuracy and Precision
Accuracy and precision calculated for the QC samples during the intra- and inter –day run are given the (Table-5). The intra-day (day-1) and inter-day accuracy for Paracetamol ranged from 90.44-101.38 % while that of Eperisone hydrochloride ranged from 93.12- 100.02 %. The results obtained from intermediate precision (inter-day) also indicated a good method precision. All the data were within the acceptance criteria.
3.2.5 Specificity
Specificity was determined by comparison of the Blank chromatogram with that of the Standard chromatogram (Fig-4)
3.2.6 Stress Degradation
Stress studies revealed that Paracetamol is not susceptible to degradation under acid, light (UV) and oxidative stress conditions (Fig 5a). However, in alkaline conditions (0.1N NaOH), the drug was instable and the degradation peak eluted earlier accompanied with a reduced peak area and irregular peaks were seen. Except for alkaline conditions, the drug content was within 95 –105 % for all stress conditions indicating the stability and specificity of the analytical method to differentiate the degradation peaks.
Stress studies on Eperisone hydrochloride indicated instability under alkaline conditions.
(Fig 5b).
3.2.8 Robustness study
Robustness is the measure of method capacity to remain unaffected by deliberate small changes in the chromatographic conditions. The experimental conditions were deliberately altered to evaluate the robustness of the method. The impact of flow-rate (1.0 ± 0.1 ml/min), and effect of mobile-phase composition (± 5%) on chromatographic parameters such as retention time, theoretical plates, and tailing factor, were studied. At lower flow rate (0.9ml),the retention time ofParacetamol was 2.5 ± 0.10 minutes while that of Eperisone hydrochloride was 3.1 ± 0.10 minutes . At lower flow rate (0.9ml), the tailing factor for Paracetamol decreased to 1.323 ± 0.03 while that of Eperisone hydrochloride also decreased to 1.407 ±0.03. At higher flow rate (1.1ml), tailing factor for Paracetamol increased to 1.360±0.03 and Eperisone hydrochloride also increased to 1.473 ± 0.03 as compared to normal flow. The elution was earlier at higher flow rate (1ml) ; Paracetamol and Eperisone hydrochloride eluted at 2.0 ± 0.01 and 2.5 ± 0.02 minutes respectively.
When Mobile phase composition was altered, at 65:35 v/v (MeoH : 0.1% OPA) , Peaks were merged and at 55:45 v/v (MeoH : 0.1% OPA), the retention time was increased to 2.3mins and 3.66mins for Paracetamol and Eperisone hydrochloride respectively.
3.3 Application of the method to dosage forms
The HPLC method developed is sensitive and specific for the quantitative determination of Paracetamol and Eperisone hydrochloride. Also the method is validated for different parameters; hence it has been applied for the simultaneous estimation in pharmaceutical dosage forms. MYOSONE PLUS was evaluated. The amount of Paracetamol in the tablet is 372.6 ± 0.06mg and amount of Eperisone hydrochloride is 49.28 ± 0.10 mg. None of the tablets ingredients interfered with the analyte peak. The spectrum of Paracetamol and Eperisone hydrochloride in the extracted tablet was matching with that of standard compounds indicating the purity of the compounds in the tablets.
Conclusions
The method gave accurate and precise results in the concentration range of 5 - 100 μg/mL for Paracetamol and 5 to 100μg/mL for Eperisone hydrochloride. The mobile phase composition consists of (60:40 v/v) of Methanol and 0.1% orthophosphoricacid (pH adjusted to 3.0 with glacial acetic acid), at the flow rate of 1.0 ml/min. The retention time of Paracetamol and Eperisone Hydrochloride are 2.21 ± 0.10 minutes and 2.74 ± 0.10 respectively. The column is PHENOMENEX, 150 X 4.6mm, C18 column with the particle size of 5μm. A rapid sensitive and specific method for the simultaneous estimation of Paracetamol and Eperisone hydrochloride in the pharmaceutical tablet formulations has been developed and validated.
Acknowledgement
The authors are sincerely thanks to A.M. Reddy Memorial College of Pharmacy, Narasaraopet, Guntur, Andhra Pradesh, India for providing the facilities to complete this research work.
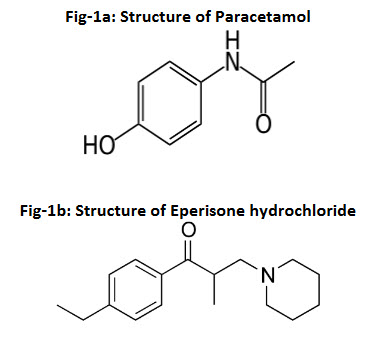
Fig-2: Chromatograms shown below indicate limit of Detection (LOD) above and Limit of Quantitation (LOQ) below.
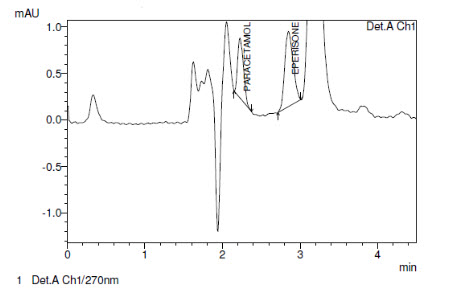
Chromatogram for LOD of Paracetamol & Eperisone Hydrochloride
Chromatogram for LOQ of Paracetamol & Eperisone Hydrochloride
Fig-3a: Linear calibration curve of Paracetamol ; Fig-3b: Linear calibration curve of Eperisone hydrochloride.
Fig-4: Specificity : Comparison of (a)Blank Chromatogram, (b) Paracetamol alone (c) Eperisone hydrochloride alone and (d) sample containing both Paracetamol and Eperisone hydrochloride
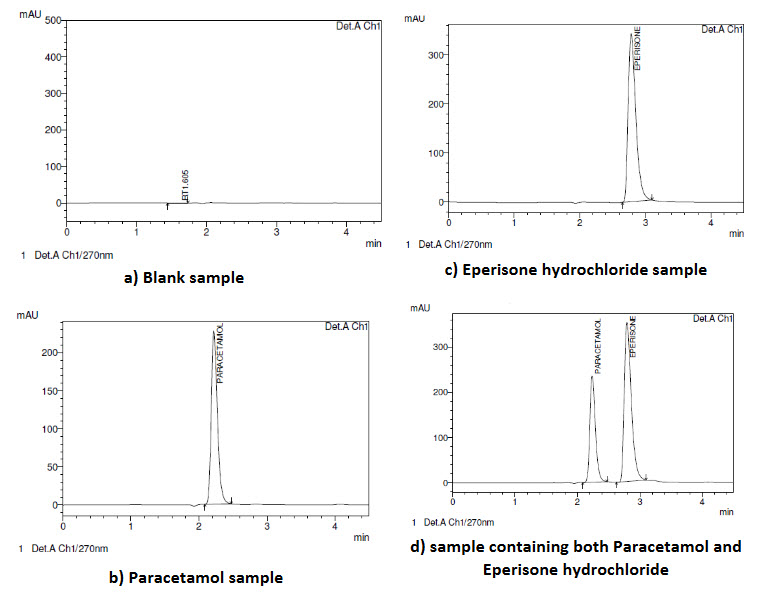
Fig-5a: Data indicating the spectral degradation of Paracetamol due to alkaline instability.
Fig-5b: Data indicating the spectral degradation of Eperisone hydrochloride due to alkaline stress
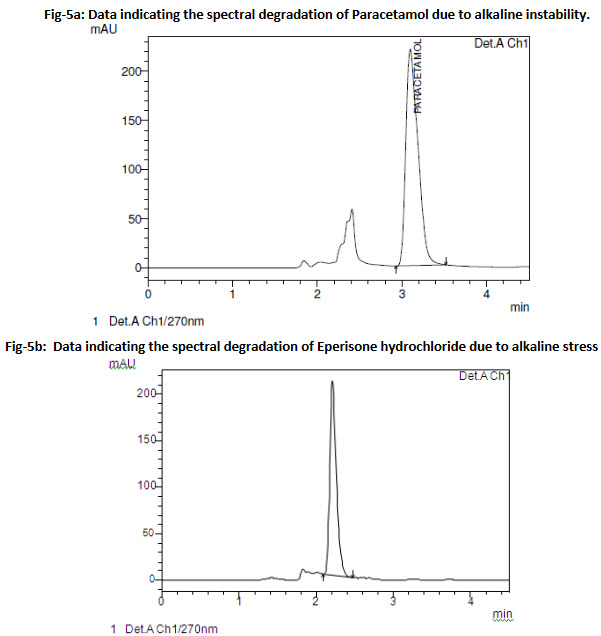
Table 1. System Suitability results for Paracetamol and Eperisone Hydrochloride
|
System suitability parameters |
Paracetamol |
Eperisone Hydrochloride |
|
%RSD for six replicate injections of standard |
0.23 |
0.53 |
|
Tailing factor |
1.340 |
1.452 |
|
Theoretical plates |
7400 |
7299 |
|
Resolution |
- |
2.81 |
Table 2. Sensitivity of Paracetamol and Eperisone hydrochloride by HPLC
|
Drug name |
Parameter |
Peak area |
Tailing factor |
Theoretical plates |
|
Paracetamol |
LOD |
3018 |
1.40 |
9770 |
|
LOQ |
30209 |
1.38 |
8383 |
|
|
Eperisone Hcl |
LOD |
16662 |
1.27 |
8253 |
|
LOQ |
64472 |
1.33 |
7796 |
Table 3. Results of Linearity analysis for Paracetamol and Eperisone Hydrochloride
|
Parameters |
Paracetamol |
Eperisone hydrochloride |
|
Slope |
29489 |
57864 |
|
Intercept |
13191 |
55174 |
|
Correlation coefficient |
0.997 |
0.99 |
Table 4. Linearity and Range for Paracetamol (above) and Eperisone hydrochloride (below) demonstrating accuracy, carryover effect and specificity of the method (Curve 1).
|
PARACETAMOL |
|||||
|
Sample ID |
Concentration (Microgram/mL) |
Retention Time |
Peak Area |
Back Calc Concentration |
% Accuracy |
|
Blank |
0 |
NA |
0 |
NA |
|
|
CC - 01 |
5.01 |
2.2 |
130654 |
4.88 |
97.36 |
|
CC - 02 |
10.01 |
2.20 |
275544 |
9.79 |
97.81 |
|
CC - 03 |
20.02 |
2.22 |
530795 |
18.45 |
92.14 |
|
CC - 04 |
40.04 |
2.22 |
1166579 |
40.01 |
99.92 |
|
CC - 05 |
60.06 |
2.22 |
1865452 |
63.71 |
106.07 |
|
CC - 06 |
80.08 |
2.22 |
2369204 |
80.79 |
100.89 |
|
CC - 07 |
100.10 |
2.22 |
2867916 |
97.70 |
97.60 |
|
Blank |
0 |
NA |
0 |
NA |
NA |
NA - Not applicable
|
EPERISONE |
|||||
|
Sample ID |
Concentration (Microgram/mL) |
Retention Time |
Peak Area |
Back Calc Concentration |
% Accuracy |
|
Blank |
0.00 |
NA |
0 |
NA |
NA |
|
CC - 01 |
5.04 |
2.79 |
224765 |
4.84 |
95.99 |
|
CC - 02 |
10.08 |
2.78 |
510935 |
9.78 |
97.06 |
|
CC - 03 |
20.12 |
2.79 |
1039838 |
18.92 |
94.06 |
|
CC - 04 |
40.33 |
2.79 |
2301401 |
40.73 |
100.98 |
|
CC - 05 |
60.50 |
2.78 |
3321441 |
58.35 |
96.45 |
|
CC - 06 |
80.66 |
2.75 |
4925577 |
86.08 |
106.72 |
|
CC - 07 |
100.83 |
2.75 |
5609976 |
97.90 |
97.10 |
|
Blank |
0 |
NA |
0 |
NA |
NA |
NA - Not applicable
Table 5a. Results of inter and intra-day accuracy & precision for Paracetamol by HPLC
|
DAY 1 |
LQC |
MQC |
HQC |
|
Mean |
22.64 |
49.09 |
69.65 |
|
SD |
0.53 |
0.92 |
1.96 |
|
%RSD |
2.36 |
1.88 |
2.81 |
|
Recovery (%) |
90.44 |
98.09 |
92.77 |
|
DAY 2 |
|
|
|
|
Mean |
22.71 |
49.34 |
69.77 |
|
SD |
0.56 |
0.86 |
1.91 |
|
%RSD |
2.46 |
1.74 |
2.73 |
|
Recovery (%) |
90.84 |
|
REFERENCES:
1.Patel PU, Patel SK, Patel UJ. Spectrophotometric method for simultaneous estimation of eperisoneHCl and diclofenac sodium in synthetic mixture, International Research Journal of Pharmacy, 2012, 3(9), 203–206.
2.Zhang Y, Ding L, Wei X, Zhang S, and Sheng J. Rapid and sensitive liquid chromatography-electrospray ionization-mass spectrometry method for the determination of eperisone in human plasma: method and clinical applications, Journal of Chromatographic Science, 2004, 42(5), 254–258.
3.Kondawar MS, Shah RR, Waghmare JJ, Shah ND, Malusare MK. UV spectrophotometric estimation of paracetamol and lornoxicam in bulk drug and tablet dosage form using multiwavelength method, International Journal of PharmTech Research, 2011, 3(3), 1603–1608,.
4.Sawant R, Bhangale L, Joshi R, Lanke P. Validated spectrophotometric methods for simultaneous estimation of Paracetamol, Domperidone and Tramadol HCl in pure and tablet dosage form, Journal of Chemical Metrology, 2010, 4(1),21–27,.
5.Kalra K, Naik S, Jarmal G, and Mishra N. Spectrophotometric method for simultaneous estimation of paracetamol and domperidone in tablet formulation, Asian Journal of Research in Chemistry, 2009,2(2),112–114,.
6.Narajji C, Patel HR, Karvekar MD, Babu ARS. Simultaneous estimation of aceclofenac, paracetamol and tizanidine in their combined dosage forms by spectrophotometric and RP- HPLC method, Journal of Analytical and Bioanalytical Techniques, 2011, 2(123).
7.Mahaparale S, Telekone RS, Raut RP, Damle SS, Kasture PV. Simultaneous spectrophotometric determination of drotaverine hydrochloride and paracetamol in tablet, Indian Journal of Pharmaceutical Sciences, 2010, 72(1), 133–136,.
8.Prasanna RB, Reddy MS. RP-HPLC method for simultaneous estimation of paracetamol and ibuprofen in tablets, Asian Journal of Research in Chemistry, 2009, 2(1), 70–72,
9.Monser L, Darghouth F. Simultaneous LC determination of paracetamol and related compounds in pharmaceutical formulations using a carbon-based column, Journal of Pharmaceutical and Biomedical Analysis, 2002,27(6), 851–860,.
10.Dudhane NP, Umekar MJ, Lohiya RT. Validated RP-HPLC method for estimation of metoclopramide hydrochloride and paracetamol in solid dosage form, Journal of Pharmaceutical Research, 2010, 3(12), 3064–3066
11.Yadav A, Singh R, Mathur S, Saini R, Singh G. A simple and sensitive HPTLC method for simultaneous analysis of domperidone and paracetamol in tablet dosage forms, Journal of Planar Chromatography, 2009, 22(6), 421–424.
12.Deshpanday Gandhi BVS, Bhangale SY. HPTLC method for simultaneous estimation of etoricoxib and paracetamol in combined tablet dosage. Journal of Pharmaceutical and Biomedical Analysis, 2010, 3(1-5)
13.BhattDivyang, Akhtar Jawed, Baghel Madhuri. Development and validation of Spectrophotometric Area under curve method for simultaneous estimation of Eperisone hydrochloride and Diclofenac sodium in combined capsule dosage form,International research journal of pharmacy,2013,4(2).
14.ShantaramGajananKhanage, Popat Baban Mohite, Sandeep Jadhav. Development and Validation of UV-Visible Spectrophotometric Method for Simultaneous Determination of Eperisone and Paracetamol in Solid Dosage Form, Advanced Pharmaceutical bulletin, 2013.
15.Nirav Uchadadiya, Falgun Mehta,Pinak Sanchaniya. Development and Validation of derivative spectrometric method for simultaneous estimation of Eperisone hydrochloride and Paracetamol in combined tablet dosage form, Novus International Journal of Chemistry, 2012, 1, 1,33-40.
|
PharmaTutor (ISSN: 2347 - 7881) Volume 1, Issue 2 Received On: 16/11/2013; Accepted On: 25/11/2013; Published On: 20/12/2013 How to cite this article: Sistla VA, Rao PV, P.Rajavel, Method development and validation of RP-HPLC method for the simultaneous estimation of Paracetamol and Eperisone Hydrochloride in Pharmaceutical Dosage Forms, PharmaTutor, 2013, 1(2), 88-98 |