

{ DOWNLOAD AS PDF }
ABOUT AUHTORS
Seema Farheen1*, Shaik Zubair1 , Alwala Arpini1, Govindapuram Kalpana Goud2, Saidulu Soppari3, Mangulal Kethavath4
1Department of pharmaceutics,
Vijaya College Of Pharmacy, Ranga Reddy, Telangana, India.
2Department of pharmaceutical Analysis and Quality Assurance,
SLC’S College Of Pharmacy, Nalgonda, Telangana, India.
3Department of pharmacology,
SLC’S College Of Pharmacy, Nalgonda, Telangana, India.
4Department of pharmaceutics,
SLC’S College Of Pharmacy, Nalgonda, Telangana, India
*seemafarheen75@gmail.com
ABSTRACT
Atomoxetine hydrochloride (atomoxetine) increased the risk of suicidal ideation in short-term studies in children or adolescents with Attention-Deficit/Hyperactivity Disorder (ADHD). Tablets of Atomoxetine Hydrochloride were formulated as sustained release tablet employing tamarind seed polysaccharide, guar gum, PVP, Mg. stearate, MCC the sustained release tablets was investigated. Sustained release matrix tablets contain Atomoxetine Hydrochloride were developed using different drug polymer concentration of tamarind seed polysaccharide, guar gum,. Tablets were prepared by directly using MCC. Formulation was optimized on the basis of acceptable tablet properties and in-vitro drug release. The resulting formulation produced robust tablets with optimum hardness, thickness consistent weight uniformity and low friability. All tablets but one exhibited gradual and near completion sustained release for Atomoxetine Hydrochloride, and 98.6% and 97.5 released at the end of 12 hrs. The results of dissolution studies indicated that formulation F8, the most successful of the study. An increase in release kinetics of the drug was observed on decreasing polymer concentration
[adsense:336x280:8701650588]
REFERENCE ID: PHARMATUTOR-ART-2489
|
PharmaTutor (Print-ISSN: 2394 - 6679; e-ISSN: 2347 - 7881) Volume 5, Issue 5 Received On: 19/01/2017; Accepted On: 28/01/2017; Published On: 01/05/2017 How to cite this article: Farheen S, Zubair S, Alwala A, Govindapuram KG, Saidulu S, Kethavath M;Formulation and Evaluation of Atomoxetine Hydrochloride Sustained Release Tablets; PharmaTutor; 2017; 5(5); 76-92 |
INTRODUCTON:
For many decades, treatment of acute disease or a chronic illness has been mostly accomplished by delivery of drugs to patients using various pharmaceutical dosage forms including tablets, capsules, pills, suppositories, creams, ointments, liquids, aerosols, and injectables as drug carriers. Drug may be administered by variety of routes but oral administration is adopted wherever possible. It is safest, easiest and most economical route of drug administration.[Chein-2002]
The basic goal of therapy is to achieve a steady state blood level that is therapeutically effective and non-toxic for an extended period of T. The design of proper dosage regimen is an important element in accomplishing this goal. Since there is increase in cost and compliance involved in the development and marketing of new drug entities, this has forced most of the pharmaceutical industries to focus their attention on the development of sustained / controlled /prolonged system.
Sustained release, prolonged action, controlled release, extended action, Td release, depot and repository dosage forms are terms used to identify drug delivery systems that are designed to achieve a prolonged therapeutic effect by continuously releasing medication over an extended period of T after administration of single dose. In the case of orally administered dosage forms, this period is measured in hrs and critically depends on the residence T of the dosage form in the GIT. [Lachmann-1991]
Sustained release technology is a relatively new field and as a consequence, research in the field has been extremely fertile and has produced many discoveries. New and more sophisticated sustained release drug delivery system constantly being developed and tested {Lachmann 2002]. Sustained release systems include any drug delivery system that achieves low release of drug over an extended period of T .
maintaining constant drug levels in the blood or target issue, it is considered as a controlled-release system. If it is unsuccessful at this but nevertheless extends the duration of action over that achieved by conventional delivery, it is considered as a prolonged release system. This is illustrated in the following Figure-1.
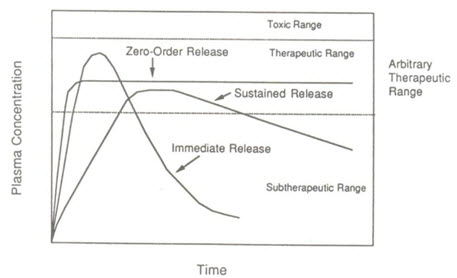
Figure1: Drug blood levels (µg/ml) versus Time (hr) profiles
The oral route of administration for sustained release systems has received greater attention because of more flexibility in dosage form design. The design of oral sustained release delivery systems is subjected to several interrelated variables of considerable importance such as the type of delivery system, the disease being treated, the patient, the length of therapy and the properties of the drug.
Classification of Sustained Release Systems: [Vyas 2002]
Table 1: Classification of Sustained Release Systems
|
Type of system |
Rate-control mechanism |
|---|---|
|
Diffusion controlled Reservoir system
Monolithic system |
Diffusion through membrane |
|
Water penetration controlled Osmotic system
Swelling system
|
Transport of water through semi permeable membrane water penetration into glossy polymer |
|
Chemical controlled Monolithic system Pendant system
Ion exchange resins |
Surface erosion or bulk erosion Hydrolysis of pendent group and diffusion from bulk polymer
Exchange of acidic or basic drugs with the ions present on resins.
|
|
Regulated system Magnetic, Ultrasoun
|
External application of magnetic field or ultrasound.
|
Oral sustained release products have gained importance because of the technological advances, which help achieve zero order release rate of the therapeutic substances. It is not possible to get an ideal sustained effect where the drug is given orally because the rate processes are influenced grossly by a number of factors via [Rang & Dale 2003].
• Variations in pH of the GIT.
• Gastric motility.
• Fluid volume and content of GIT.
• In-vivo dissolution rate and consequence bioavailability
This in the recent years, considerable attention has been focused on the development of controlled drug delivery systems for convenience and ambulatory patient compliance, which is a problem normally, associated with some class of drug such as non steroidal anti-inflammatory, anti-hypertensive, anti-asthmatic and antipyretic drugs.
Among all the methods, matrix dissolution controlled using swell able hydrophilic gum shave been extensively investigated. [Shivakumar 2001]
Polymers are used to control the release of drugs from different dosage forms administered orally. An ideal matrix formulation should contain polymers and diluents at amount as little as possible, is releasing its content in a sustained release profile over a reasonable length of T and preferably with a zero order kinetics [Vaithiyalingam 2002].
Hydrophilic matrices are an interesting option when developing an oral sustained release formulation. The drug release from such matrices can be controlled through their physical properties. Polysaccharides are the choice of materials among the hydrophilic polymers used, because they are non toxic and acceptable by the regulating authorities. The various polysaccharides used in drug delivery application are cellulose ethers, xantham gum, locust bean gum and guar gum. Another natural polysaccharide, Tamarind seed polysaccharide (TSP) obtained from the seed kernel of Tamarinds indicia, possesses properties like high viscosity, broad pH tolerance, non carcinogenicity, mucoadhesive nature, and biocompatibility. It is used as stabilizer, thickener, gelling agent and binder in food and pharmaceutical industries. The TSP constitutes about 65% of the tamarind seed components [Deveswara 2009].
Techniques for Preparation of Controlled Release Formulation: [Robinson 2009]
1. Barrier coating: The barrier coating principle can be applied to either beads or granules or to the whole tablet. If barrier coated granules or beads are used, usually one portion of the granules containing the drug is uncoated for the dosage form, and the rest of the granules are coated, where by different fractions may be done with different numbers of coats in order to get controlled release. The uncoated and coated beads or granules can either be filled into a hard gelatin capsules or they can be compressed in to a tablet. The coating material may be fats, waxes or plastic materials. The release mechanism is generally by diffusion or in some case erosion.
2. Matrix embedment: In this method drug is dispersed in a matrix of material, which may be capsulated in particulate form or compressed in to tablets .Release is controlled by a combination of several processes. These include permeation of the matrix by water, leaching of the drug from the matrix or erosion of matrix material. Three classes of retardant materials are used to prepare matrix tablet formulations.
1) Water in soluble, inert materials such as polyethylene, poly vinyl chloride, methyl acrylate-methacrylate copolymer, ethyl cellulose.
2) Insoluble, erodible materials such as stearyl alcohol, stearic acid, and poly ethylene glycol
3) Hydrophilic materials, the examples in this class include HPMC, Sodium CMC, Sodium alginate etc., Matrix systems are also called Monolithic devices. In a monolithic device the therapeutic agent is intimately mixed in a rate controlling polymer and release occurs by diffusion of the agent from the device. Two types of devices can be considered; one in which the active agent is dissolved in the polymer, where as in the other the active agent is dispersed in the polymer.
NOW YOU CAN ALSO PUBLISH YOUR ARTICLE ONLINE.
SUBMIT YOUR ARTICLE/PROJECT AT editor-in-chief@pharmatutor.org
Subscribe to Pharmatutor Alerts by Email
FIND OUT MORE ARTICLES AT OUR DATABASE
MATERIALS & METHODOLOGY:
Materials Used for the Formulation:
Table No:2
|
S. No. |
INGREDIENTS |
MANUFACTURER/ SUPPLIERS |
|---|---|---|
|
1 |
Atomoxetine Hcl |
Supra chemicals. Mumbai. |
|
2 |
Tamarind seed polysaccharide |
Self-extracted |
|
3 |
PVP K 30 |
Loba Chemie Pvt. Ltd., Mumbai |
|
4 |
Guar gum |
BASF Pvt. Ltd., Mumbai |
|
5 |
Magnesium Stearate |
Loba Chemie Pvt. Ltd., Mumbai |
|
6 |
Micro Crystalline cellulose |
SD Fine chemicals Ltd., Mumbai |
Equipments and Instruments Used:
Table No:3 Instruments used:
|
S.no |
NAME OFINSTRUMENT |
MANUFACTURINGCOMPANY |
|---|---|---|
|
1. |
Digital Balance |
Systonics pvt ltd, Japan. |
|
2. |
Tablet hardness tester |
Monsanto tablet hardness tester. |
|
3. |
Friability tester |
Rochelle friability test apparatus |
|
4. |
Vernier Caliper |
Mitutoyo Corporation, Japan |
|
5. |
Dissolution apparatus USPXXII |
Electro lab tablet dissolution Apparatus, Mumbai.
umbai |
|
6. |
Double beam UV Spectrophoto- Meter |
Lab India, Mumbai. |
|
7. |
Rotary tablet punching machine |
Shakti Pharmatech Pvt. Ltd., Ahmadabad. |
|
8. |
Ph meter |
Hanna Instruments, Japan |
|
9. |
FT-IR Spectrophotometer |
PerkinElmerspectrumRX1FT-IRSpectrometer |
METHODOLOGY
1.Extraction of Tamarind Seed Polysaccharide: [Reddy Art. 2003] To 20g of tamarind kernel powder, 200ml of cold distilled water was added and slurry was prepared. The slurry was poured into 800ml of boiling distilled water. The solution was boiled for 20 mints under stirring condition in a water bath. The resulting thin clear solution was kept overnight so that most of the proteins and fibers settled out. The solution was then centrifuged at 5000 rpm for 20mints. The supernatant was separated and poured into twice the volume of absolute ethanol by continuous stirring. The precipitate was washed with absolute ethanol, diethyl ether and petroleum ether and then dried at 50-60ºC under vacuum. The dried material was ground and sieved to obtain granules of different particle size range. The particle size range of 150-175 microns was used for preparation of tablets.
2. Pre formulation studies: Pre formulation testing is an investigation of physical and chemical properties of drug substances alone and when combined with pharmaceutical excipients. It is the first step in the rational development of dosage form.
3. Compatibility studies (Fourier Transform Infrared Spectroscopic studies):
Table No:2 The purpose Ingredients and functions used for the formulation:
|
SLNO. |
INGREDIENTS |
FUNCTIONS |
|---|---|---|
|
1 |
Atomoxetine Hcl |
Active ingredients |
|
2 |
Tamarind seed polysaccharide |
Polymer |
|
3 |
Guar gum |
Polymer |
4. Procedure: To study the compatibility of various formulation excipients with Atomoxetine hcl, solid mixtures were prepared by mixing the drug with each formulation excipient separately in the ration of 1:1 and it was filled enclosed vial sand placed instability chamber at 30±20C/65±5%RH. The solid admixtures were characterized using Fourier transform infrared spectroscopy (FT-IR).
5. Melting Point: Melting point of the drug was determined by using melting point apparatus. This was compared with the official melting point value of drug.
6 Development of Analytical Method of Drug:
Calibration curve of Atomoxetine hcl in phosphate buffer pH 7.4:
Preparation of phosphate buffer pH 7.4: 50 ml of the potassium dihydrogen phosphate (0.2M) solution was mixed with 39.5 ml of the sodium hydroxide (0.2M) solution in a 200 ml volumetric flask and then the volume was made up with water.
0.2Potassiumdihydrogenphosphatesolution:
27.218 g of potassium dihydrogen phosphate was dissolved in water and diluted with water to make the volume1000ml.
0.2 N NaOH:
8 g of NaOH was dissolved in 1000 ml of water.
Determination of λ max of Atomoxetine hcl in phosphate buffer pH 7.4:
A solution of Atomoxetine hcl in phosphate buffer pH7.4 was scanned in UV range between 200 to 350 nm (LabIndiaUV-1601 spectrophotometer, India). Atomoxetine hcl showed maximum absorbance at 274 nm in phosphate buffer pH7.4.
Calibration curve for Atomoxetine hcl:
Accurately weighed quantity of Atomoxetine hcl (50mg) was dissolved in phosphate buffer pH 7.4 in 50 ml volumetric flask (SSI). From SSI, 10ml solution was transferred to 50 ml volumetric flask and volume was made up with phosphate buffer pH 7.4 (SSII). From SSII, 10 ml solution was transferred to 50 ml volumetric flask and volume was made up
with phosphate buffer pH 7.4 (SSIII). 1, 2, 3, 4 and 5ml from SSIII were transferred to 10 ml volumetric flasks and diluted up to the mark to give 5, 10, 15, 20 and 25 μg/ml solutions respectively. The absorbance of these solutions was determined in UV spectrophotometer at 274 nm and calibration curve was plotted
7.Preparation of Matrix Tablets of Atomoxetine hcl: The Atomoxetine hcl sustained release tablets were prepared by direct compression method. Different concentrations of TSP and MCC for F1 to F6 and Guar gum for F7 to F12 were used. TSP used as matrix forming material, MCC used as diluent. Magnesium state incorporated as lubricant. All ingredients passed through a # 100 sieve, weighed and blended. The lubricated formulations were compressed using Rotary tablet machine with 12.00 mm flat punch. Tablet weight was (500mg) kept constant.
|
Ingredients |
F1 |
F2 |
F3 |
F4 |
F5 |
F6 |
F7 |
F8 |
F9 |
F10 |
F11 |
F12 |
|---|---|---|---|---|---|---|---|---|---|---|---|---|
|
Atomoxetine Hcl |
100 |
100 |
100 |
100 |
100 |
100 |
100 |
100 |
100 |
100 |
100 |
100 |
|
Tamarind seed polysaccharide
|
50 |
75 |
100 |
125 |
150 |
175 |
−− |
−− |
−− |
−− |
−− |
−− |
|
Guar gum |
−− |
−− |
−− |
−− |
−− |
−− |
50 |
75 |
100 |
125 |
150 |
175 |
|
Microcrystalline cellulose |
222 |
197 |
172 |
147 |
122 |
97 |
222 |
197 |
172 |
147 |
122 |
97 |
|
PVP K 30(5%) |
25 |
25 |
25 |
25 |
25 |
25 |
25 |
25 |
25 |
25 |
25 |
25 |
|
Magnesium stearate |
03 |
03 |
03 |
03 |
03 |
03 |
03 |
03 |
03 |
03 |
03 |
03 |
RESULTS AND DISCUSSIONS:
1 PREFORMULATION STUDIES OF PURE DRUG:
1 Drug Selection:
Atomoxetine hcl is one of the emerging CNS molecules used in the treatment of anti depressant .is newer derivative of Atomoxetine hcl and having less GIT complication, the short biological half-life 4 hr, and dosing frequency more than one per day make it an ideal candidate for modified release multiple unit preparation. To reduce the frequency of administrations and to improve patient compliances, atomoxetine hcl is suitable for making sustain release dosage form.
After oral administration, atomoxetine hcl is rapidly and completely absorbed as unchanged drug. Peak plasma concentrations are reached approximately 1.25 to 3.00 hr following ingestion. atomoxetine hcl , where the concentration reaches approximately 57% of those in plasma. The volume of distribution is approximately 25 Lit.
2.Dosage Form Selection:
The oral route of administration of the dosage form is one of the most convenient ways for administration of medicaments because of its safety and simplicity. Matrix technologies have often proven popular because of the simplicity of the manufacturing processes required, level of reproducibility, stability of the raw materials and dosage form as well as ease of scale up operation, validation and favorable in-vitro in-vivo correlation (IVIVC).
Classically simple matrix delivery systems exhibit first order or SQRT release kinetics. Matrix tablets are resistant to dose dumping. Due to the simple nature of the formulation and being robust they are unaffected by variations in ingredients. Matrix tablets containing hydrophilic polymers are common and commercially successful means of prolonging oral drug delivery and hence patient compliance.
3. Calibration curve of Atomoxetine hcl in Phosphate Buffer solution (pH 7.4): table:4
|
S.no |
Concentration(µg/ml) |
Absorbance |
Mean |
||
|
I |
II |
III |
|||
|
1 |
5 |
0.102 |
0.128 |
0.130 |
0.120 |
|
2 |
10 |
0.245 |
0.235 |
0.242 |
0.232 |
|
3 |
15 |
0.335 |
0.355 |
0.357 |
0.349 |
|
4 |
20 |
0.476 |
0.469 |
0.411 |
0.453 |
|
5 |
25 |
0.591 |
0.583 |
0.584 |
0.576 |
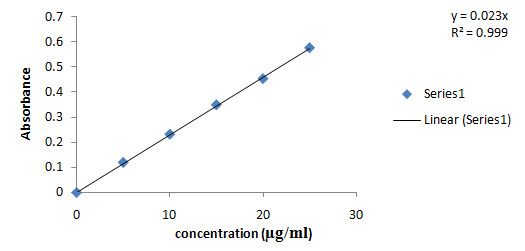
Fig. No:3 Calibration curve of Atomoxetine hcl in Phosphate Buffer solution (pH 7.4)
4. Matrix Tablets
The use of naturally occurring polymers TSP and Guar gum in the design of matrix tablets has been the focus of recent research activities because of their biocompatibility, hydro gel properties, cost effective and also reduces the risk of systemic toxicity due to dose dumping. The objective of the present study is the formulation and in-vitro evaluation of matrix tablets of atomoxetine hcl using natural polymers. atomoxetine hcl widely used in the anti depressant . TSP and guar gum used as release retardant in the present research work. The retardant materials that are commonly used include hydrophilic and hydrophobic polymers.Hydrophilic polymers are becoming very popular in formulating oral sustained release tablets. As the fluid or media penetrates the matrix tablet, the polymer swells and drug diffuses from the system at a rate determined by nature and composition of polymer. Tablets were prepared by direct compression method with polymers, with compressible vehicles (micro crystalline cellulose), binder (PVPK30) and lubricants (Mg. stearate) to improve compaction, flow and release properties of tablets.
5. Melting point determination
Melting point of Atomoxetine Hcl was found to be in the range of which is almost the standard value of; indicate the purity of the drug sample.
6. Drug - polymer Compatibility Studies:
Compatibility studies of pure drug atomoxetine hcl with polymers were carried out prior to the formulation of tablets. IR spectra of pure drug and polymers were taken. All the characteristic peaks of atomoxetine hcl were present in spectra at respective wavelengths. Thus, indicating compatibility between drug and polymers. It shows that there was no significant change in the chemical integrity of the drug.
Compatibility study is important to understand the interaction between the drug and polymers. It saves costs and it makes easier to choose a few excipients from the long list of excipients for a better formula.
Drug excipients compatibility studies were carried out at an accelerating condition
300C±20 C/60%±5%RH. A small quantity of each mixture was evaluated by FTIR with the control i.e. the pure atomoxetine hcl and the excipient was studied. It was found that all peaks corresponding to different functional groups of pure drug were present in the polymers, this shows the absence of interaction between the drug and polymers
Spectroscopy of pure Atomoxetine Hcl and polymer:
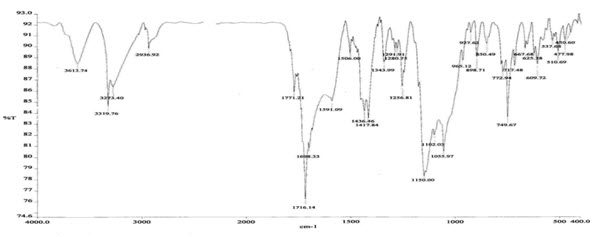
Figure 4: FTIR Spectroscopy of pure drug

Figure 5: FTIR Spectroscopy of Tamarind seed polysaccharide
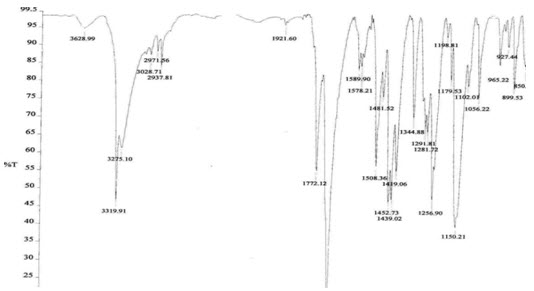
Figure6: FTIR Spectroscopy pure drug + Tamarind seed polysaccharide

Figure7: FTIR Spectroscopy Guar gum
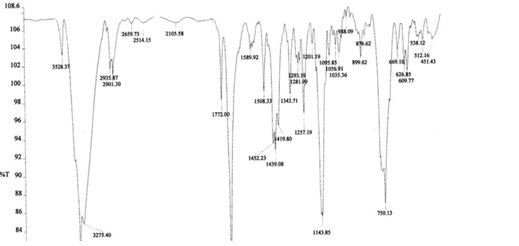
Figure8: FTIR Spectroscopy pure drug + Guar gum
NOW YOU CAN ALSO PUBLISH YOUR ARTICLE ONLINE.
SUBMIT YOUR ARTICLE/PROJECT AT editor-in-chief@pharmatutor.org
Subscribe to Pharmatutor Alerts by Email
FIND OUT MORE ARTICLES AT OUR DATABASE
The IR spectrum of the pure drug (atomoxetine hcl) exhibited its characteristic absorption bands in the IR region. The FT-IR spectrum of pure drug and FT-IR spectra of the polymers showed that there is a negligible difference in the position of characteristics of absorption bands of the functional groups of the drug. Thus, it is clear from FT-IR study that there is no interaction of the drug with the polymer.
7. Identification of Drug: table:5
|
3273 |
N-H stretching of amino group. |
|
3319 |
COOH stretching of carboxylic acid group |
|
2937 |
C-H stretching of CH2groups. |
|
1638 |
N-H stretching |
|
1056 |
O-H stretching of carboxylic acid groups |
|
1508, 1589, 1452 |
C=C ring stretching (hybrid bond)
|
|
1438 |
C-H bending of CH2 groups
|
|
1288 |
C-N stretching. |
|
1281 |
C-O bending |
|
749 |
Aromatic deformation |
Compatibility studies of pure drug atomoxetine hcl with polymers were carried out prior to the formulation of tablets. IR spectra of pure drug and polymers were taken. All the characteristic peaks of atomoxetine hcl were present in spectra at respective wavelengths. Thus, indicating compatibility between drug and polymers. It shows that there was no significant change in the chemical integrity of the drug. Compatibility study is important to understand the interaction between the drug and polymers. It saves costs and it makes easier to choose a few excipients from the long list of excipients for a better formula.
2 . PRE-COMPRESSION PARAMETERS:
The granular properties like LBD, TBD, Compressibility index and Angle of repose, for the batches F1-F12, were determined and the results were reported in table 6.
|
Formulation code |
Parameters |
||||
|
Angle Of Repose
|
Bulk Density (g/ml) |
Tapped Density (g/ml)
|
Compressibility Index (%) |
||
|
F1 |
27.22± 1.6 |
0.495±0.004 |
0.547± 0.019 |
13.29± 0.75 |
|
|
F2 |
27.15± 1.31 |
0.495±0.004 |
0.555± 0.016 |
12.10± 1.63 |
|
|
F3 |
26.22± 1.58 |
0.470± 0.003 |
0.526± 0.012 |
10.64± 1.33 |
|
|
F4 |
29.45± 1.42 |
0.470±0.009 |
0.520± 0.013 |
13.40± 1.48 |
|
|
F5 |
28.12± 1.57 |
0.465± 0.006 |
0.536± 0.014 |
16.21± 0.78 |
|
|
F6 |
25.90±1.22 |
0.465± 0.005 |
0.512± 0.011 |
15.16±1.35 |
|
|
F7 |
24.10± 1.6 |
0.450± 0.005 |
0.520± 0.013 |
13.10± 0.75 |
|
|
F8 |
23.51± 1.31 |
0.495±0.004 |
0.512± 0.011 |
14.12± 1.63
|
|
|
F9 |
27.97± 1.58 |
0.470± 0.003 |
0.536± 0.014 |
12.64± 1.33 |
|
|
F10 |
29.82± 1.42 |
0.470±0.009 |
0.526± 0.012 |
16.20± 1.48 |
|
|
F11 |
28.96± 1.57 |
0.465± 0.006 |
0.555± 0.016 |
15.21± 0.78 |
|
|
F12 |
26.14±1.22 |
0.465±0.004 |
0.547± 0.0018 |
14.18± 1.35 |
|
Values of angle of repose are rarely 20o and values up to 40o indicate reasonable flow properties. Above 50o however the powder flows only with great difficulties. Dynamic angle of repose measurements can be replicated with relative standard deviations of approximately 2%. They are particularly sensitive to changes in particle size distribution and to the moisture content, and they provide a rapid means of monitoring significant batch to batch differences in these respects.
The Carr’s Index (Compressibility) of the powders was in the range of 10.64±1.33 to 16.21±0.78. The angle of repose of the powders was in the range of 24.10±1.60 to 29.82±1.420, which indicate a good flow property of the powders. Here the angle of repose was found to be below 40o. This shows that the reasonable flow property of powders. The results are shown in Table 14, 15.
POST-COMPRESSION PARAMETERS:
The formulated tablets were subjected for post- compression evaluation such as thickness, hardness, weight variation, friability, drug content, swelling studies, and in vitro dissolution studies.
3.1 Tablet Thickness:
The results of thickness for formulated tablets were determined using a screw gauge and results are shown in Table 16, 17.
3.2 Hardness test:
The mean values of hardness of tablets are shown in Table 16, 19. The hardness of all formulations was in the range of 5.6±0.13 to6.4±0.34 kg/cm2. Hardness test will be done by Monsanto Hardness Tester
3.3 Friability test:
The friability values of prepared tablets are given in Table 7. The values ranged from 0.163± 0.13to0.549± 0.11 %
|
Formulation code |
Thickness (mm) |
Hardness (kg/) |
Friability (%)(n=10) |
|---|---|---|---|
|
F1 |
3.88± 0.16 |
5.8±0.10 |
0.163± 0.13 |
|
F2 |
3.89± 0.18 |
6.0±0.24 |
0.220± 0.41 |
|
F3 |
3.85± 0.32 |
5.7±0.14 |
0.320± 0.21 |
|
F4 |
3.90± 0.03 |
5.9±0.12 |
0.262± 0.12 |
|
F5 |
3.93± 0.16 |
6.3±0.35 |
0.420± 0.35 |
|
F6 |
3.96± 0.14 |
6.2±0.13 |
0.490± 0.21 |
|
F7 |
3.91± 0.16 |
6.2±0.25 |
0.341± 0.013 |
|
F8 |
3.75± 1.31 |
6.0±0.34 |
0.549± 0.11 |
|
F9 |
3.77± 0.58 |
5.9±0.15 |
0.269± 0.014 |
|
F10 |
3.87± 1.42 |
6.3±0.44 |
0.420± 0.012 |
|
F11 |
3.76± 1.57 |
5.6±0.13 |
0.368± 0.016 |
|
F12 |
3.74± 1.22 |
6.4±0.34 |
0.450± 0.010 |
The punches used to compress the tablets were 12.08 mm, spherical shaped. The shape and size of the tablets were found to be within the limit. The hardness of the tablets was found to be in the range of 5.6±0.13 to 6.4±0.34Kg/cm2. It was within the range of monograph specification. Thickness of the tablets was found to be in the range of 3.74±0.03 to 3.96±1.6mm. The friability of the tablets was found to be less than 1% and it was within the range of standard specification.
3.4 WEIGHT VARIATION TEST:
Twenty tablets were randomly selected from each formulation and evaluated. The average weight of each formulation was recorded and is shown in Table 15. The values were almost uniform. The average values of tablets ranged from 501.0 to 501.5mg. table :8
|
S.NO |
F1 |
F2 |
F3 |
F4 |
F5 |
F6 |
F7 |
F8 |
F9 |
F10 |
F11 |
F12 |
|
1 |
401.1 |
400.5 |
399.6 |
400.5 |
399 |
400.9 |
400.3 |
400.4 |
399.7 |
401.9 |
400.9 |
400.7 |
|
2 |
401.3 |
400.6 |
399.4 |
399.9 |
400.5 |
391.2 |
401.2 |
398.9 |
398.2 |
399.2 |
399.8 |
400.4 |
|
3 |
401.5 |
400 |
400.2 |
401.2 |
400.1 |
400.1 |
400.1 |
400.7 |
399.9 |
400.2 |
399.8 |
402.8 |
|
4 |
400.2 |
398.2 |
401.3 |
402.4 |
401.3 |
400.9 |
400.9 |
400.4 |
399.6 |
400.3 |
400.2 |
401.7 |
|
5 |
400.8 |
399.7 |
402 |
400.8 |
400.2 |
399.8 |
399.8 |
402.3 |
400.2 |
402.2 |
400.9 |
400.2 |
|
6 |
400.5 |
401.7 |
400.8 |
400.9 |
400.4 |
399.8 |
399.8 |
401.7 |
400.1 |
399.8 |
401.3 |
400.8 |
|
7 |
400.7 |
400.7 |
399.8 |
400.7 |
399.6 |
400.2 |
400.2 |
400.2 |
399.5 |
399.7 |
402 |
399.8 |
|
8 |
401.6 |
400.7 |
399.6 |
400.2 |
400.2 |
400.8 |
400.8 |
400.8 |
400.5 |
401.2 |
400.8 |
400.2 |
|
9 |
400.2 |
400.2 |
400.1 |
400.1 |
400.4 |
400.7 |
400.7 |
400.3 |
400.2 |
400.8 |
399.8 |
400.8 |
|
10 |
401.6 |
400.3 |
401.2 |
401.2 |
398.8 |
400.6 |
400.6 |
401.4 |
399.9 |
400.3 |
399.6 |
400.7 |
|
Avg. wt |
401.0 |
400.2 |
400.4 |
400.1 |
400.1 |
400.5 |
400.4 |
400.7 |
399.8 |
400.6 |
399.2 |
400.7 |
|
% SD |
0.548 |
0.806 |
0.872 |
0.739 |
0.739 |
0.500 |
0.152 |
0.936 |
0.639 |
0.946 |
0.603 |
0.741 |
3.5 SWELLING INDEX:
Swelling index of the dosage form is conducted by using USP dissolution apparatus-II in 900 ml of pH 7.4 phosphate buffer which is maintained at 37±0.5°C, rotated at 50rpm and results were shown in table 9.
|
Time (hr) |
F1 |
F2 |
F3 |
F4 |
F5 |
F6 |
F7 |
F8 |
F9 |
F10 |
F11 |
F12 |
|
0 |
0 |
0 |
0 |
0 |
0 |
0 |
0 |
0 |
0 |
0 |
0 |
0 |
|
1 |
74.93 |
86.06 |
89.43 |
90.12 |
95.81 |
97.93 |
73.84 |
75.0 |
82.21 |
89.2 |
93.57 |
96.87 |
|
2 |
112.4 |
128.6 |
132.5 |
150.0 |
155.6 |
167.8 |
110.7 |
114.6 |
122.4 |
147.32 |
148.98 |
165.76 |
|
3 |
144.8 |
152.2 |
162.3 |
177.8 |
177.8 |
181.8 |
131.8 |
137.1 |
142.5 |
171.97 |
171.64 |
178.69 |
|
4 |
68.62 |
167.2 |
185.8 |
190.2 |
198.2 |
202.1 |
61.6 |
154. 2 |
165.3 |
183.86 |
171.64 |
198.32 |
|
5 |
−− |
76.93 |
200.1 |
207.8 |
211.1 |
220.1 |
−− |
74.93 |
198.7 |
183.86 |
209.87 |
218.32 |
|
6 |
−− |
−− |
230.5 |
245.5 |
252.1 |
267.6 |
−− |
−− |
227.9 |
245.56 |
248.65 |
254.55 |
|
7 |
−− |
−− |
260.6 |
278.4 |
287.3 |
294.5 |
−− |
−− |
260.6 |
262.10 |
276.89 |
284.09 |
|
8 |
−− |
−− |
288.9 |
291.2 |
298.1 |
307.3 |
−− |
−− |
279.3 |
287.43 |
288.34 |
302.48 |
|
9 |
−− |
−− |
88.43 |
309.1 |
318.4 |
314.3 |
−− |
−− |
89.56 |
287.43 |
311.12 |
316.43 |
|
10 |
−− |
−− |
−− |
313.2 |
325.1 |
329.3 |
−− |
−− |
−− |
310.62 |
321.25 |
324.78 |
|
11 |
−− |
−− |
−− |
322.8 |
273.9 |
300.5 |
−− |
−− |
−− |
318.34 |
273.87 |
301.87 |
|
12 |
−− |
−− |
−− |
273.7 |
254.2 |
287.0 |
−− |
−− |
−− |
282.89 |
249.54 |
278.12 |
3.6 IN VITRO DISSOLUTION STUDIES
In-vitro drug release studies were carried out using USPXXII dissolution apparatus type2 (Electro lab, Mumbai, India) at 50 rpm and results were shown in table 10
|
Time (hr) |
F1 |
F2 |
F3 |
F4 |
F5 |
F6 |
F7 |
F8 |
F9 |
F10 |
F11 |
F12 |
|
|
0 |
0 |
0 |
0 |
0 |
0 |
0 |
0 |
0 |
0 |
0 |
0 |
0 |
|
|
1 |
30.93 |
26.06 |
23.43 |
21.37 |
17.81 |
17.81 |
29.25 |
28.31 |
27.75 |
25.68 |
22.31 |
19.68 |
|
|
2 |
50.53 |
49.68 |
27.56 |
25.5 |
20.62 |
25.68 |
49.31 |
48.37 |
36.93 |
32.25 |
33.18 |
21.75 |
|
|
3 |
67.87 |
66 |
34.31 |
32.25 |
32.81 |
32.43 |
74.06 |
72.93 |
44.06 |
35.81 |
38.81 |
34.12 |
|
|
4 |
98.62 |
77.25 |
44.81 |
38.43 |
42.56 |
38.25 |
87.75 |
77.25 |
53.62 |
45.75 |
46.12 |
43.68 |
|
|
5 |
−− |
96.93 |
60.18 |
59.06 |
49.87 |
48.18 |
97.87 |
95.43 |
65.62 |
54.75 |
52.12 |
50.81 |
|
|
6 |
−− |
−− |
78.56 |
74.62 |
53.43 |
61.12 |
−− |
−− |
87.56 |
69 |
60.18 |
54.75 |
|
|
7 |
−− |
−− |
82.68 |
79.5 |
65.43 |
70.31 |
−− |
−− |
97.12 |
86.25 |
67.12 |
66.56 |
|
|
8 |
−− |
−− |
90.93 |
87.56 |
70.87 |
79.12 |
−− |
−− |
−− |
93.18 |
88.12 |
72 |
|
|
9 |
−− |
−− |
98.43 |
93.37 |
87.18 |
83.43 |
−− |
−− |
−− |
98.50 |
95.25 |
88.5 |
|
|
10 |
−− |
−− |
−− |
97.68 |
91.68 |
87.18 |
−− |
−− |
−− |
−− |
96.68 |
92.62 |
|
|
11 |
−− |
−− |
−− |
−− |
93.93 |
90.93 |
−− |
−− |
−− |
−− |
−− |
95.06 |
|
|
12 |
−− |
−− |
−− |
−− |
98.06 |
94.12 |
−− |
−− |
−− |
−− |
−− |
97.5 |
|
In-vitro release studies were carried out for all the formulations as per USP-II tablet dissolution test employing rotating paddle at 50 rpm using 900 ml of phosphate buffer of pH 7.4 as dissolution medium. The results were evaluated for 12hr. As per the results (Table 23,24) of dissolution study formulations F1, F2, F3, F4, F5, F6, F7, F8, F9, F10, F11 and F12 showed 98.62, 96.93, 98.43, 97.68, 98.06, 94.12, 97.87, 99.43, 97.12, 98.50, 96.68 and 97.5 % respectively. This showed that the drug release from the tablet was sustained for 4 to 12 hr. F1 with 10% TSP and F7 with Guar gum as retardant showed 98.62 % and 97.87% release within 5hr. whereas in formulation F5 with 30%TSP and F12 with 35% guar gum as a retardant showed 98.06% and 97.5% release upto12hr.
This is mainly due to increasing polymer concentration or increasing path length diffusion. By using the different concentrations of TSP and Guar gum as a release retardant, drug release from TSP and guar gum showed sustained for 4 to12 hr by varying the concentration of polymer matrix composition. Formulation F5 and F6 with TSP showed reasonable release 98.06% 94.12%. And formulation F10, F11, F12 with Guar gum showed reasonable release 98.50, 96.68, 97.5%, respectively. From the above results, it was found that the drug release is depleted as the concentration of TSP and Guar gum polymer was increased in polymeric matrix composition.
Hence, formulations F5 with TSP and F12 with Guar gum were found to be most promising formulations as they showed sustained release (98.06% and 97.5 %) as well as maintained excellent matrix integrity during the period of study (Table23,24). Also all other parameters like hardness, thickness, friability, drug content and weight variation for these formulations were within the range. So, formulations F5 and F12 were selected as the optimized formulations.
NOW YOU CAN ALSO PUBLISH YOUR ARTICLE ONLINE.
SUBMIT YOUR ARTICLE/PROJECT AT editor-in-chief@pharmatutor.org
Subscribe to Pharmatutor Alerts by Email
FIND OUT MORE ARTICLES AT OUR DATABASE

TIME(HOURS)
Figure9: In-vitro dissolution profile of F1 to F6 formulation
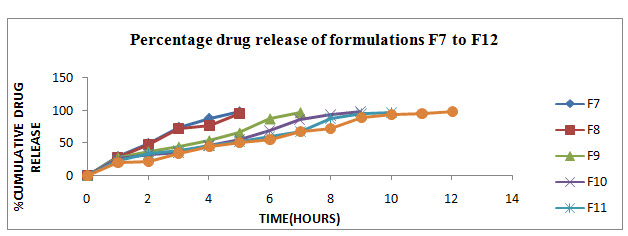
Figure10: In-vitro dissolution profile of F7 to F12 formulations
Table No:11 Model fitting for formulation F5
|
T(hr) |
% release |
Log%un-release |
Log t |
SQRT |
Log Cumulative release |
|
0 |
0 |
2 |
−− |
0 |
−− |
|
1 |
17.81 |
1.914 |
0 |
1 |
1.25 |
|
2 |
20.62 |
1.89 |
0.30 |
1.41 |
1.31 |
|
3 |
32.81 |
1.82 |
0.47 |
1.73 |
1.51 |
|
4 |
42.56 |
1.75 |
0.60 |
2 |
1.62 |
|
5 |
49.87 |
1.70 |
0.69 |
2.23 |
1.69 |
|
6 |
53.43 |
1.66 |
0.77 |
2.44 |
1.72 |
|
7 |
65.43 |
1.53 |
0.84 |
2.64 |
1.81 |
|
8 |
70.87 |
1.46 |
0.90 |
2.82 |
1.85 |
|
9 |
87.18 |
1.1 |
0.954 |
3 |
1.94 |
|
10 |
91.68 |
0.91 |
1 |
3.16 |
1.96 |
|
11 |
93.93 |
0.78 |
1.04 |
3.31 |
1.97 |
|
12 |
98.06 |
0.28 |
1.07 |
3.46 |
1.99 |
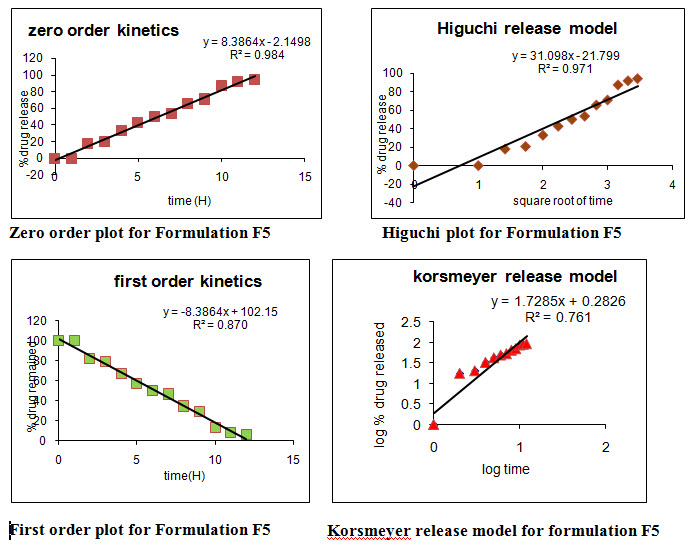
Table No:12 Model fitting for formulation F12
|
T(hr) |
%release |
Log%un- release |
Log t |
SQRT |
Log Cumulative release
|
|
0 |
0 |
2 |
−− |
0 |
−− |
|
1 |
19.68 |
1.904 |
0 |
1 |
1.29 |
|
2 |
21.75 |
1.89 |
0.30 |
1.41 |
1.33 |
|
3 |
34.12 |
1.81 |
0.47 |
1.73 |
1.53 |
|
4 |
43.68 |
1.75 |
0.60 |
2 |
1.64 |
|
5 |
50.81 |
1.69 |
0.69 |
2.23 |
1.70 |
|
6 |
54.75 |
1.65 |
0.77 |
2.44 |
1.73 |
|
7 |
66.56 |
1.52 |
0.84 |
2.64 |
1.82 |
|
8 |
72 |
1.44 |
0.90 |
2.82 |
1.85 |
|
9 |
88.5 |
1.06 |
0.95 |
3 |
1.94 |
|
10 |
92.62 |
0.86 |
1 |
3.16 |
1.96 |
|
11 |
95.06 |
0.69 |
1.04 |
3.31 |
1.97 |
|
12 |
97.5 |
0.39 |
1.07 |
3.46 |
1.98 |
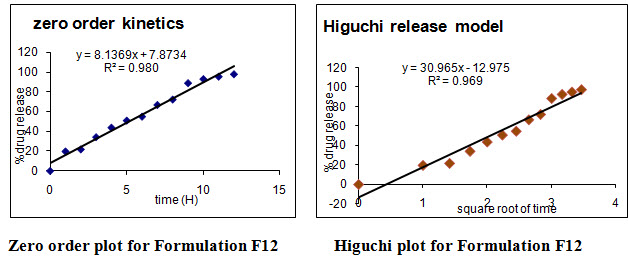
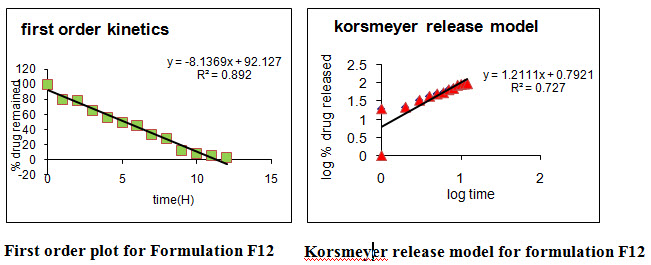
Table No:13 Release kinetics parameters of designed sustained release matrix tablets of Atomoxetine hcl
|
Formulation code |
Zero order kinetics |
First order kinetics |
Higuchi kinetics |
Korsmeyer /Pepas kinetics |
|
|
R2 |
N value |
||||
|
F1 |
0.988 |
0.735 |
0.952 |
0.982 |
0.807 |
|
F2 |
0.982 |
0.832 |
0.991 |
0.992 |
0.794 |
|
F3 |
0.979 |
0.821 |
0.947 |
0.936 |
0.729 |
|
F4 |
0.972 |
0.899 |
0.949 |
0.937 |
0.756 |
|
F5 |
0.984 |
0.870 |
0.971 |
0.974 |
0.761 |
|
F6 |
0.973 |
0.961 |
0.976 |
0.981 |
0.729 |
|
F7 |
0.972 |
0.898 |
0.967 |
0.991 |
0.774 |
|
F8 |
0.965 |
0.89 |
0.966 |
0.984 |
0.751 |
|
F9 |
0.953 |
0.831 |
0.921 |
0.951 |
0.797 |
|
F10 |
0.975 |
0.845 |
0.925 |
0.925 |
0.658 |
|
F11 |
0.973 |
0.819 |
0.937 |
0.964 |
0.651 |
|
F12 |
0.980 |
0.892 |
0.969 |
0.968 |
0.727 |
Different models like Zero order, First order, Higuchi’s, and Peppa’s plots were drawn. The regression coefficient (R2) value of Zero order, First order, Higuchi’s, and Peppa’s plots (Figure 15-22 and Table 27) for formulation F5 were found to be 0.984, 0.870, 0.971, 0.974 and F12 were 0.980, 0.892, 0.969, 0.968.The optimized formulations F5 and F12 (0.971 and 0.969) follows Higuchi’s plot since the regression coefficient is found to be linear, this confirms that the drug release through the matrix was diffusion and slope (n) value of optimized formulations F5 and F12 were found to be 0.761 and 0.727. Thus, non Fickian diffusion was the main mechanism. The regression coefficient (R2) values of zero order in the optimized formulation F5 and F12 were greater than the R2 values of first order. Thus, the drug release follows zero order kinetics.
NOW YOU CAN ALSO PUBLISH YOUR ARTICLE ONLINE.
SUBMIT YOUR ARTICLE/PROJECT AT editor-in-chief@pharmatutor.org
Subscribe to Pharmatutor Alerts by Email
FIND OUT MORE ARTICLES AT OUR DATABASE
5.3.7 STABILITY STUDIES:
Table No:14 Physical appearance of optimized formulations after stability studies:
|
Temperature and Relative humidity |
F4 and F12 |
Parameters |
||||||
|
Days |
||||||||
|
0 |
15 |
30 |
45 |
60 |
75 |
90 |
||
|
250C±20C/ 60% ± 5%RH |
No change in physical appearance |
|||||||
|
350C±20C/ 60% ± 5%RH |
||||||||
|
400C±20C/ 60% ± 5%RH |
||||||||
Table 15: Hardness of optimized formulations after stability studies
|
No. of days |
F4 |
F12 |
||||
|
Hardness(Kg/cm2)* |
Hardness (Kg/cm2)* |
|||||
|
250C/ 60%RH |
300C/ 65%RH |
400C/ 75%RH |
250C/ 60%RH |
300C/ 65%RH |
400C/ 75%RH |
|
|
0 |
5.9 |
6.0 |
5.9 |
6.5 |
6.4 |
6.5 |
|
15 |
6.0 |
5.9 |
5.8 |
6.4 |
6.5 |
6.5 |
|
30 |
5.9 |
5.9 |
5.9 |
6.5 |
6.6 |
6.6 |
|
45 |
5.8 |
6.0 |
6.0 |
6.6 |
6.6 |
6.4 |
|
60 |
5.9 |
6.0 |
5.8 |
6.4 |
6.5 |
6.4 |
|
75 |
6.0 |
5.9 |
6.0 |
6.5 |
6.5 |
6.5 |
|
90 |
5.9 |
5.8 |
5.9 |
6.5 |
6.4 |
6.5 |
Table No;16 Friability of optimized formulations after stability studies
|
No. of days |
F5 |
F12 |
||||
|
Friability (%) |
Friability (%) |
|||||
|
250C/ 60%RH |
300C/ 65%RH |
400C/ 75%RH |
250C/ 60%RH |
300C/ 65%RH |
400C/ 75%RH |
|
|
0 |
0.263 |
0.275 |
0.266 |
0.229 |
0.292 |
0.281 |
|
15 |
0.275 |
0.231 |
0.282 |
0.218 |
0.368 |
0.341 |
|
30 |
0.273 |
0.242 |
0.229 |
0.274 |
0.291 |
0.279 |
|
45 |
0.311 |
0.319 |
0.229 |
0.311 |
0.347 |
0.345 |
|
60 |
0.340 |
0.267 |
0.334 |
0.299 |
0.283 |
0.338 |
|
75 |
0.320 |
0.332 |
0.329 |
0.252 |
0.345 |
0.358 |
|
90 |
0.323 |
0.251 |
0.236 |
0.321 |
0.338 |
0.351 |
Table 17: Drug content of optimized formulations after stability studies
|
No. of days |
F5 |
F12 |
||||
|
Drug content (mg) |
Drug content (mg) |
|||||
|
250C/ 60%RH |
300C/ 65%RH |
400C/ 75%RH |
250C/ 60%RH |
300C/ 65%RH |
400C/ 75%RH |
|
|
0 |
99.10 |
99.15 |
99.18 |
99.26 |
98.31 |
99.22 |
|
15 |
99.15 |
99.20 |
98.13 |
98.20 |
99.24 |
98.18 |
|
30 |
99.22 |
99.17 |
99.20 |
99.16 |
98.17 |
98.14 |
|
45 |
99.18 |
99.15 |
98.18 |
98.21 |
99.19 |
99.26 |
|
60 |
99.11 |
98.10 |
99.08 |
99.15 |
98.16 |
98.20 |
|
75 |
99.08 |
99.12 |
98.02 |
98.08 |
99.09 |
99.01 |
|
90 |
99.10 |
99.08 |
98.91 |
99.10 |
99.00 |
98.55 |
Table 18: Percentage drug release from optimized formulations after stability Studies
|
No. of days |
F5 |
F12 |
||||
|
%Drug release |
%Drug release |
|||||
|
250C/ 60% RH |
300C/65% RH |
400C/75% RH |
250C/60% RH |
300C/65% RH |
400C/ 75% RH |
|
|
0 |
98.07 |
98.45 |
98.20 |
97.80 |
98.02 |
97.79 |
|
15 |
98.16 |
98.09 |
98.16 |
97.89 |
97.75 |
97.74 |
|
30 |
98.19 |
98.05 |
98.75 |
97.76 |
97.64 |
97.76 |
|
45 |
98.04 |
98.07 |
98.17 |
97.79 |
97.71 |
97.61 |
|
60 |
98.17 |
98.01 |
98.09 |
98.72 |
97.75 |
97.77 |
|
75 |
98.05 |
98.17 |
98.13 |
97.64 |
97.83 |
98.05 |
|
90 |
98.05 |
98.18 |
98.05 |
97.88 |
97.71 |
97.62 |
Stability studies were carried out on selected formulations (F5 and F12) as per ICH guidelines. There was not much variation in matrix integrity of the tablets at all the temperature conditions.
There was no significant changes in drug content, physical stability, hardness, friability and drug release (Table 28-32) for the selected formulations F5 and F12 after 60 days at 25oC ± 20C/60% ±5%RH, 300C ±20C/65%±5%RH and 400C±20/75%±5%RH. Therefore the main objective of the study to formulate and evaluate the matrix tablets of a atomoxetine hcl drug using TSP and Guar gum as a retardant were achieved.
NOW YOU CAN ALSO PUBLISH YOUR ARTICLE ONLINE.
SUBMIT YOUR ARTICLE/PROJECT AT editor-in-chief@pharmatutor.org
Subscribe to Pharmatutor Alerts by Email
FIND OUT MORE ARTICLES AT OUR DATABASE
CONCLUSION:
In this study matrix tablet of Atomoxetine hcl was prepared by direct compression, using TSP and Guar gum Polymers used as release retardant. It was found that increase in the concentration of TSP and Guar gum in polymeric ratio decreases the drug release. TSP is non-carcinogenic, biocompatible and has high drug holding capacity. These led to its application as excipient in hydrophilic drug delivery system. Guar gum swells in gastric fluid to produce a highly viscous layer around the tablet through which the drug must diffuse. This property makes Guar gum useful ingredient for sustained release matrix tablet. The formulation F5 and F12 containing 30% and 35% of TSP and guar gum respectively showed good drug release with good matrix integrity. From the above result, it has been found that the optimized formulation F5 containing 30% of TSP as drug retarding polymer shows better sustained effect for 12 hr when compared to F11 containing 30% of guar gum having sustained effect for 10 hr. Different parameters like hardness, friability, weight variation, drug content uniformity, in-vitro drug release were evaluated for these formulations. Based on these results, formulations F5 and F12 were found to be the most promising formulations. The optimized formulations F5 and F12 follows Higuch’s plot since the regression coefficient is 0.971 and 0.969 and plots were also found to be linear. This confirms that the drug release through the matrix was diffusion and slope (n) value of Peppa’s plot in the optimized formulations F5 and F12 were found to be 0.761 and 0.727. Thus, non Fickian diffusion was the main mechanism. The regression coefficient (R2) values of zero order in the optimized formulation F5 and F12 were greater than the R2 values of First order. Thus, the drug release follows zero order kinetics. Stability studies were conducted for the optimized formulations as per ICH guidelines for a period of 90 days, which revealed the stability of the formulations. The results suggest that the developed sustained release matrix tablets of Atomoxetine hcl could perform better than conventional dosage forms, leading to improve efficacy and better patient compliance.
REFERENCES:
1.Abdelbary GA, Tadros MI. Design and in vitro/in vivo evaluation of novel Nicorandil extended release matrix tablets based on hydrophilic interpolymer complexes and a hydrophobic waxy polymer. Eur J Pharm Biopharm 2008;69(3):1019-28.
2. Alderman DA. Swellable matrices as systems for oral Delivery. Int J Pharm and Prod Mfr 1984; vol: 1-5.
3. Ashutosh Kumar S, Vijay Kumar G, Karthikeyan.M, Manidipa S, Ravisankar V, Arenachalam A. Formulation and evaluation of sustained release tablets of metoprolol succinate, Int J Pharm Bio Arch 2010;1(5):416-420.
4. Barretta GU, Nazzi S, Zambito Y, Gd C, Balzano F, Sanso M. Synergistic interaction between ts-polysaccharide and hyaluronic acid: Implications in the formulation of eye drops. Int J Pharma 2010;395:122-31.
5.Carpenter LL, Milosavljevic N, Schecter JM, Tyrka AR, Price LH: Augmentation with open-label atomoxetine for partial or nonresponse to antidepressants. J Clin Psychiatry. 2005 Oct;66(10):1234-8. Pubmed.
6. Chein YW. Novel drug delivery systems. 3rd Ed. New York: Marcel Dekker; 2002, p.139-96.
7.Chien YW. Rate controlled drug delivery systems. 2nd Ed. New York: Marcel Dekker.2005.
8. CIMS Book No: 07 Oct 2006- Jan 2007, 246- 8.
9. Costa P. An alternative method to the evaluation of similarity factor in dissolution testing. Int J Pharm 2001; 220:77-83.
10Crowley MM et al. Physiochemical properties and mechanism of drug release from ethyl cellulose matrix tablets prepared by direct compression and hot-melt extrusion. Int J Pharm 2004; 269: 509-22.
11. Deveswaran R, Abrahum S, Basavaraj BV, Bharath S, Fartado S, Madhavan V. Design and characterization of diclofenac sodium tablets containing tamarind seed polysaccharide as release retardant. Int J Pharm Tech Res 2009;1(2):191-5.
12Emami J, Tavakoli N, Movahedian A. Formulation of sustained-release lithium carbonate matrix tablets: influence of hydrophilic materials on the release rate and in vitro-in vivo evaluation. J Pharm Pharmaceut Sci 2004;7(3):338-44.
13. Erukulla. Durga Prasad, S. Indira M. Kranthi Kumar and M. Divya. Formulation and evaluation of buccoadhesive bilayered tablets of Atomoxetine hcl. Available at www.ijrpc.com (IJRPC 2012, 2(3), ISSN 2231-2781).
14.Gennaro AR (Ed.) Remington. The Science and Practice of Pharmacy, vol.II, 20th ed. New Delhi: Elsevier; 2000: p.903-07.
15.Ghosh S, Barik BB. Preparation and evaluation of Diclofenac sustained release formulation and comparison of formulated and marketed product. Int J Medicine Medical Science 2009;1(9):375-82.
16.Gilbert S, Banker C, Rhodes T. Modern Pharmaceutics. Vol. 121, 4th Ed. New York: Marcel Dekker Inc; 2008. p. 503-7.
17. Gomez AD. Role of water-uptake on tablet disintegration: design of improved method for penetration measurements, Acta Helv 1986;61(1):22-9.
18. Gul MK. Controlled release oral dosage forms: Some recent advances in matrix type drug delivery systems. The Sciences 2001;1(5):350-4.
19Hajare AA, More HN, D‟Souza JI. Design and evaluation of sustained release tablets of diltiazem hydrochloride. Indian Drugs 2004;41(3):175-6.
20. Harborne JB. Phytochemical Methods: A guide to modern techniques of plant analysis. 3rd Ed. New Delhi: Springer (India) Pvt Ltd; 2007. p. 278-80.
21. Higuchi T. Mechanism of sustained action medication. Theoretical analysis of rate of release of solid drugs dispersed in solid matrices. J Pharm Sciences 1963; 52:1145-9.
22. Huda.I.G et al., has formulated the taste masked chewable dispersible tablets of atomoxetine hcl with eudragit EPO with a drug: avecil 101.The prepared batches of evaluation for hardness, friability, drug content uniformity and invitro dispersion time. 2012 ,2(2):110-5.
23.http://www.mhra.gov.uk/home/groups/lunit1/documents/websiteresources/con2023359. pdf.
24http://www.pharmainfo.net/reviews/tamarind-seed-polysaccharides-novel-carrier- drug-delivery-systems.
25. ICH Q1A (R2) stability testing guidelines: stability testing of new drug substances and products. [Online]. 2003 [cited 2008 Nov10]; Available from:
26.URL:http://www.tga.health.gov.au/docs/pdf/euguide/inch/273699r2en.pdf.
26. Indian Pharmacopoeia, volume 1. Ministry of Health and Family Welfare. New Delhi: Controller of Publications; 2007; p. 477-8.
NOW YOU CAN ALSO PUBLISH YOUR ARTICLE ONLINE.
SUBMIT YOUR ARTICLE/PROJECT AT editor-in-chief@pharmatutor.org
Subscribe to Pharmatutor Alerts by Email
FIND OUT MORE ARTICLES AT OUR DATABASE


