{ DOWNLOAD AS PDF }
About Authors:
Dharmesh R. Mevada*, Krutika Bhalodiya, Brijesh Maniar, Ketan Dadhania, Shital Faldu
Department of Quality Assurance,
Smt. R. D. Gardi B. Pharmacy College,
Rajkot, Gujarat, India
*dharmeshmevada89@gmail.com
Abstract
UV Spectrophotometric method has been developed for simultaneous estimation of Bromhexine HCl (BHX) and Phenylephrine HCl (PLE) in bulk drug and in their combined Pharmaceutical dosage form by first order derivative. This method utilizes methanol as a common solvent and λmax of BHX and PLE selected for analysis was found to be at 241 nm (at ZCP of PLE) and 233 nm (at ZCP of BHX) respectively. Linearity was observed in the concentration range of 5-30 μg/ml for BHX (r2 = 0.999) and 10-60 μg/ml for PLE (r2 = 0.998). The accuracy and precision were determined and found to comply with ICH guidelines. This method showes good reproducibility and recovery with % RSD in the desired range. Developed method was applied for marketed formulation. The results were found to be within acceptance criteria according to ICH guideline. This method was simple, rapid, accurate, Precise and sensitive.
INTRODUCTION [1-4]
Bromhexine Hydrochloride (BHX) (fig. 1a) [1] is the hydrochloride salt of bromhexine, chemically known as,2,4-dibromo-6 {[cyclohexyl(methyl) amino]methyl}aniline [1]. It act as Mucolytic. It is used in the treatment of respiratory disorder associated with productive cough & abnormal mucus secretion[3]. Phenylephrine HCl (PLE) ( fig.1b)[1] is Sympathomimetics class drug used in the treatment of Nasal decongestant, Vasoconstrictor Agents, Mydriatics & Cardiotonic Agents [3].but here it’s used as Nasal decongestant.It’s chemically known as 3-[(1R)-1hydroxy-2-(methylamino)ethyl phenol.[1]
BHX is official in IP & BP [6,,8] and PLE is official in IP,BP,& USP.[6,7,8] The chemical structures of BHX & PLE are shown in Fig. 1.Combination drug products of BHX and PLE are widely marketed under brand name (solvin) [9] and used in the treatment of cold & cough specially during some allergic condition. Several analytical methods reported such as UV Spectrophotometry, HPLC, HPTLC & Stability study for the estimation of BHX And PLE Individually and it’s combination with other drug [16-19].But still no one any analytical method developed for the simultaneous estimation of these two drug. So, the present paper describes the Spectrophotometric method development and validation for the simultaneous estimation of BHX & PLE by first order derivative spectrophotometric method in tablet dosage form. The proposed methods are optimized and validated as per the ICH guidelines.
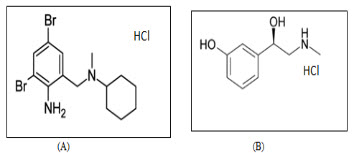
Fig. 1 Chemical structures of the analytes (A) Bromhexine HCl (B) Phenylephrine HCl
MATERIALS AND METHODS [10-14]
Instrumentation
Double beam UV-visible spectrophotometer (heλios Alpha, Model - V 7.09) having two matched quartz cells with 1 cm light path. An Electronic analytical balance (Contech, CA34 Model) was used in the study.
Material and reagent
Double distilled water and Whatmann filter paper (0.45μm) were used for filtration. Active pharmaceutical ingredient (API) Bromhexine HCl , Phenylephrine HCl were obtained as gift sample from Espee formulation Pvt. Ltd, Rajkot and Manish Pharma Lab, Viramgam respectively. And test samples (tablets with composition BHX-8 mg and PLE-10 mg (brand name : solvin) were procured from the local market.
Preparation of Standard Stock solution of BHX and PLE:
Accurately weighed quantity 100 mg of BHX and PLE were transferred into separate 100 ml volumetric flask, dissolved and diluted up to mark with methanol (100 ml). This will give a stock solution having strength of 1000 μg/ml of each.
Preparation of Working Standard Solution of BHX and PLE:
100 µg/ml of BHX and PLE solution were prepared by diluting 10 ml of stock solution to 100 ml with methanol in separate 100 ml volumetric flask. Suitable aliquots of this solution were diluted up to the mark with methanol to get the concentration range of 5,10,15,20,25, & 30 μg/ml for BHX and 10,20,30,40,50,& 60 μg/ml for PLE.
Selection of analytical wavelength:
5-30 µg/ml solutions of BHX and 10-60 µg/ml solutions of PLE were prepared in methanol by appropriate dilution of working standard solution and spectrum was recorded between 200-400 nm and all zero order spectrums (D0) were converted to first derivative spectrum (D1) using delta lambda 1.0 and scaling factor 5.0. The overlain first derivative spectrums of BHX and PLE at different concentration were recorded. The zero crossing point (ZCP) of BHX was found to be at 233 nm (Figure 2) and ZCP of PLE was found to be at 241 nm (Figure 3).
Preparation of calibration curve:
Standard solutions of BHX in the concentration range of 5 to 30 μg/ml obtained by transferring (0.5, 1.0, 1.5, 2, 2.5, & 3 ml) of BHX working standard solution (100 μg/ml) to the series of 10 ml volumetric flasks and standard solutions of PLE in the concentration range of 10 to 60 μg/ml were obtained by transferring (1, 2, 3, 4, 5, & 6 ml) of PLE working standard solution (100 μg/ml) to the series of 10 ml volumetric flasks. Then volume was adjusted up-to mark with methanol. All dilutions were scanned in wavelength range of 200 nm to 400 nm. All zero order spectrums (D0) were converted to first derivative spectrum (D1). The absorbance was plotted against the respective concentrations to obtain the calibration curves.
Validation of proposed method [15]
Parameters to be considered for the validation of method are:
Validation of the developed method was carried out as per ICH guideline.Parameters such as Linearity and range, Accuracy, Precision, LOD and LOQ were taken up as tests for analytical method validation.
Linearity and Range:
Appropriate volume of aliquot from BHX and PLE working standard solution was transferred to volumetric flask of 10 ml capacity. The volume was adjusted to the mark with methanolto give a solutions containing 5-30 µg/ml BHX and 10-60 µg/ml PLE. All D1 Spectrum were recorded using above spectrophotometric condition. D1 absorbance at 241 nm and 233 nm were recorded for BHX and PLE, respectively (n=3). Calibration curves were constructed by plotting average absorbance versus concentrations for both drugs. Straight line equations were obtained from these calibration curves.
Precision
Precision of the method was determined in the terms of Repeatability, Intraday and Interday precision. Repeatability (% RSD) was assessed by analyzing test drug solution within the calibration range, six times on the same day. Intraday variation (% RSD) was determined by analysis of this solution three times on the same day. Interday precision (%RSD) was determined by analysis of this solution on three different days.
Limit of detection (LOD) and limit of quantitation (LOQ)
LOD = 3.3 * SD
-----------
Slope
LOQ = 10 * SD
----------
Slope
Where,
S.D. = Standard deviation of the Y- intercepts of the 3 calibration curves
Slope = Mean slope of the 3 calibration curves
Recovery Studies:
Recovery studies were done so as to check the accuracy of the method. Known amounts of standard solutions of BHX and PLE were added to pre-quantify dosage form solution of BHX and PLE and D1absorbance were determined at 241 nm and 233 nm respectively. Concentration of the drug in the mixture was calculated using the regression equations. The analysis was done in a set of 3 replicates.The amount of BHX and PLE was calculated at each level (80%, 100%, 120%) and % recoveries were computed.
Application of Proposed Method to Marketed formulation:
First Order Derivative Spectrophotometry[12]
The powder of twenty tablets were weighed. An accurately weighed quantity of the powder equivalent to about 8 mg of BHX and 10 mg PLE of was taken in 100 ml volumetric flask and dissolved with methanol and further diluted upto the mark with same solvent. The solution was then filtered through the Whatmann filter paper No. 41. Necessary dilutions are made with methanol to give final concentration 8 µg/ml and 10 µg/ml of BHX and PLE respectively. The solutions are then scanned between 200-400nm and absorbances are measured at respective wavelengths. The concentration of each drug was calculated using equation of straight line.
RESULTS AND DISCUSSION
Zero cross point (ZCP):
ZCP of BHX and PLE were detected at 233 nm and 241 nm, respectively and overlain D1spectra were recorded (figure 4).Regression characteristics for BHX and PLE are shown in Table 4.
Method Validation:
The linearity range for BHX and PLE were 5-30 μg/mL and 10-60 μg/mL respectively. Recovery studies was carried out by addition of standard drug solution to pre-analyzed dosage form solution at four different concentration levels (0%, 80%, 100% and 120%) taking into consideration percentage purity of added bulk drug sample. The results of the recovery studies are found to be satisfactory for BHX and PLE and shown in Table 1 and 2 respectively.The result of assay procedure obtained was showed in Table 3. Summary of Other validation parameters including Repeatability, Intraday, Interday, LOD and LOQ were found to be satisfactory and are shown in Table 5.
CONCLUSION
The results obtained by applying the suggested procedures, it is proved that the proposed method is accurate, precise, simple, sensitive, selective and rapid and can be applied successfully in routine analysis for the estimation of BHXand PLEin their combined pharmaceutical dosage form. The developed method was validated as par ICH guidelines.
FIGURES AND TABLES
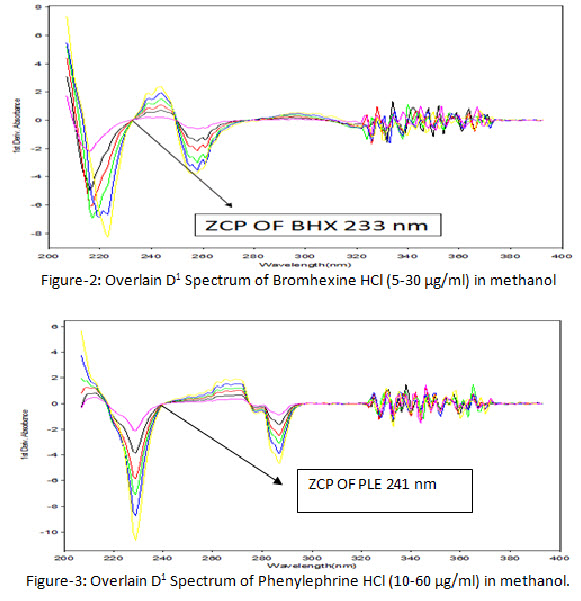
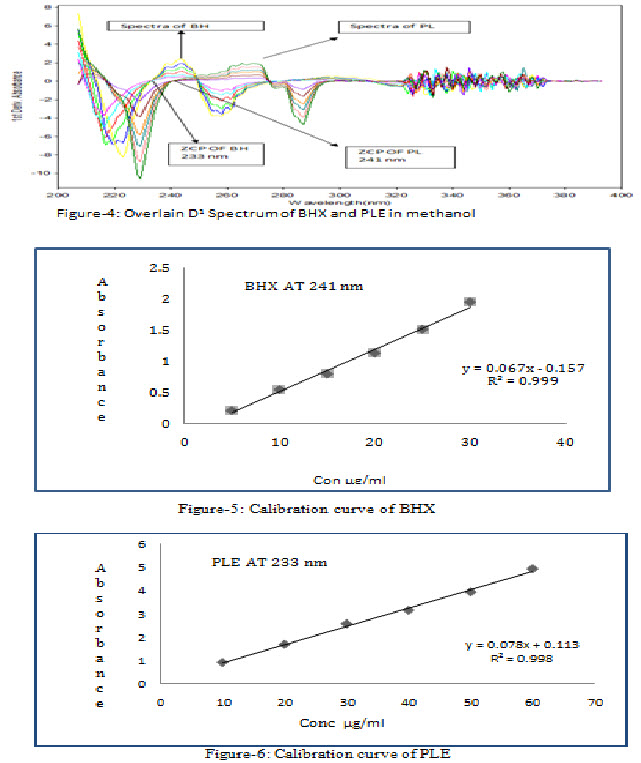
Table-1 Accuracy data of BHX in dosage form:
|
Amount of BHX in Sample (µg/ml) |
Amount of std. BHX Added (µg/ml) |
Total Amount of BHX (µg/ml) |
Mean Total Amount of BHX recovered (μg/ml) Mean ± S.D.* |
% Recovery |
% R.S.D. |
|
10 |
0 |
10 |
10.17 ± 0.0057 |
101.7 |
0.0567 |
|
10 |
8 |
18 |
18.27± 0.0251 |
101.5 |
0.1376 |
|
10 |
10 |
20 |
19.62± 0.0152 |
98.1 |
0.1279 |
|
10 |
12 |
22 |
23.43± 0.02 |
101.81 |
0.0677 |
[*=mean value of 3 determination]
Table-2 Accuracy data of PLE in dosage form:
|
Amount of PLE in Sample (µg/ml) |
Amount of std. PLE Added (µg/ml) |
Total Amount of PLE (µg/ml) |
Mean Total Amount of PLE recovered (μg/ml) Mean ± S.D.* |
% Recovery |
% R.S.D. |
|
20 |
0 |
20 |
20.35 ± 0.0305 |
101.75 |
0.1501 |
|
20 |
16 |
36 |
35.84± 0.0360 |
99.55 |
0.1006 |
|
20 |
20 |
40 |
39.42± 0.0251 |
98.55 |
0.0638 |
|
20 |
24 |
44 |
44.49± 0.0208 |
101.11 |
0.0467 |
[*=mean value of 3 determination]
Table-3: Analysis of BHX and PLE in dosage form:
|
Tablet dosage form |
Label claim (mg) |
% Recovery ± SD (% of label claim*) |
||
|
BHX |
PLE |
BHX |
PLE |
|
|
Solvin |
8 mg |
10 mg |
100.25 ± 1.9423 |
100.17 ± 1.6590 |
[*=mean value of 3 determination]
Table-4: Regression Characteristics:
|
Characteristics |
Bromhexine HCl (at ZCP= 241 nm) |
Phenylephrine HCl (at ZCP=233 nm) |
|
Range (μg/ml) |
5-35 |
10-100 |
|
Linearity (μg/ml) |
5-30 |
10-60 |
|
Molar Absorptivity (lit. mol-1 cm-1) |
2417.76 |
1695.19 |
|
Sandell’s sensitivity (μg/cm2/0.001 abs unit) |
0.1556 |
0.1204 |
|
Regression Equation |
y = 0.067x - 0.157 |
y = 0.078x + 0.113 |
|
Slope |
0.067 |
0.078 |
|
r2 |
0.999 |
0.998 |
|
Intercept |
0.157 |
0.113 |
|
S.D. of Intercept |
0.000816 |
0.002449 |
TABLE-5: VALIDATION PARAMETERS:
|
PARAMETERS |
Bromhexine HCl (at ZCP of PLE=241 nm) |
Phenylephrine HCl (at ZCP of BHX=233 nm) |
|
Linearity range (μg/ml) |
5-30 |
10-60 |
|
Precision (% RSD) |
||
|
Repeatability (%RSD)(n=6) |
0.1014 |
0.02932 |
|
Intra-day (n=3) |
0.1213-0.4478 |
0.096-0.161 |
|
Inter-day (n=3) |
1.0346-1.9517 |
0.4901-0.5506 |
|
LOD (μg/ml) |
0.0015 |
0.002 |
|
LOQ (μg/ml) |
0.2330 |
0.2858 |
|
Accuracy (% recovery) |
99.50-100.89 |
99.37-101.01 |
LOD: Limit of Detection, LOQ: Limit of Quantitation, R.S.D.: Relative standard deviation, S.D.: Standard deviation
ACKNOWLEDGEMENT
The authors are thankful to Smt. R. D. Gardi B. Pharmacy College, Nyara, Rajkot, Gujarat, India for providing necessary facilities to carry out this work. We are also thankful to Espee formulation Pvt. Ltd, Rajkot and Manish Pharma Lab, Viramgamfor providing the free gift samples of BHX and PLE which was required for our research work.
REFERENCES
1.The Merck Index, An Encyclopedia of Chemicals, Drugs, and Biologicals, Merck & Co, Inc, Whitehouse Station, NJ: 2006. pp 233,1307.
2.Sweetman SC. Martindale: The complete drug reference, pharmaceutical press, 33rd edn, London: The pharmaceutical press, pp 1115,1126.
3.Rang HP, Dale MM, and Ritter JM, Pharmacology, 6 th Edn, , New York: Churchill Livingstone 2007. pp 294-315.
4.Tripathi KD, Essential of Medical Pharmacology, 6th Edn, New Delhi: Jaypee Brothers Medical Publishers (P) Ltd, 2008. pp 120-125, 213-214.
5.Dr.Vikas Seth,Clasification of Drugs with Drug Choice,3rd Edn, New Delhi: Aditya Medical Publishers, 2010. pp 41,99.
6.Indian Phamacopoeia, Volume-I & Volume-II, Government of India, Ministry of Health and Family Welfare, Published by The Indian Pharmacopoeia Commission, Ghaziabad. 2010, pp 921,1899.
7.The United States Pharmacopoeia-30, NF-25, Asian edition, Rockville, MD: The US Pharmacopoeial Convention, Inc. 2004, pp 1471.
8.British Pharmacopoeia, Volume I-II, London: The Department of Health,: HMSO Publication; 2009, pp 770, 4683.
9.For marketed preparation:
medlineindia.net/drugprice/index.asp
medguideindia.net/druginformation/BromhexineHCl,Phenylephrin HCl
10.Chatwal GR, Anands, Ultraviolet-Spectroscopy, Instrumental Methods of Chemical Analysis, Mumbai: Himalaya Publishing House, 2000. pp 180-198.
11.Sharma S, Sher P, Badve S, Atmaram PP. Recent advances in Spectroscopic technique, 6th Edn, AAPS Pharm Sci Tech 2005. E 618-E 625.
12.Backett AH, and Stenlake JB, Practical Pharmaceutical Chemistry, First Edition, Reprint, New Delhi: CBS Publishers and Distributors, 2004. pp 275 – 325.
13.Skoog DA, Heller TJ, Nieman TA, Principal of Instrumental Analysis, Saunder college publishing, NewYork, 2007, pp 834-845.
14.Mendham J, Denny JD, Barner & Thomas MJK, Vogel’s Text book of Quantitative Chemical Analysis, 6th Edn, , India: Dorling Kindersley, 2007. pp 717-756.
15.International Conference on Harmonization of Technical Requirments for Registration of Pharmaceutical for Human use. Validation of analytical proceure: Text book and Methodology ICH Q2 (R1) 2005.
16.Panda SK and Sharma AK,“Simultaneous Spectrophotometric estimation of Phenylpropanolamine Hcl,Bromhexine Hcl,And Chlorpheniramine Maleate.” International Journal of Pharmaceutical science, 1999, 61(2), 61-64.
17.Dhoka MG, Gawade VD and Joshi PV, “Spectrophotometric Method For Simultaneous Determination Of Amoxicillin trihydrate And Bromhexine hydrochloride in oral Dosage Form.” International Journal of Pharmacy and Pharmaceutical Science, 2010, 2(3): 129-134.
18.Ivana SV, Goran NI and Vladimir BC, “Development and Validation Of Spectrophotometric method for Phenylephrine hcl estimation in nasal drop formulations.” Macedonian Journal of Chemistry and chemical engineering, 2008, 27(2): 129-133.
19.Tantishaiyakul V, Poeaknapo C, Sribun P, Sirisuppanon K .” Simultaneous determination of dextromethorphan HBr and bromhexine HCl in tablets by first-derivative spectrophotometry.” Journal of pharmaceutical and biomedical analysis, 1998, 3(8): 237-243.
REFERENCE ID: PHARMATUTOR-ART-2180
|
PharmaTutor (ISSN: 2347 - 7881) Volume 2, Issue 6 Received On: 06/04/2014; Accepted On: 13/04/2014; Published On: 01/06/2014 How to cite this article: DR Mevada, K Bhalodiya, B Maniar, K Dadhania, S Faldu; Development and Validation of First Order Derivative Spectrophotometric Method for Simultaneous Estimation of Bromhexine Hydrochloride and Phenylephrine Hydrochloride in their Combined Pharmaceutical Dosage Form; PharmaTutor; 2014; 2(6); 132-138 |
NOW YOU CAN ALSO PUBLISH YOUR ARTICLE ONLINE.
SUBMIT YOUR ARTICLE/PROJECT AT articles@pharmatutor.org
Subscribe to Pharmatutor Alerts by Email
FIND OUT MORE ARTICLES AT OUR DATABASE