

 About Author: Khuntia Bhabani S., M.Pharm., B.P.U.T.,
Department of Pharmaceutical Analysis and Quality assurance,
Royal College of Pharmacy and Health Sciences,
Berhampur, Odisha, India
Reference ID: PHARMATUTOR-ART-1056
Abstract
The present study includes a simple, sensitive and specific UV method development and validation for the quantitation of Drotaverine in bulk and pharmaceutical dosage form. The λmax was found to be 357nm by taking acetonitrile and water (50:50) as solvent. The validation of the proposed method was carried out as per ICH Guidelines. It was found that the drug was shown the linearity between the range 5-90µg/ml. The regression of the curve was y = 0.022x - 0.033. The developed method was found to be with %RSD 0.548499 for Drotaverine. The %RSD for intra-day and inter-day precision was lower than 2%. The percentage recovery values of pure drug from the reanalyzed solution of formulation were in between 95.68-99.5%. The ruggedness of the method was studied by taking in account of different analyst and by varying the temperature. Based on the performance characteristic the proposed UV method was found to suitable for the estimation of Drotaverine in bulk and pharmaceutical dosage form.
[adsense:336x280:8701650588]
Introduction
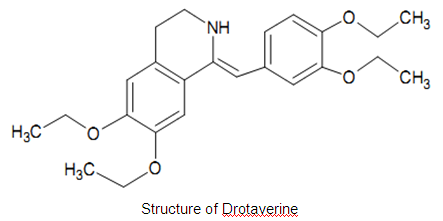
Drotaverine is an antispasmodic drug, structurally related to papaverine. Drotaverine is a selective inhibitor of phosphodiesterase 4, and has no anticholinergic effects. It has been shown to possess dose-dependent analgesic effects in animal models. It is 1-[(3,4-diethoxyphenyl)-methylene]-6,7-diethoxy-1,2,3,4-tetrahydroisoquinoline with molecular formula C24H31NO4 presented in. It inhibits phosphodiesterases hydrolysing cAMP, thereby increasing cAMP concentration, decreasing Ca uptake of the cells and changing the distribution of calcium among the cells. An ideal stability indicating method is one that quantifies the drug and also resolves its degradation products.
Drotaverine is freely soluble in water, methanol, ethanol, acetonitrile, chloroform and slightly soluble in HCl, NaOH. The λmax was found to be at 357nm.
Literature review for Drotaverine analysis revealed several methods based on different technique such as HPLC with UV detection. Visible spectrophotometric methods, LC-ms and HPLC ESI/MS assay for its quantification in plasma and serum, Chiral Chromatography, Pulse Polarography, Chemiluminescence assay, LC with coulometric Detection. However there is no method reported for the detection of Drotaverine in bulk and pharmaceutical formulation by UV spectrophotometry with such parameters.
The aim of present work is to find out a simple, sensitive, specific, spectrophotometric method developed for the detection of Drotaverine in bulk drug and pharmaceutical formulation.
Methods and Material: Simple UV Spectrophotometric Method is used. Drotaverine working standard was supplied by Khandelwal Remedies, Mumbai. Drotin-DS (Label claim: 80mg tablet) was manufactured by Martin & Harris Lab, Roorkee. All other chemicals used in the analysis were AR grade. A double – beam spectrophotometer (Shimadzu-1700) was used for the detection of absorbance, Electronic Balance (Sigma 200/A Super) and Sonicator (PCi-3.5L) were used for experimental purpose.
Subjects and Methods:
Preparation of Stock Solutions:
Standard stock solution was prepared by dissolving 100 mg of the drug in 100 ml of acetonitrile and water (50:50) to get concentration of 1mg/ml (1000 μg/ml) solutions.
Preparation of working solutions:
From the above stock solution 1ml of each were taken in a 10 ml volumetric flask and the volumes were made up to mark with the solvent to get concentration 0f 100μg/ml solutions. From this 1ml, 2ml, 3ml so on were transferred into 10ml volumetric flasks and volume was made up to the mark with acetonitrile and water (50:50) to make 10µg/ml, 20µg/ml, 30µg/ml respectively. Then the samples were scanned with UV-VIS Spectrophotometer against acetonitrile and water (50:50) as blank and the wavelength corresponding to maximum absorbance was noted which is its λmax.
Preparation of Calibration Curve:
Different concentrations form 5-100µg/ml were prepared form the stock solution in different volumetric flasks. Then the absorbances were noted by scanning in UV. Then a calibration curve was plotted taking concentration on X-axis and absorbance on Y-axis.
Validation
Validation can be defined as (ICH) “Establishing documented evidence, which provides a high degree of assurance that a specific activity will consistently produce a desired result or product meeting its predetermined specifications and quality characteristics”.
Method validation is an integral part of the method development; it is the process of demonstrating that analytical procedures are suitable for their intended use and that they support the identity, quality, purity, and potency of the drug substances and drug products. Simply, method validation is the process of proving that an analytical method is acceptable for its intended purpose.
The validation for UV method development was performed using parameters like Linearity, Accuracy, Precision, Robustness, Ruggedness, Limit of detection (LOD), Limit of quantitation (LOQ).
Results:
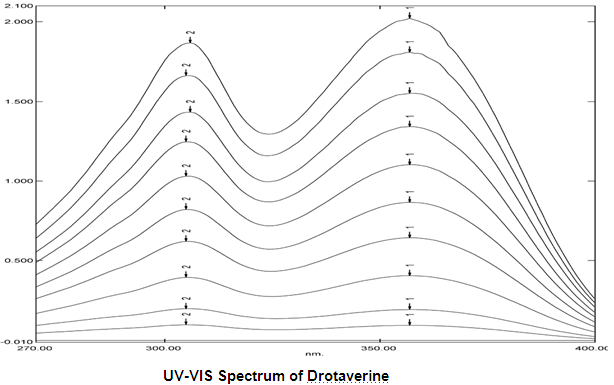
Determination of Working Wave Length (λmax):
In order to ascertain the wavelength of maximum absorption (λ max) of the drug, different solutions of the drugs (5μg/ml and 10μg/ml) in acetonitrile and water (50:50) was scanned using UV-VIS spectrophotometer within the wavelength region of 200 – 400 nm against acetonitrile and water (50:50) as blank. The resulting spectra are shown in figure below and the absorption curve shows characteristic absorption maxima at 357nm for Drotaverine.
Preparation of Calibration Curve:
For preparation of calibration curve of Drotaverine, a stock solution of 1000µg/ml was prepared. From it different concentrations ranging from 5 – 100 µg/ml was prepared. Then the samples were scanned through UV-VIS Spectrophotometer and their absorbances were noted, which were given in the table below.
A calibration curve was plotted using those readings taking Concentration on X-axis and Absorbance on Y-axis.
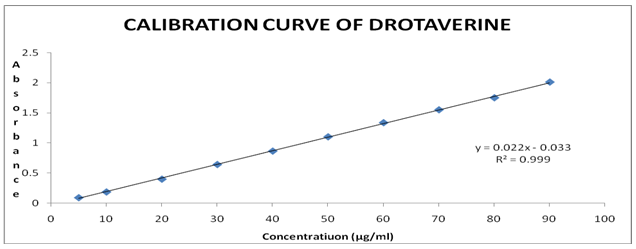
Calibration Curve of Drotaverine:
From the calibration curve it was found that it shows linearity in the range of 5– 90µg/ml with regression 0.999.
METHOD VALIDATION
Linearity:
Various aliquots were prepared form the stock solution (1000µg/ml) ranging 5-100µg/ml. The samples were scanned in UV-VIS Spectrophotometer against acetonitrile and water (50:50) as blank. It was found that the selected drug shows linearity between the ranges of 5-100µg/ml. The results are tabulated below.
Linearity Table of Drotaverine in Working Standard
|
Concentration (µg/ml) |
Absorbance |
|
5 |
0.094 |
|
10 |
0.189 |
|
20 |
0.401 |
|
30 |
0.644 |
|
40 |
0.866 |
|
50 |
1.103 |
|
60 |
1.337 |
|
70 |
1.551 |
|
80 |
1.75 |
|
90 |
2.01 |
|
Beer’s Law limit (µg/mL) |
5-90 µg/ml |
|
Sandell’s sensitivity (µg/cm3 / 0.001absorbance unit) |
0.047458016 |
|
Molar extinction coefficient (1 mole-1 c.m-1) |
2.11575x10⁻² |
|
% Relative standard deviation |
0.548499 |
|
Correlation coefficient |
0.999 |
|
Regression equation (Y*) |
y=0.022x-0.033 |
|
Slope (a) |
0.022 |
|
Intercept (b) |
0.033 |
Solutions in triplicate were prepared at levels 80%, 100% and 120% oftest concentration using Drotaverine working standard as per the test method and absorbance of each solutions were taken. The recovery result showed that the proposed method has an acceptable level of accuracy for Drotaverine which is between 95.68% and 99.5% for the test concentrations ranging from 80% to 120%.
Accuracy Reading For Drotaverine
|
Sample ID |
Concentration(µg/ml) |
% Recovery of Pure Drug |
Statistical Analysis |
||
|
Pure Drug |
Formulation |
||||
|
S1 : 80% |
24 |
30 |
99.09 |
MEAN |
99.1 |
|
S2 : 80% |
24 |
30 |
99.5 |
SD |
0.395095 |
|
S2 : 80% |
24 |
30 |
98.71 |
%RSD |
0.398683 |
|
S4 : 100% |
30 |
30 |
98.97 |
MEAN |
98.60333 |
|
S5 : 100% |
30 |
30 |
97.63 |
SD |
0.85143 |
|
S6 : 100% |
30 |
30 |
99.21 |
%RSD |
0.86349 |
|
S7 : 120% |
36 |
30 |
98.37 |
MEAN |
97.29333 |
|
S8 : 120% |
36 |
30 |
95.68 |
SD |
1.423037 |
|
S9 : 120% |
36 |
30 |
97.83 |
%RSD |
1.462625 |
The precision of the proposed method was ascertained by actual determination of eight replicates of fixed concentration of 10µg/ml of the drug within the Beer’s range and finding out the absorbance by the proposed method.
From the absorbance results mean, Standard Deviation and % RSD were calculated and these are within the limit. The results are tabulated below.
|
Sl. No. |
Concentration(µg/ml) |
Absorbance |
Statistical Analysis |
|
1 |
10 |
0.193 |
Mean=0.193375 SD=0.001061 %RSD=0.548499 |
|
2 |
10 |
0.193 |
|
|
3 |
10 |
0.193 |
|
|
4 |
10 |
0.195 |
|
|
5 |
10 |
0.192 |
|
|
6 |
10 |
0.195 |
|
|
7 |
10 |
0.193 |
|
|
8 |
10 |
0.193 |
|
Concentrations (mg/ml) |
Absorbance 1 |
Absorbance 2 |
Absorbance 3 |
Average %RSD |
|
30 |
0.644 |
0.644 |
0.645 |
0.124341415 |
|
30 |
0.644 |
0.643 |
0.645 |
|
|
30 |
0.645 |
0.644 |
0.644 |
|
|
30 |
0.645 |
0.644 |
0.643 |
|
|
30 |
0.642 |
0.644 |
0.644 |
|
|
30 |
0.644 |
0.644 |
0.644 |
|
|
30 |
0.644 |
0.644 |
0.643 |
|
|
30 |
0.643 |
0.646 |
0.643 |
|
|
30 |
0.644 |
0.644 |
0.644 |
|
|
30 |
0.644 |
0.645 |
0.644 |
|
|
%RSD |
0.13598308 |
0.1224481 |
0.1145930 |
Interday Precision Study for Drotaverine
|
Sl. No. |
Concentration(µg/ml) |
Day 1 |
Day 2 |
Day 3 |
Average %RSD |
|
1 |
40 |
0.866 |
0.866 |
0.867 |
0.109487 |
|
2 |
40 |
0.866 |
0.865 |
0.867 |
|
|
3 |
40 |
0.866 |
0.866 |
0.869 |
|
|
4 |
40 |
0.867 |
0.865 |
0.866 |
|
|
5 |
40 |
0.866 |
0.866 |
0.869 |
|
|
6 |
40 |
0.867 |
0.866 |
0.866 |
|
|
7 |
40 |
0.868 |
0.866 |
0.866 |
|
|
8 |
40 |
0.869 |
0.866 |
0.867 |
|
|
9 |
40 |
0.866 |
0.867 |
0.866 |
|
|
10 |
40 |
0.866 |
0.865 |
0.867 |
|
|
%RSD |
0.122228 |
0.073049 |
0.133183 |
||
For the ruggedness testing parameters selected were different analysts and different temperature.
|
Analyst-1 |
|
Analyst-2 |
||||
|
Conc. (µg/ml) |
Abs. |
Statistical Analysis |
Conc. (µg/ml) |
Abs. |
Statistical Analysis |
|
|
40 |
0.866 |
Mean = 0.865667
SD = 0.000516
%RSD = 0.059653 |
40 |
0.866 |
Mean = 0.866167
SD = 0.000408
%RSD = 0.047133 |
|
|
40 |
0.866 |
40 |
0.866 |
|||
|
40 |
0.865 |
40 |
0.866 |
|||
|
40 |
0.865 |
40 |
0.866 |
|||
|
40 |
0.866 |
40 |
0.867 |
|||
|
40 |
0.866 |
40 |
0.866 |
|||
|
Room Temperature |
Temp. 18oC |
|||||
|
Conc. (µg/ml) |
Abs. |
Statistical Analysis |
Conc. (µg/ml) |
Abs. |
Statistical Analysis |
|
|
40 |
0.866 |
Mean = 0.866
SD = 0.000632
%RSD = 0.073032 |
40 |
0.867 |
Mean = 0.866833
SD = 0.000983
%RSD = 0.113423 |
|
|
40 |
0.865 |
40 |
0.866 |
|||
|
40 |
0.867 |
40 |
0.866 |
|||
|
40 |
0.866 |
40 |
0.868 |
|||
|
40 |
0.866 |
40 |
0.866 |
|||
|
40 |
0.866 |
40 |
0.868 |
|||
The LOD for Drotaverine was found to be 0.25µg/ml.
The LOQ for Drotaverine was found to be 0.54µg/ml.
The developed spectrophotometric method was simple, sensitive, specific and reliable with good precision and accuracy. The proposed method is specific while estimating the commercial formulation without interference of excipients and other additives. Hence, this method can be used for routine determination of Drotaverine in bulk sample and pharmaceutical formulations.
The developed spectrophotometric method was simple, sensitive, specific and reliable with good precision and accuracy. The proposed method is specific while estimating the commercial formulation without interference of excipients and other additives. Hence, this method can be used for routine determination of Drotaverine in bulk sample and pharmaceutical formulations.
1. Beckett A.H. and Stenlake J.B., “Practical Pharmaceutical Chemistry”, 4th edition, part-2, p149-152.
2. Sharma B.K., “Instrumental Methods of Chemical Analysis”, Goel Publishing House, India, 13th edition, p1 and 89.
3. Skoog D.A. and West D.M., “Fundamentals of analytical chemistry”, Holt Saunders, Japan, 1982, 1st edition, p187.
4. Homed M. Abdou, “Remington’s Pharmaceutical Sciences”, Alfonso R.G., Mack Publishing Co.,Easton Pennysylvania, 1990, 18th edition, p555.
5. Chatwal G. and Anand S., “Instrumental Methods of Analysis”, Himalaya Publishing House, 2007, 5th edition, p2.624.
6. Martindale: “The Complete Drug Referance” 33rd edition, Londan, Pharmaceutical Press, 2002, p1606.
7. CIMS, 2010 July, p56.
8. Indian Pharmacopoeia, 2010, vol-1, p159, 170.
9. Pratima K. Syal, Madhusmita Sahoo, Dipali M. Mehendre, Snehal S. Ingale, Vishnu P. Choudhari and Bhanudas S. Kuchekar, “Research Journal of Pharmacy and Technology”, p298.
10. Khaggeswar. B*, Harishankar. P, Raghunandan. N., “Scholars Research Library”, p166.
11. D. C. Permanand*1, K. L. Senthilkumar2, B. Senthilkumar1, M.Saravanakumar3 and R.Thirumurthy3, “Scholars Research Library”,p170.
12. *L.P.Kothapalli, V.C. Dewoolkar, A.G. Banerjee, A.B. Thomas, R.K. Nanda, A.D. Deshpande, V. et al, “International Journal of ChemTech Research”, p493.
13. Vikram G. Modak, Dipali D. Tajane, Kunal D. Ingale, Amruta S. Battewar, Vishnu P. Choudhari*, Bhanudas S. Kuchekar, “International Journal of Pharmaceutical Sciences Review and Research”, p111.
14. Prasad R. K.*, Sharma R.,”International Journal of Pharmaceutical Sciences and Drug Research”, p67.


