

About Author: 1. Shah Dhaval D., M.Pharm-II Semester, Quality Assurance Department, Gyan Vihar School of Pharmacy, Jaipur, India
2. Sharma Anil, M.Pharm, H.O.D. Quality Assurance Department, Gyan Vihar School of Pharmacy, Jaipur, India
Reference ID: PHARMATUTOR-ART-1050
Abstract
Generic pharmaceutical products need to confirm to the same standard of quality, efficacy and safety as required of the originator’s (innovator) product. Spefically, the generic product should be therapeutically equivalent and interchangable with the reference product. Testing the bioequivalence between a test product pharmacetically equivalent or a pharmaceutical alternative and a suitable reference product in a pharmacokinetic study with a limited no of subjects is one way of demonstrating therapeutic equivalence. Generic drug applications are termed “abbreviated” because they are generally not required to include preclinical and clinical data to establish safety and effectiveness. This article provides the information about important aspect involved in bioequivalence and regulatory requirment for bioequivalence study.
[adsense:336x280:8701650588]
Introduction
This guidance document provides information about how to establish and conduct bioavailability studies for conventional formulations of oral drugs that are used for systemic effects. The information contained herein deals with conventional formulations of oral drugs that have uncomplicated characteristics.
Each section of this document deals with a particular aspect of a bioavailability study:
• Section 2 covers the setting of objectives for a study.
• Section 3 discusses choosing subjects for a study.
• Section 4 describes the environment in which a study should be conducted.
• Section 5 discusses the dosage and strengths of drugs used in a study.
• Section 6 explains the measring of active ingredients and metabolites over time, as well as the validation requirements for analytical methods.
• Section 7 describes analysing the recorded data.
• Section 8 contains sample analyses and calculations of data from a study.
1.1 Terminology
Bioavailability is an important attribute of oral dosage formulations of drugs used for systemic effects. It is defined as the rate and extent of absorption of a drug into the systemic circulation.
Bioavailability is most frequently assessed by serial measurements of the drug, or its metabolites, or both, in the systemic circulation. These serial measurements provide a plasma (or blood, or serum) concentration-time curve from which a number of important pharmacokinetic parameters can be calculated, including the area under the curve (AUC), the maximum observed concentration (Cmax) and the time when Cmax is reached (tmax). The AUC provides an estimate of the amount of drug absorbed in the systemic circulation while tmax reflects the rate of absorption. Cmax is a more complex function, which, together with tmax, may reflect the rate of absorption.
Comparison of the AUC values following oral versus intravenous administration of an equivalent dose of the same active ingredient provides an estimate of absolute bioavailability for most drugs. Comparison of the plasma concentration profiles of the drug or metabolites, or both, between the test and reference products containing the same active ingredient provides an estimate of comparative bioavailability.
If the test and reference products have the same galenic form and contain the same dose of the same active ingredient(s), they are said to be bioequivalent when the profiles of the drug or metabolite(s), or both are similar. The degree of similarity between the profiles needed to establish bioequivalence is determined by the appropriate statistical assessment and by meeting standards established for the particular drug and formulations being compared.
Bioequivalence implies that the drug product can be expected to have the same systemic effects (both therapeutic and adverse) as the reference product when administered to patients under the conditions specified in the labelling.
Bioequivalence is usually established by measuring the drug, or its metabolites, or both, in plasma (or blood, or serum). In some situations, determination of the urinary excretion of the drug, or its metabolites, or both, may be employed to measure bioavailability and establish bioequivalence. In the absence of an adequate methodology for bioavailability testing, alternate approaches such as pharmacodynamic studies can be used. In some instances, therapeutic equivalence should be determined by clinical trials.
1.2 Scope of These Guidances
These guidances take into account a variety of physicochemical, pharmacokinetic, and clinical characteristics of different drugs and drug products, in addition to the availability of methods for measuring a drug and its metabolites.
Many drugs share enough common characteristics to permit guidelines for bioavailability studies and standards for bioequivalence to be established. The standards are usually determined from single-dose experiments. Such drugs are considered to have uncomplicated characteristics and have none of the characteristics listed as reasons for modified standards.
The guidances in this publication should be followed when performing and when reporting bioavailability studies and bioequivalence studies on drugs with uncomplicated characteristics.
1.3 Exceptions That Require Modifications to the Guidances
The guidances, methodology, and standards given in this document may require modification for certain drugs-for example, those with one or more of the following characteristics:
1. Modified-release dosage forms.
2. Complicated or variable pharmacokinetics, for example:
o non-linear kinetics;
o substantial first-pass effect (greater than 40 percent);
o variable kinetics owing to different genetic phenotypes;
o stereochemical effects such as in vivo inversion of configuration;
o an effective half-life of more than 24h.
3. An important time of onset of effect or rate of absorption.
4. High toxicity or a narrow therapeutic range.
5. Little or no absorption with activity exerted locally in the gastrointestinal tract.
6. A drug measurement methodology insufficiently sensitive or reliable to determine blood concentrations to at least three terminal half-lives.
7. Combination products.
8. Biologicals.
2. Planning a Bioavailability Study
This section identifies the documentation that must be prepared during the planning of a bioavailability study. Descriptions of the study objectives, principal and other investigators, facilities, and ethical review boards must be included in the reports that should follow or accompany each bioavailability study.
2.1 Study Objectives
The objectives of the study should be clearly stated. Information should be provided to justify the inclusion of the tested drug in the category of drugs that have uncomplicated characteristics.
2.2 Principal Investigator
The investigator(s) should be qualified by education, training, and experience to assume responsibility for the proper conduct of the trial, should meet all the qualifications specified by applicable regulatory requirments and should provide evidence of such qualification through up-to-date curriculam vitae and/or other relevant documentation requested by the sponsor, the IRB/IEC and/or the regulatory authorities.
The investigator should be throughally familiar with appropriate use of investigational product(s) as described in the prtocol, in the current investigator’s brochure, in the protocol information and in the other information sources provided by the sponsor.
The investigator should be aware of, and should comply with GCP and other applicable regulatory requirments.
The investigator should permit monitoring and auditing by the sponsor, and inspection by the approriate regulatory authorities.
The investigator should provide a list of appropriately qualified persons to whom the investigator has delegated significant trial related duties.
The investigator is responsible for whole BA-BE trial from screening of the subjects to final report preparation.
2.3 Clinical, Laboratory and Analytical Facilities
The location of all facilities used in the study should be identified, and their suitability demonstrated. This suitability is with respect to the physical plant and capability of a facility involved in experiments with human subjects or in the analysis of biological samples. These should conform to current requirements for Good Clinical Practice or Good Laboratory Practice.*
* Source: Proposed rule Obligations of Clinical Investigators, Federal Register, 43, 35210, (1978) and Code of Federal Regulations, 21. Part 58 (revised April 1988).
2.4 Institutional (Ethical) Review
Documentary evidence must be provided that the study has been approved by an appropriate institutional ethical review board. The current guidelines of the Medical Research Council of Canada** (MRC) or comparable agency should be followed for such a review.
The guidance used for the ethical review should be identified as part of the documentary evidence for the study.
** Guidelines on Research Involving Human Subjects, Medical Research Council of Canada. 1987.
3. Selection of Subjects For a Study
This section describes selection criteria for inclusion of subjects in a bioavailability study and indicates how the characteristics of the subjects may affect the study. A certain minimum number of subjects should be used, and, if a subject withdraws or must be removed from the study, then an explanation for the withdrawal or removal must be included in the study documentation.
[adsense:336x280:8701650588]
3.1 Choice of Subjects
Drugs with uncomplicated characteristics can usually be tested in normal, healthy volunteers. The investigators should ensure that female volunteers are not pregnant or likely to become pregnant during the study. Confirmation should be obtained by urine tests just before the first and last doses of the study.
In some instances, studies may be required to ascertain bioavailability in patients or subjects with special characteristics-for example, for drugs to be used in the treatment of conditions accompanied by altered absorption or distribution, or for drugs to be used in special age groups such as children or the elderly.
3.2 Considerations in Subject Characteristics
An important objective in the selection of subjects is to reduce the intra-subject variability in pharmacokinetics that may be attributable to certain characteristics of the subject. Subjects should be assigned in such a way that the study design is balanced for any factors that are suspected to contribute to variability.
1. Age:
Subjects should be between the age of legal majority and the age of onset of age-associated changes in organic function. This description typically coincides with an age range of 18 to 55 years, inclusive.
2. Height/weight ratio:
The ratio for healthy volunteer subjects should be within 15 percent of the normal range-for example, as given in current Ciba-Geigy or Metropolitan Life Insurance tables.
3. Health:
The health of the volunteers must be determined by the supervising physician through a medical examination and review of results of routine tests of liver, kidney, and hematological functions.
An electrocardiogram should be included in the study documentation if the drug has a cardiac effect. Aberrant laboratory values should be rechecked and a summary must be presented along with the physician's opinion. Psychological characteristics should also be assessed by the physician in order to exclude patients unlikely to comply with study restrictions or unlikely to complete the study. Subjects who have been previously treated for gastrointestinal problems (such as ulcers), orconvulsive, depressive, or hepatic disorders, and in whom there is arisk of a recurrence during the study period, should be excluded.
3.3 Number of Subjects
The number of subjects to be used in the cross-over study should be estimated by considering the standards that must be passed (see Section 7.1) and the drug products being compared. The probability that a study of a given size will pass the standards depends on
• the expected mean difference between the test and reference formulations of both AUCT and Cmax, and
• the anticipated intra-subject coefficient of variation (CV) of both AUCT and Cmax.
For drugs with uncomplicated characteristics, the intra-subject CV is generally less than 20 percent; however, as a result of sampling, or if the study is poorly run, the intra-subject CV can be higher.
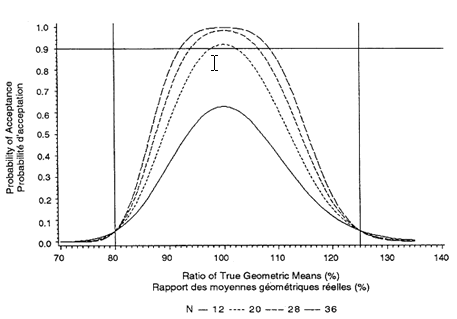
The minimum number of subjects is 12, but a larger number is often required. To estimate the number required, the acceptance probabilities given in Figures 3.1 through 3.3 (for sample sizes of 12, 20, 28, and 36 and intra-subject CVs of 10 percent, 15 percent, and 20 percent) should be used:
1. Obtain an estimate of the intra-subject CV from the literature or from a pilot study.
2. Choose one of Figures 3.1 through 3.3 by determining which one has the closest rounded-up CV to that estimated in a), above.
3. Choose an expected true ratio of test over reference means (usually 100%) and move up the graph to the .90 probability of acceptance.
4. A linear extrapolation between given sample sizes is adequate.
This sample size calculation must be provided in the study protocol. (The formula for calculating acceptance probabilities is based on the paper "The Calculation of Probabilities in Rejecting Bioequivalence" by K. F. Yee (1986), Biometrics 42:961-965.)
For example, the probability that a 90% confidence interval will fall within the bioequivalence interval of 80 percent to 125 percent depends on the intra-subject CV and the sample size. Because the intra-subject CV for Cmax is more variable, an estimate is required if these figures are to be used. The estimate should be rounded-up to one of the CVs given in Figures 3.1 through 3.3. A sample size should then be chosen that gives a .90 probability of passing the standard if the true ratio is between 90 percent and 110 percent.
Figure 3.1: Probability That 90% Confidence Interval Within 80%-125% Cross-over Design, Intra-subject CV = 10% Sample sizes N = 12, 20, 28, 36
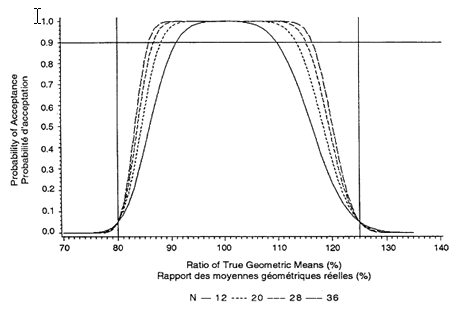
Figure 3.2: Probability That 90% Confidence Interval Within 80%-125% Cross-over Design, Intra-subject CV = 15% Sample sizes N = 12, 20, 28, 36
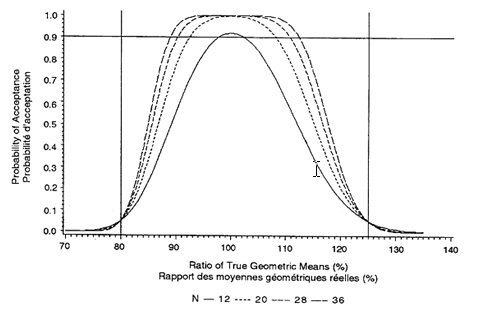
Figure 3.3: Probability That 90% Confidence Interval Within 80%-125% Cross-over Design, Intra-subject CV = 20% Sample sizes N = 12, 20, 28, 36
More subjects than the sample size calculation requires should be recruited into the study. This strategy allows for possible drop-outs and withdrawals. Two basic methods are used to account for drop-outs and withdrawals. First, a fixed number (one or two for each sequence) of subjects are added to the sample-size number. Second, a fixed number of subjects are added into the study. These subjects are designated as extras. Only if there is a drop-out will the appropriate extra subject's blood samples be assayed. The method of accounting for drop-outs must be outlined in the protocol.
As a result of random variation or a larger than expected relative difference, there is no guarantee that the sample size as calculated will pass the standards. If the study is run with the appropriate size and the standards are not met, the sponsor may add more subjects (a minimum of 12). If this option is chosen, it must be stated in the study protocol. Two criteria must be met before combining is acceptable:
• The same protocol must be used (i.e., same formulations, same blood sampling times, a minimum number of 12 subjects, etc.),
• Consistency tests must be met at an ALPHA error rate of five percent.
3.4 Drop-outs and Withdrawal of Subjects from a Study
The subjects must be available, without coercion, for all legs of the study. It is recommended that the number of subjects should be sufficient to allow for possible drop-outs or withdrawals. (See Section 3.3, "Number of Subjects.")
Reasons for withdrawal (e.g., adverse drug reaction) must be reported and the subject's plasma (or blood, or serum) level data provided. The results of all samples that were measured in subjects who were withdrawn from the study must be included in the report. If subjects drop out of the study for personal reasons, the subject's blood samples do not have to be assayed.
Reimbursement policy should be specified prior to initiating the study and should be in agreement with MRC or similar guidelines.
4. Study Design and Environment
The design of a bioavailability study should minimize variability that is not attributable to the drug per se and should eliminate bias as much as possible. The guidances in this section serve for the usual case. Other designs may be permissible after consultation with Health Canada (HC) before the study is initiated.
4.1 Standardization
Every effort should be made to standardize the study conditions in every phase of the study-for example, exercise, diet, smoking, and alcohol use. It is preferable to use non-smokers; where smokers are included, they must be so identified.
Volunteers should not take any other drug, including alcoholic beverages and over-the-counter (OTC) drugs, for an appropriate interval before-as well as during-the study. In the event of emergency, the use of any drug must be reported (dose and time of administration). The decision whether to include or exclude the results from a subject who has varied from the established protocol should be made before statistical analysis commences.
4.2 Blinding
If possible, the study should be conducted in such a way that the subject is not aware of which product is administered. Furthermore, the person checking for adverse reactions and the person conducting the analysis of samples must not know which product was administered. Other individuals involved in the administration of the drugs, the surveillance of the patients, or the analysis of plasma (or blood, or serum) data should not know which product was administered.
4.3 Design
The basic design to be used is a two-period cross-over, in which each subject is given the test and reference formulations. In cases where more than two formulations are under study, or are studied under different conditions, each volunteer should receive all treatments in a restricted randomized design. However, when the number of treatments results in a study that is longer than a month, a balanced incomplete block design may be considered.
4.4 Administration of Food and Fluid
The administration of food and fluid should be controlled carefully. Normally, subjects should fast for 10 hours before drug administration. A fast means that no food or solids are to be consumed, although alcohol-free and xanthine-free clear fluids are permissible the night prior to the study. On the morning of the study, up to 250 mL of water may be permitted up to two hours before drug administration. The dose should be taken with water of a standard volume (e.g., 150 mL) and at a standard temperature. Two hours after drug administration, 250 mL of xanthine-free fluids are permitted. Four hours after drug administration, a standard meal may be taken. All meals should be standardized and repeated on each study day.
If the oral preparation is being compared with an intravenous (IV) dose, the food and fluid restrictions noted above should also apply to the IV dose.
Some drugs are given with food to reduce gastrointestinal side effects. Studies of such drugs should include studies with standard meals.
The nature of the test meal to be administered-in the part of the study where the formulation is given in the presence of food-should be determined based on the physicochemical and pharmacokinetic characteristics of the drug and its formulation. The purpose is to select a test meal that has the greatest potential to demonstrate altered bioavailability. The meal should be given within a predetermined, constant time of administration of the drug. The appropriate choice of the meal's timing and its contents should be chosen carefully.
4.5 Posture and Physical Activity
For most drugs, subjects should not be allowed to recline until at least two hours after drug ingestion. Physical activity and posture should be standardized as much as possible to limit effects on gastrointestinal blood flow and motility. The same pattern of posture and activity should be maintained for each study day.
4.6 Interval Between Doses
The interval between study days should be long enough to permit elimination of essentially all of the previous dose from the body. The interval should be the same for all subjects and, to account for variability in elimination rate between subjects, normally should be not less than 10 times the mean terminal half-life of the drug. Normally, the interval between study days should not exceed three to four weeks. Furthermore, the drugs must be administered at approximately the same time on each study day and, where possible, the same day of the week.
4.7 Sampling Times
The duration of blood or urine sampling in a study should be sufficient to account for at least 80 percent of the known AUC to infinity (AUCI). This period is usually at least three times the terminal half-life of the drug. To permit Calculation of the relevant pharmacokinetic parameters, from 12 to 18 samples should be collected per subject per dose. An account of inter-subject variability should be used in the placement and number of samples. The exact times at which the samples are taken must be recorded and spaced such that the following information can be estimated accurately:
1. peak concentration of the drug in the blood (Cmax),
2. the area under the concentration time curve (AUC) is at least 80 percent of the known AUCI, and
3. the terminal disposition rate constant of the drug.
There may be considerable inaccuracies in the estimates of the terminal disposition rate constant if the constant is estimated from linear regression using only a few points. To reduce these inaccuracies it is preferable that four or more points be determined during the terminal log-linear phase of the curve. If urine is used as the biological sampling fluid (see below), then sufficient samples must be obtained to permit an estimate of the rate and extent of renal excretion.
4.8 Sampling of Blood or Urine
Under normal circumstances, blood should be the biological fluid sampled to measure the concentrations of the drug. In most cases the drug may be measured in serum or plasma; however, in some cases, whole blood may be more appropriate for analysis. If the concentrations in the blood are too minute to be detected and a substantial amount (>40 percent) of the drug is eliminated unchanged in the urine, then the urine may serve as the biological fluid to be sampled.
When urine is collected at the study centre, the volume of each sample must be measured immediately after collection and included in the report. Urine should be collected over no less than three times the terminal elimination half-life. For a 24-hour study, sampling times of 0 to 2, 2 to 4, 4 to 8, 8 to 12, and 12 to 24 hours are usually appropriate. Quantitative creatinine determinations on each urine sample are also required.
Sometimes the concentration of drug in a fluid other than blood or urine may correlate better with effect. Nevertheless, the drug must first be absorbed prior to distribution to the other fluids such as the cerebrospinal fluid, bronchial secretions, and so on. Thus, for bioavailability estimations, blood is still to be sampled and assayed.
4.9 Handling of Samples
Samples should be processed and stored under conditions that have been shown not to cause significant degradation of the analytes. Appropriate storage conditions should be confirmed with samples from subjects who have been given the drug under study, in case spiked samples give misleading results.
4.10 Identification of Adverse Reactions and Side Effects
In some cases, adverse drug reactions are due to factors other than the active ingredient in a formulation. The rate of absorption and excipients within formulations may affect the frequency, onset, and severity of adverse drug reactions. The incidence, severity, and duration of adverse reactions and side effects observed during the study must be reported. The probability that an adverse effect is drug-induced is to be judged by the investigator.
The same observer and format for eliciting and recording information on adverse drug reactions should be used for all subjects. Questions concerning adverse reactions and side effects should be asked on each study day by the "blinded" observer. For drugs with known adverse reactions and side effects-for example, metallic taste, postural hypotension, cardiac dysrhythmia-the specific questions should be raised and observations, such as blood pressure measurement and electrocardiogram, should be performed and recorded at the time the reactions are known to occur with respect to the time of administration. In asking the questions, the interviewer should not lead the subject into believing that the reactions are expected or unexpected. Furthermore, the subject should be questioned in private.
5. Test and Reference Drug Products
This section describes the required characteristics of the test and reference drug products that must be documented, including quality, dosage, and strength.
Drug and reference materials must be of high quality and mention must be made in the study documentation (report) of the dosage and strength of the drug and what reference product is used in the study.
5.1 Chemistry
The products must meet a Schedule B or other applicable standard acceptable to Health Canada. The chemistry and manufacturing guidances for preclinical and new drug submissions should be consulted for an interpretation of the general technical requirements listed in sections C.08.005(1) and C.08.002(2) respectively.
5.2 Dosage and Strength
In bioequivalence studies, the molar equivalent dose of each product should be used. The lots for comparative bioavailability testing should be taken from a batch that is comparable in size and is produced using the same type of equipment and procedures proposed for market. In other words, the lots for comparative bioavailability testing should be representative of proposed production batches.
For an uncomplicated drug in which the proportions of excipients to the drug and the dissolution characteristics are the same, it is sufficient to establish the bioavailability of one strength. Whether all strengths of other products should be tested will depend on the extent to which the formulation differs among strengths. For some of the complicated drugs-such as those with narrow therapeutic ranges, steep dose-response characteristics, or with non-linear kinetics that would influence a single-dose study-the bioavailability of each strength of the drug should be established.
5.3 Selection of Reference Product
For a new drug substance (i.e., the first market entry), an oral solution should be used as the reference product when possible. The oral solution can be prepared from an intravenous solution, if available.
In bioequivalence studies, the reference product is:
• a drug product that has been issued a notice of compliance pursuant to section C.08.004 of the Food and Drug Regulations, and is currently marketed in Canada by the innovator, or
• a drug product acceptable to the Director.
6. Measurement Methodology
Bioavailability determinations rely on the adequacy of analytical methods for parent drugs and, when appropriate, their metabolites. This section describes the attributes of such methods and the validation procedures required in reports to establish and maintain selectivity, range, precision, and accuracy.
6.1 Drug and Drug Metabolites
The determination of bioavailability is dependent upon the reliable, precise, and accurate measurement of the active ingredient, or its metabolites, or both, as a function of time. Normally, measurement of the parent compound or active ingredient will be adequate; however, in certain circumstances, the measurement of metabolites could be required. When a pro-drug is administered, the active component should be measured.
6.2 Assay Methodology
The analytical methods used to measure the drug, or metabolites, or both, in plasma, blood, serum, or urine must be reproducible, specific, and sufficiently sensitive, precise, and accurate. When these operating parameters have been shown to be adequate in the hands of the test laboratory, the investigators can then undertake the bioavailability study.
The principles and procedures for analytical validation described in the summary document "Analytical Methods Validation: Bioavailability, Bioequivalence, and Pharmacokinetic Studies," V. P. Shah et al (1992), Journal of Pharmaceutical Sciences 81(3) should be followed. In addition to pre-study validation, appropriate performance characteristics (accuracy, precision, quality control) should be documented for each analytical run during a study, according to Good Laboratory Practice (GLP) principles.
6.3 Stability
In order for samples to maintain their stability (degradation of analytes), they should be handled according to the directions in (Section 4.9, "Handling of Samples.")
6.4 Limit of Quantitation (LOQ)
The analytical method chosen should be capable of assaying the analyte over the expected concentration range. A reliable lowest limit of quantitation should be established based on an intra- and inter-day coefficient of variation (CV) usually not greater than 20 percent. The limit of detection (LOD-the lowest concentration that can be differentiated from background levels) is usually lower than the LOQ. Values between LOQ and LOD should be identified as "Below Quantitation Limits."
6.5 Specificity
It must be demonstrated that endogenous compounds in the biologic matrix, nutrients, metabolites, and degradation products do not interfere with the assay method. In cases in which a stereospecific method is used, proof of the specificity must be documented. Specificity should be established using at least six independent sources of the same matrix in the species being studied.
6.6 Recovery
The reproducibility of the absolute recovery of drug during the sample preparation procedure must be demonstrated and should be established for low, medium and high concentrations, based on the expected range.
6.7 Standard Curves
A standard curve demonstrates the range of concentrations over which an analyte can be reliably determined in matrix, using a minimum of five concentration points. Standard curves should be run on each day of analysis. The within- and between-day variability in the standard curves must be reported together with the coefficients of variation (CVs) obtained during sample measurement. These attributes will be used to determine the acceptability of the standard curve. The number of standards to be used will be a function of the dynamic range and nature of the concentration-detector response relationship. The standard curve should be determined using an appropriate algorithm.
6.8 Precision and Accuracy
The precision and accuracy of the assay must be determined for low, medium, and high drug concentrations in the biological matrix, based on the expected range. Accuracy for inter-day and intra-day should be within 15 percent of the nominal value. For precision, the CV should be no greater than 15 percent, except at the limit of quantitation, when a value no greater than 20 percent is acceptable.
6.8.1 Replicate Samples
In general, single sample analysis will suffice. When single assays are performed, 15 percent of the incurred samples must be randomly selected and re-assayed. (Studies in which the sample of blood is insufficient for duplicate analysis should include a pre-study verification with incurred samples.)
The second measurement is not to be averaged with the first; only the variation between samples is to be summarized and then reported separately. The purpose of the re-assaying is to establish that the degree of precision obtained with incurred samples is similar to that obtained for spiked standard or Quality Control (QC) samples.
If the proposed method does not have the potential to give the required precision, all samples may be replicated. In this case, the replicates would be averaged. The variation between samples should be reported separately.
6.9 Quality Control for Spiked Samples
For stable analytes, quality control (QC) samples must be prepared in the fluid of interest (e.g., plasma), including concentrations at least at the low, middle, and high segments of the calibration range. The quality control samples must be stored with the study samples. These are accepted for stability if they exhibit similar characteristics to those taken from volunteers.
For less stable analytes, daily or weekly quality control samples may have to be prepared.
A minimum of six QC samples, composed of three concentrations in duplicate, must be blinded and analysed with each batch of study samples for each analytical day or run.
6.10 Aberrant Values (Repeat Assays)
In most studies, some blood/plasma/serum or urine samples will require re-assay. Criteria for identifying these samples should be established ahead of time.
Certain aberrant values can be identified before breaking the analytical code. These values may be attributed to such factors as:
• processing errors,
• equipment failure,
• obviously poor chromatography, or
• quality control samples outside pre-defined tolerances.
Other apparently aberrant values may become evident after the analytical code is broken. In some such cases, the original assay value would show poor pharmacokinetic fit (but this should be applied with caution). In other cases, there might be a need to confirm a double peak. For aberrant values that have become evident after the analytical code is broken, the submission must note the reason for the repeat assay.
When the results of a repeat assay differ from the original by more than 15 percent, a third analysis should be performed. When three replicate analyses indicate that one is spurious, then the average of the other two should be used. The criteria used in selecting among replicates for inclusion in calculations should be stated.
7. Analysis of Data
When all measurements of samples have been completed, the information collected must be analysed. This section discusses the data that must be recorded, the parameters of that data, the statistical analyses that must be performed on the data, and the format that should be used to present the results in reports.
7.1 Standards for Bioequivalence
For drugs with uncomplicated characteristics, the following standards-obtained in single dose cross-over comparative bioavailability studies-determine bioequivalence:
1. The 90% confidence interval of the relative mean AUCT of the test to reference product should be within 80 percent to 125 percent.
2. The relative mean measured Cmax of the test to reference product should be between 80 percent and 125 percent.
These standards must be met on log transformed parameters calculated from
• the measured data, and
• data corrected for measured drug content (percent potency of label claim) as given in the example included in Section 8.10.
This AUC standard is a refinement of that used by Health Canada (HC) for 20 years. The standard is now augmented by a criterion for Cmax, indicative of the rate of absorption. The combination of the AUC and Cmax criteria serves as a limit on differences in the rate of absorption for drugs with uncomplicated characteristics. (Although tmax may appear to be a suitable parameter, establishing it accurately is often difficult. The significance of differences varies from drug to drug.)
Note:These standards are not intended to be used for the determination of bio-inequivalence.
7.2 Presentation of Data
The concentrations of the drug in plasma (or blood, or serum) for each subject, the sampling time, and the formulation should be tabulated. Unadjusted, measured concentrations should be provided.
Deviations from the protocol (e.g., missed samples or late collection of samples) should be clearly identified in the tables.
Two graphs should be drawn for each subject and two for the mean values of all subjects, one linear and the other semilogarithmic. On these graphs, the drug concentrations from the reference and the test formulations should be plotted against the sampling times. Natural logarithms (ln) are to be employed. Usually, the semilogarithmic graphs should display the regression lines that are employed to estimate the terminal disposition rate constant (λ) for the two formulations.
7.3 Pharmacokinetic Parameters
Estimates of the following pharmacokinetic parameters must be tabulated for each subject-formulation combination:
1. AUCT:
Area under the concentration-time curve measured to the last quantifiable concentration, using the trapezoidal rule.
2. AUCI:
AUCT plus additional area extrapolated to infinity, calculated using λ.
3. AUCT/AUCI:
The ratio of AUCT to AUCI
4. Cmax:
Maximum observed concentration.
5. tmax:
Observed time at which Cmax occurred.
6. λ:
Terminal disposition rate constant.
Additional pharmacokinetic parameters may also be presented, but the methods used to estimate them should be fully described.
All concentrations and sample times, as well as the derived pharmacokinetic parameters for each subject-formulation combination, should be supplied in computer-readable form. For more information, consult Computer Format for the Submission of Data for Comparative Bioavailability Studies, published by the Bureau of Pharmaceutical Surveillance.
7.4 Statistical Analysis
7.4.1 Analyses of variance (ANOVAs)
The analysis of variance (ANOVA) tables submitted with the study documentation (report) should include the appropriate statistical tests of all effects in the model. The output from ANOVAs appropriate to the study design and execution must be expressed with enough significant figures to permit further calculations.
The analyses should include all data for all subjects (see Section 3.4, "Drop-outs and Withdrawal of Subjects from a Study") on measured data. Supplementary analyses may also be carried out with selected points or subjects initially excluded from the analyses. Such exclusions must be justified. It is rarely acceptable to exclude more than 5 percent of the subjects or more than 10 percent of the data for a single subject-formulation combination.
An ANOVA should be carried out on the tmax and λ data, and on the logarithmically transformed AUCT, AUCI, and Cmax data. The analysis and results for each parameter should be reported on a separate page as detailed in (Section 8, "Sample Analysis for a Comparative Bioavailability Study.") The reported results must include:
1. means and CVs (across subjects) for each product;
2. the ANOVA, containing source, degrees of freedom, sum of squares, mean square, F and p values, and the derived intra- and inter-subject CVs;
3. AUCT and Cmax ratios for test versus reference products;
4. the 90% confidence interval about the mean AUCT; and
5. estimates of measured content for each formulation being compared, and a separate table showing c) and d) above, corrected for measured content.
7.4.2 Consistency Tests for Combining Studies
If two or more studies have been completed, they may be pooled if certain requirements are met.
1. The same protocol must be used for all studies.
Specifically, this means that the same analytical method is to be used, the blood samples drawn.
2. Two consistency tests must be done on the studies to ensure that pooling is meaningful.
The first test is the test of equality of the residual mean squares. Take the ratio of the residual from the first study to the residual for each of the other studies. (For each ratio, the smaller of the two residuals must be used as the denominator.) This ratio is compared to an F statistic, using the degrees of freedom associated with the residuals. If the ratio is greater than the 5% F value, the studies may not be combined. The second test is the formulation by study interaction and is carried out as shown in Table 7-A.
Table 7-A
|
Pooled ANOVA for Testing Formulation by Study Interaction from S Two-period Cross-over Studies of Size NI |
|||
|
Source |
df |
F-Ratio Denominator |
P-Value |
|
Study |
S - 1 |
Subject (Study) |
- |
|
Subject (Study) |
Σ (NI - 1) |
Residual |
- |
|
Period (Study) |
S |
Residual |
- |
|
Formulation |
1 |
Residual |
- |
|
Formulation by Study |
S - 1 |
Residual |
>.05 |
|
Residual |
Σ (NI - 1) |
- |
- |
In order to combine studies, the formulation by study interaction effect should not be significant at the 5% level.
The construction of the confidence intervals should be based on least-square means and the residual from this ANOVA.
8. Sample Analysis for a Comparative Bioavailability Study
The following tables and figures illustrate data collected and used in a sample bioavailability study. An analysis of this data is also shown.
Although a comparative bioavailability study may include many formulations, the basic analysis is the same-each test formulation is compared to a standard formulation.
The analysis of any comparative bioavailability study must have the following sections:
1. A randomization scheme for the design, where all subjects randomized into the study are included and identified by code, sequence, and dates of the dosing periods for both test and reference formulations. (See Section 8.1.)
2. A summary of drug concentrations (visual and quantitative) at each sampling time for each subject for both test and reference formulations. (See Section 8.2.)
3. A summary of the estimates of the parameters as defined in Section 8.3 for both test and reference formulations, including the means, standard deviations, and CVs. (See Section 8.4.)
4. A formal statistical analysis of the relevant parameters with comparisons of the test formulations to the reference formulations. (See Sections 8.5 through 8.9.)
5. A summary of corrections for potency (measured content) in estimates. (See Section 8.10.)
All the sample statistical analyses that follow have the minimum two formulations (test and reference) given on two dosing days or periods.
8.1 Randomization Scheme of the Design
Shown in Table 8-A is the randomization scheme for the cross-over design used in the study. In any study, all subjects who were randomized into the study must be included. Even those subjects that did not complete the study must be included and identified accordingly. Subject numbers that appear on informed consent forms and reporting forms must be given. Also, if any other subject identification code was used, it should be given here. The sequence to which the subject was randomized should be given. Finally, all dosing periods and dates must be given.
8.2 Summary of Drug Concentrations
Tables 8-B and 8-C show a list of the concentrations at each sampling time for each subject for the test and reference formulations, respectively. If any concentration is missing, it should be identified, and the reason it is missing given (e.g., lost sample; sample not collected).
Although no formal statistical analysis is required at each sampling time, it is recommended that summary statistics be given at each sampling time for each formulation. It is also helpful if the lower limit of quantitation of the analytical method is given in this table.
Table 8-A
|
Randomization Scheme of the Cross-over Design for the Comparison of Test (T) Versus Reference (R) Formulations |
||||
|
Subject |
Period |
|||
|
Number |
ID |
Sequence |
May 14, 1988 |
May 21, 1988 |
|
001 |
A |
TR |
T |
R |
|
002 |
B |
RT |
R |
T |
|
003 |
C |
RT |
R |
T |
|
004* |
D |
TR |
T |
- |
|
005 |
E |
TR |
T |
R |
|
006 |
F |
RT |
R |
T |
|
007 |
G |
TR |
T |
R |
|
008 |
H |
RT |
R |
T |
|
009 |
T |
TR |
T |
R |
|
010** |
I |
RT |
- |
- |
|
011 |
K |
RT |
R |
T |
|
012 |
L |
TR |
T |
R |
|
013 |
M |
TR |
T |
R |
|
014 |
N |
RT |
R |
T |
|
015 |
O |
RT |
R |
T |
|
016 |
P |
TR |
T |
P |
|
017 |
Q |
RT |
R |
T |
|
018 |
R |
TR |
T |
R |
* Subject did not appear for second period.
** Subject did not appear for either period.
Table 8-B
|
Drug Concentrations (ng/mL) for the Test Formulation |
|||||||||||||||
|
ID |
Seq |
Period |
Sampling Times (hours) |
|
|||||||||||
|
0.0 |
0.33 |
0.66 |
1.0 |
1.5 |
2.0 |
3.0 |
4.0 |
6.0 |
8.0 |
12.0 |
16.0 |
|
|||
|
A |
TR |
14 May |
0.00 |
BQL* |
52.01 |
95.03 |
122.20 |
77.88 |
65.15 |
46.24 |
19.20 |
14.99 |
BQL* |
BQL* |
|
|
B |
RT |
21 May |
0.00 |
BQL* |
56.66 |
80.85 |
102.00 |
86.41 |
63.81 |
49.20 |
24.00 |
11.37 |
8.24 |
BQL* |
|
|
C |
RT |
21 May |
0.00 |
28.63 |
201.50 |
189.80 |
188.70 |
136.20 |
97.64 |
64.53 |
32.08 |
20.63 |
14.59 |
BQL* |
|
|
E |
TR |
14 May |
0.00 |
BQL* |
9.04 |
34.32 |
47.70 |
52.79 |
59.47 |
32.61 |
17.61 |
8.76 |
BQL* |
BQL* |
|
|
F |
RT |
21 May |
0.00 |
BQL* |
55.33 |
66.40 |
58.97 |
48.29 |
43.19 |
34.23 |
17.30 |
6.15 |
BQL* |
BQL* |
|
|
G |
TR |
14 May |
0.00 |
BQL* |
33.15 |
45.64 |
54.19 |
34.13 |
32.78 |
21.73 |
10.75 |
8.35 |
BQL* |
BQL* |
|
|
H |
RT |
21 May |
0.00 |
35.38 |
79.14 |
100.90 |
70.71 |
48.43 |
30.73 |
26.19 |
8.65 |
6.83 |
BQL* |
BQL* |
|
|
I |
TR |
14 May |
0.00 |
BQL* |
64.57 |
76.52 |
89.51 |
86.21 |
69.04 |
50.96 |
21.55 |
13.71 |
7.55 |
BQL* |
|
|
K |
RT |
21 May |
0.00 |
BQL* |
79.34 |
99.41 |
154.80 |
58.60 |
57.12 |
32.57 |
19.82 |
BQL* |
BQL* |
BQL* |
|
|
L |
TR |
14 May |
0.00 |
14.78 |
55.54 |
56.88 |
46.87 |
37.29 |
28.75 |
25.20 |
BQL* |
BQL* |
BQL* |
BQL* |
|
|
M |
TR |
14 May |
0.00 |
BQL* |
BQL* |
BQL* |
BQL* |
BQL* |
8.37 |
23.15 |
19.74 |
16.49 |
5.74 |
5.18 |
|
|
N |
RT |
21 May |
0.00 |
BQL* |
37.76 |
28.58 |
21.56 |
19.02 |
13.25 |
12.44 |
6.38 |
BQL* |
BQL* |
BQL* |
|
|
O |
RT |
21 May |
0.00 |
BQL* |
27.85 |
43.30 |
43.30 |
32.57 |
29.59 |
25.42 |
16.89 |
7.68 |
BQL* |
BQL* |
|
|
P |
TR |
14 May |
0.00 |
BQL* |
68.25 |
52.57 |
51.97 |
28.64 |
23.70 |
12.74 |
BQL* |
BQL* |
BQL* |
BQL* |
|
|
Q |
RT |
21 May |
0.00 |
BQL* |
5.90 |
13.00 |
27.54 |
13.32 |
12.34 |
9.81 |
9.73 |
BQL* |
BQL* |
BQL* |
|
|
R |
TR |
14 May |
0.00 |
BQL* |
18.92 |
35.77 |
53.93 |
60.43 |
47.44 |
41.72 |
16.66 |
8.87 |
5.49 |
BQL* |
|
|
MEAN |
- |
- |
0.00 |
4.92 |
52.81 |
63.69 |
70.87 |
51.26 |
42.65 |
31.80 |
15.04 |
7.73 |
2.60 |
0.32 |
|
|
STD |
- |
- |
0.00 |
11.26 |
47.05 |
45.04 |
49.76 |
33.66 |
24.64 |
15.42 |
8.60 |
6.57 |
4.42 |
1.29 |
|
|
CV |
- |
- |
- |
228.66 |
89.09 |
70.72 |
70.22 |
65.66 |
57.79 |
48.51 |
57.18 |
84.94 |
169.84 |
400 |
|
*Lower limit of quantitation is 5 ng/mL. Any concentration below this limit is reported as Below Quantification Limit (BQL) except at time 0. Zero is used in the calculation of area under the curve (AUC) for times preceding the first observed concentration and in the calculation of summary statistics.
Table 8-C
|
Drug Concentrations (ng/mL) for the Reference Formulation |
|||||||||||||||
|
ID |
Seq |
Period |
Sampling Times (hours) |
|
|||||||||||
|
0.0 |
0.33 |
0.66 |
1.0 |
1.5 |
2.0 |
3.0 |
4.0 |
6.0 |
8.0 |
12.0 |
16.0 |
|
|||
|
A |
TR |
14 May |
0.00 |
BQL* |
116.40 |
124.60 |
126.20 |
107.60 |
45.65 |
33.22 |
16.11 |
12.60 |
BQL* |
BQL* |
|
|
B |
RT |
21 May |
0.00 |
BQL* |
88.45 |
121.40 |
206.90 |
179.00 |
84.53 |
40.02 |
38.01 |
15.12 |
5.39 |
BQL* |
|
|
C |
RT |
14 May |
0.00 |
BQL* |
BQL* |
95.57 |
122.80 |
103.20 |
101.70 |
57.65 |
23.85 |
14.59 |
6.29 |
BQL* |
|
|
E |
TR |
21 May |
0.00 |
BQL* |
37.23 |
37.26 |
35.90 |
28.87 |
28.48 |
25.10 |
24.91 |
6.72 |
BQL* |
BQL* |
|
|
F |
RT |
14 May |
0.00 |
BQL* |
29.25 |
62.88 |
64.26 |
84.67 |
45.21 |
25.05 |
17.18 |
8.47 |
BQL* |
BQL* |
|
|
G |
TR |
21 May |
0.00 |
BQL* |
6.89 |
50.04 |
55.27 |
51.68 |
38.58 |
26.19 |
7.79 |
BQL* |
BQL* |
BQL* |
|
|
H |
RT |
14 May |
0.00 |
BQL* |
113.50 |
218.70 |
125.80 |
69.77 |
45.03 |
32.78 |
18.55 |
5.42 |
BQL* |
BQL* |
|
|
I |
TR |
21 May |
0.00 |
BQL* |
181.90 |
135.80 |
96.51 |
90.50 |
62.58 |
30.43 |
18.50 |
BQL* |
BQL* |
BQL* |
|
|
K |
RT |
14 May |
0.00 |
BQL* |
42.71 |
58.75 |
59.68 |
54.37 |
44.35 |
22.94 |
11.58 |
6.95 |
BQL* |
BQL* |
|
|
L |
TR |
21 May |
0.00 |
BQL* |
14.29 |
21.32 |
24.32 |
25.56 |
25.51 |
10.49 |
5.49 |
BQL* |
BQL* |
BQL* |
|
|
M |
TR |
21 May |
0.00 |
BQL* |
8.21 |
48.87 |
57.05 |
56.32 |
42.08 |
24.79 |
16.54 |
15.81 |
7.60 |
BQL* |
|
|
N |
RT |
14 May |
0.00 |
BQL* |
47.20 |
34.90 |
34.90 |
24.19 |
20.11 |
8.08 |
7.27 |
BQL* |
BQL* |
BQL* |
|
|
O |
RT |
14 May |
0.00 |
BQL* |
BQL* |
20.35 |
70.88 |
70.60 |
70.38 |
40.51 |
26.93 |
8.20 |
BQL* |
BQL* |
|
|
P |
TR |
21 May |
0.00 |
BQL* |
39.23 |
86.29 |
97.46 |
52.26 |
40.53 |
26.74 |
12.54 |
BQL* |
BQL* |
BQL* |
|
|
Q |
RT |
14 May |
0.00 |
BQL* |
BQL* |
30.86 |
88.38 |
37.67 |
29.28 |
14.99 |
6.38 |
BQL* |
BQL* |
BQL* |
|
|
R |
TR |
21 May |
0.00 |
BQL* |
BQL* |
24.84 |
59.27 |
98.82 |
69.98 |
46.50 |
23.46 |
9.91 |
6.96 |
BQL* |
|
|
MEAN |
- |
- |
0.00 |
- |
45.33 |
73.28 |
82.85 |
70.94 |
49.62 |
29.09 |
17.19 |
6.49 |
1.64 |
- |
|
|
STD |
- |
- |
0.00 |
- |
53.30 |
54.49 |
46.24 |
39.78 |
22.51 |
12.88 |
8.83 |
5.98 |
2.96 |
- |
|
|
CV |
- |
- |
- |
- |
117.59 |
74.37 |
55.82 |
56.08 |
45.37 |
44.28 |
51.38 |
92.23 |
180.73 |
- |
|
*Lower limit of quantitation is 5 ng/mL. Any concentration below this limit is reported as Below Quantification Limit (BQL) except at time 0. Zero is used in the calculation of area under the curve (AUC) for times preceding the first observed concentration and in the calculation of summary statistics.
8.3 List of Parameters and Definitions
Table 8-D shows a list of the parameters used in the analysis and their definitions. If any other parameters are used, they must also be clearly defined.
Table 8-D
|
Parameter Definitions |
|
|
Parameter |
Definition |
|
Cmax |
Maximum observed concentration (ng/mL). |
|
tmax |
Sampling time at which Cmax occurred (h). |
|
AUCt |
Area under the raw concentration versus time curve calculated using the trapezoidal rule from time 0 to LQCT (ng·h/mL). |
|
AUCI |
Area to infinity = AUCT + CT/λ where CT is the estimated concentration at LQCT (ng·h/mL). |
|
AUCT X 100 AUCI |
Percent of the area measured by AUCT relative to the extrapolated total AUC. |
|
λ |
Terminal disposition rate constant calculated from the points on the log-linear end of the concentration versus time curve (h-1). |
|
TLIN |
Time point where log-linear elimination begins (h). |
|
LQCT |
Lowest Quantifiable Concentration Time. Time at which the last concentration occurred that is above the lower limit of quantitation (h). |
|
T1/2 |
Drug half-life = ln2/λ = 0.693/λ (h). |
8.4 Summaries of Parameter Estimates
Tables 8-E and 8-F list, for each subject, the estimates of the parameters defined in Table 8-D for the test and reference formulations respectively. Summary statistics (arithmetic means or medians, standard deviations, and CVs) should be given for each formulation.
Table 8-E
|
Parameter Estimates for Each Subject Given the Test Formulation |
||||||||||||
|
ID |
Seq |
Period |
TEST FORMULATIONS |
|
||||||||
|
Cmax (ng/mL) |
tmax (h) |
AUC T (ng . h/mL) |
AUC I (ng . h/mL) |
AUC T (%) |
λ (h- 1) |
TLIN (h) |
LQCT (h) |
t ½ (h) |
|
|||
|
A |
TR |
14 May |
122 |
1.50 |
365 |
409 |
89 |
0.3002 |
2.0 |
8.0 |
2.3 |
|
|
B |
RT |
21 May |
102 |
1.50 |
405 |
432 |
94 |
0.2384 |
3.0 |
12.0 |
2.9 |
|
|
C |
RT |
21 May |
202 |
0.66 |
703 |
774 |
91 |
0.1776 |
4.0 |
12.0 |
3.9 |
|
|
E |
TR |
14 May |
59 |
3.00 |
233 |
256 |
91 |
0.3680 |
3.0 |
8.0 |
1.9 |
|
|
F |
RT |
21 May |
66 |
1.00 |
247 |
265 |
93 |
0.3902 |
3.0 |
8.0 |
1.8 |
|
|
G |
TR |
14 May |
54 |
1.50 |
178 |
205 |
87 |
0.2768 |
3.0 |
8.0 |
2.5 |
|
|
H |
RT |
21 May |
101 |
1.00 |
246 |
263 |
94 |
0.3437 |
2.0 |
8.0 |
2.0 |
|
|
I |
TR |
14 May |
90 |
1.50 |
408 |
433 |
94 |
0.2486 |
3.0 |
12.0 |
2.8 |
|
|
K |
RT |
21 May |
155 |
1.50 |
315 |
372 |
85 |
0.3379 |
3.0 |
6.0 |
2.1 |
|
|
L |
TR |
14 May |
57 |
1.00 |
140 |
331 |
42 |
0.1318 |
3.0 |
4.0 |
5.3 |
|
|
M |
TR |
14 May |
23 |
4.00 |
165 |
195 |
85 |
0.1485 |
6.0 |
16.0 |
4.7 |
|
|
N |
RT |
21 May |
38 |
0.66 |
88 |
113 |
78 |
0.2620 |
2.0 |
6.0 |
2.6 |
|
|
O |
RT |
21 May |
43 |
1.00 |
183 |
215 |
85 |
0.2671 |
3.0 |
8.0 |
2.6 |
|
|
P |
TR |
14 May |
68 |
0.66 |
122 |
148 |
83 |
0.5031 |
1.5 |
4.0 |
1.4 |
|
|
Q |
RT |
21 May |
28 |
1.50 |
68 |
113 |
60 |
0.1833 |
1.5 |
6.0 |
3.8 |
|
|
R |
TR |
14 May |
60 |
2.00 |
275 |
292 |
94 |
0.2546 |
3.0 |
12.0 |
2.7 |
|
|
MEAN |
- |
- |
79 |
1.50 |
259 |
301 |
84 |
0.2770 |
3.0 |
8.0 |
2.8 |
|
|
STD |
- |
- |
48 |
0.89 |
158 |
164 |
14 |
0.0967 |
1.1 |
3.3 |
1.1 |
|
|
CV |
- |
- |
61 |
59.35 |
61 |
54 |
17 |
34.92 |
37.3 |
38.5 |
37.9 |
|
*for tmax, TLIN, and LQCT, these are medians.
Table 8-F
|
Parameter Estimates for Each Subject Given the Reference Formulation |
||||||||||||
|
ID |
Seq |
Period |
REFERENCE FORMULATION |
|
||||||||
|
Cmax (ng/mL) |
tmax (h) |
AUC T (ng . h/mL) |
AUC I (ng . h/mL) |
AUC I (%) |
λ (h- 1 ) |
TLIN (h) |
LQCT (h) |
t ½ (h)A |
|
|||
|
A |
TR |
21 May |
126 |
1.50 |
375 |
418 |
90 |
0.2660 |
3.0 |
8.0 |
2.6 |
|
|
B |
RT |
14 May |
207 |
1.50 |
595 |
613 |
97 |
0.2900 |
3.0 |
12.0 |
2.4 |
|
|
C |
RT |
14 May |
123 |
1.50 |
471 |
492 |
96 |
0.2666 |
4.0 |
12.0 |
2.6 |
|
|
E |
TR |
21 May |
37 |
1.00 |
190 |
224 |
85 |
0.2653 |
3.0 |
8.0 |
2.6 |
|
|
F |
RT |
14 May |
85 |
2.00 |
257 |
285 |
90 |
0.3114 |
3.0 |
8.0 |
2.2 |
|
|
G |
TR |
21 May |
55 |
1.50 |
175 |
190 |
92 |
0.5437 |
3.0 |
6.0 |
1.3 |
|
|
H |
RT |
14 May |
219 |
1.00 |
382 |
398 |
96 |
0.4047 |
2.0 |
8.0 |
1.7 |
|
|
I |
TR |
21 May |
182 |
0.66 |
361 |
406 |
89 |
0.3837 |
3.0 |
6.0 |
1.8 |
|
|
K |
RT |
14 May |
60 |
1.50 |
218 |
236 |
93 |
0.3580 |
3.0 |
8.0 |
1.9 |
|
|
L |
TR |
21 May |
26 |
2.00 |
92 |
105 |
88 |
0.4208 |
2.0 |
6.0 |
1.6 |
|
|
M |
TR |
21 May |
57 |
1.50 |
269 |
327 |
82 |
0.1373 |
6.0 |
12.0 |
5.1 |
|
|
N |
RT |
14 May |
47 |
0.66 |
106 |
125 |
85 |
0.3246 |
2.0 |
6.0 |
2.1 |
|
|
O |
RT |
14 May |
71 |
1.50 |
290 |
313 |
03 |
0.4028 |
3.0 |
8.0 |
1.7 |
|
|
P |
TR |
21 May |
97 |
1.50 |
230 |
266 |
87 |
0.3644 |
2.0 |
6.0 |
1.9 |
|
|
Q |
RT |
14 May |
88 |
1.50 |
144 |
156 |
92 |
0.4964 |
3.0 |
6.0 |
1.4 |
|
|
R |
TR |
21 May |
99 |
2.00 |
344 |
369 |
93 |
0.2370 |
4.0 |
12.0 |
2.9 |
|
|
MEAN |
- |
- |
99 |
1.50 |
281 |
308 |
90 |
0.3420 |
3.0 |
8.0 |
2.2 |
|
|
STD |
- |
- |
59 |
0.41 |
136 |
138 |
4 |
0.1017 |
1.0 |
2.4 |
0.9 |
|
|
CV |
- |
- |
60 |
29.05 |
48 |
45 |
5 |
29.7262 |
32.6 |
29.2 |
39.4 |
|
8.5 AUCT Analysis
Tables 8-G, 8-H, and 8-I provide the complete analysis required for AUCT. Table 8-G lists the AUCT estimates on the raw scale and the log scale. Also given is the test AUCT as a percentage of the reference AUCT . Summary statistics are calculated for each variable.
Table 8-G
|
AUCT (ng·h/mL) Analysis - Data |
||||||
|
ID |
Raw Scale |
Log Scale |
|
|||
|
Test |
Reference |
Relative |
Test |
Reference |
|
|
|
A |
365 |
375 |
97 |
5.90 |
5.93 |
|
|
B |
405 |
595 |
68 |
6.00 |
6.39 |
|
|
C |
703 |
471 |
149 |
6.55 |
6.16 |
|
|
E |
233 |
190 |
123 |
5.45 |
5.25 |
|
|
F |
247 |
257 |
96 |
5.51 |
5.55 |
|
|
G |
178 |
175 |
102 |
5.18 |
5.17 |
|
|
H |
246 |
382 |
65 |
5.51 |
5.94 |
|
|
I |
408 |
361 |
113 |
6.01 |
5.89 |
|
|
K |
315 |
218 |
144 |
5.75 |
5.39 |
|
|
L |
140 |
92 |
153 |
4.94 |
4.52 |
|
|
M |
165 |
269 |
61 |
5.11 |
5.59 |
|
|
N |
88 |
106 |
83 |
4.48 |
4.66 |
|
|
O |
183 |
290 |
63 |
5.21 |
5.67 |
|
|
P |
122 |
230 |
53 |
4.81 |
5.44 |
|
|
Q |
68 |
144 |
47 |
4.22 |
4.97 |
|
|
R |
275 |
344 |
80 |
5.62 |
5.84 |
|
|
MEAN |
259 |
281 |
94 |
5.39 |
5.52 |
|
|
STD |
158 |
136 |
35 |
0.61 |
0.52 |
|
|
CV |
61 |
48 |
37 |
- |
- |
|
Table 8-H gives the analysis of variance (ANOVA) for the cross-over design model for ln(AUCT). This analysis gives the appropriate intra-subject variance estimate, MS (Residual), for the calculation of the 90% confidence interval. Any significant effects in the model, other than Subject (Seq), should be investigated. The intra-subject and inter-subject CVs should also be calculated.
Table 8-H
|
AUCT (ng·h/mL) Analysis - ANOVA for ln(AUCT) |
|||||
|
Source |
df |
SS |
MS |
F |
PR> F |
|
Seq |
1 |
0.0535 |
0.09 |
0.09 |
0.770 |
|
Subject(Seq) |
14 |
8.4375 |
0.6027 |
8.26 |
<0.001 |
|
Period |
1 |
0.0241 |
0.0241 |
0.33 |
0.574 |
|
Form |
1 |
0.1373 |
0.1373 |
1.88 |
0.192 |
|
Residual |
14 |
1.0211 |
0.0729 |
- |
- |
Intra-subject CV = 100 x (MSResidual)0.5 = 100 x (0.0729)0.5 = 27 percent
Inter-subject CV = 100 x (MSSubject (Seq) - MSResidual/2)0.5 = 100 x ((0.6027 - 0.0729)/2)0.5 = 51 percent
The AUC ratio estimate and its 90% confidence interval are derived in the calculations shown in Table 8-I. Because this study had a balanced design (i.e., an equal number of subjects per sequence) the difference is simply the difference in the arithmetic means of the ln(AUC)s. If the study was not balanced, then the least-squares mean estimate for each formulation should be used to form this difference, together with the appropriate standard error.
Table 8-I
AUCT (ng•h/mL) Analysis - Calculations
Difference = Test x − Reference x = 5.39 − 5.52 = −0.13
SEDifference = (2MSResidual/n)0.5 = (2 x 0.0729/16)0.5 = 0.0955
AUC Ratio = 100 × eDifference = 100 × e(5.39−5.52) = 88%
90% Confidence Limits
Lower,Upper = 100 × e(Difference ± t0.05,14x SEDifference)
Lower = 100 × e(−0.13 − 1.761 × 0.0955) = 74%
Upper = 100 × e(−0.13 + 1.761 × 0.0955) = 104%
8.6 Cmax Analysis
The necessary information and summary for the analyses of Cmax is shown in Table 8-J.
Table 8-J
|
Cmax (ng/mL) Analysis - Data |
||||||
|
ID |
Raw Scale |
Log Scale |
|
|||
|
Test |
Reference |
Relative |
Test |
Reference |
|
|
|
A |
122 |
126 |
97 |
4.81 |
4.84 |
|
|
B |
102 |
207 |
49 |
4.62 |
5.33 |
|
|
C |
202 |
123 |
164 |
5.31 |
4.81 |
|
|
E |
59 |
37 |
160 |
4.09 |
3.62 |
|
|
F |
66 |
85 |
78 |
4.20 |
4.44 |
|
|
G |
54 |
55 |
98 |
3.99 |
4.01 |
|
|
H |
101 |
219 |
46 |
4.61 |
5.39 |
|
|
I |
90 |
182 |
49 |
4.49 |
5.20 |
|
|
K |
155 |
60 |
259 |
5.04 |
4.09 |
|
|
L |
57 |
26 |
223 |
4.04 |
3.24 |
|
|
M |
23 |
57 |
41 |
3.14 |
4.04 |
|
|
N |
38 |
47 |
80 |
3.63 |
3.85 |
|
|
O |
43 |
71 |
61 |
3.77 |
4.26 |
|
|
P |
68 |
97 |
70 |
4.22 |
4.58 |
|
|
Q |
28 |
88 |
31 |
3.32 |
4.48 |
|
|
R |
60 |
99 |
61 |
4.10 |
4.59 |
|
|
MEAN |
79 |
99 |
98 |
4.21 |
4.42 |
|
|
STD |
48 |
59 |
68 |
0.59 |
0.61 |
|
|
CV |
61 |
60 |
69 |
- |
- |
|
Table 8-K
|
Cmax (ng/mL) Analysis - ANOVA for In(Cmax) |
|||||
|
Source |
df |
SS |
MS |
F |
PR>F |
|
Seq |
1 |
0.5352 |
0.5352 |
1.02 |
0.331 |
|
Subject(Seq) |
14 |
7.3753 |
0.5268 |
2.57 |
0.044 |
|
Period |
1 |
0.0261 |
0.0261 |
0.13 |
0.726 |
|
Form |
1 |
0.3615 |
0.3615 |
1.77 |
0.205 |
|
Residual |
14 |
2.8668 |
0.2048 |
- |
- |
Intra-subject CV = 45 percent
Inter-subject CV = 40 percent
Table 8-L
Cmax Analysis - Calculations
Difference = Test x − Reference x = 4.21 − 4.42 = −0.21
SEDifference = (2MSResidual/N)0.05 = 0.1600
Cmax Ratio = 100 × eDifference = 100 × e(4.21 − 4.42) = 81%
90% Confidence Limits
Lower,Upper = 100 × e(Difference ± t0.05,14x SEDifference)
Lower = 100 × e(−0.21 − 1.761 × 0.1600) = 61%
Upper = 100 × e(−0.21 + 1.761 × 0.1600) = 107%
8.7 AUCI Analysis
The necessary information and summary for the analyses of AUCI are shown in Tables 8-M and 8-N.
Table 8-M
|
AUCI (ng·h/mL) Analysis - Data |
||||||
|
ID |
Raw Scale |
Log Scale |
|
|||
|
Test |
Reference |
Relative |
Test |
Reference |
|
|
|
A |
409 |
418 |
98 |
6.01 |
6.04 |
|
|
B |
432 |
613 |
70 |
6.07 |
6.42 |
|
|
C |
774 |
492 |
157 |
6.65 |
6.20 |
|
|
E |
256 |
224 |
114 |
5.55 |
5.41 |
|
|
F |
265 |
285 |
93 |
5.58 |
5.65 |
|
|
G |
205 |
190 |
108 |
5.32 |
5.25 |
|
|
H |
263 |
398 |
66 |
5.57 |
5.99 |
|
|
I |
433 |
406 |
107 |
6.07 |
6.01 |
|
|
K |
372 |
236 |
157 |
5.92 |
5.46 |
|
|
L |
331 |
105 |
317 |
5.80 |
4.65 |
|
|
M |
195 |
327 |
60 |
5.27 |
5.79 |
|
|
N |
113 |
125 |
91 |
4.73 |
4.83 |
|
|
O |
215 |
313 |
68 |
5.37 |
5.75 |
|
|
P |
148 |
266 |
56 |
5.00 |
5.58 |
|
|
Q |
113 |
156 |
72 |
4.72 |
5.05 |
|
|
R |
292 |
369 |
79 |
5.68 |
5.91 |
|
|
MEAN |
301 |
308 |
107 |
5.58 |
5.62 |
|
|
STD |
164 |
138 |
64 |
0.52 |
0.49 |
|
|
CV |
54 |
45 |
60 |
- |
- |
|
Table 8-N
|
AUCI (ng·h/mL) Analysis - ANOVA for ln(AUCI) |
|||||
|
Source |
df |
SS |
MS |
F |
PR>F |
|
Seq |
1 |
0.0118 |
0.0118 |
0.03 |
0.872 |
|
Subject(Seq) |
14 |
6.1603 |
0.4400 |
4.23 |
0.005 |
|
Period |
1 |
0.0203 |
0.0203 |
0.19 |
0.666 |
|
Form |
1 |
0.0137 |
0.0137 |
0.13 |
0.723 |
|
Residual |
14 |
1.4586 |
0.1042 |
- |
- |
Intra-subject CV = 32 percent
Inter-subject CV = 41 percent
8.8 tmax (h) Analysis
The necessary information and summary for the analyses of tmax (h) are shown in Tables 8-O and 8-P.
Table 8-O
|
tmax (h) Analysis - Data |
||
|
ID |
Test tmax |
Reference tmax |
|
A |
1.50 |
1.50 |
|
B |
1.50 |
1.50 |
|
C |
0.66 |
1.50 |
|
E |
3.00 |
1.00 |
|
F |
1.00 |
2.00 |
|
G |
1.50 |
1.50 |
|
H |
1.00 |
1.00 |
|
I |
1.50 |
0.66 |
|
K |
1.50 |
1.50 |
|
L |
1.00 |
2.00 |
|
M |
4.00 |
1.50 |
|
N |
0.66 |
0.66 |
|
O |
1.00 |
1.50 |
|
P |
0.66 |
1.50 |
|
Q |
1.50 |
1.50 |
|
R |
2.00 |
2.00 |
|
MEDIAN |
1.50 |
1.50 |
|
STD |
0.89 |
0.41 |
Table 8-P
|
tmax (h) Analysis - ANOVA |
|||||
|
Source |
df |
SS |
MS |
F |
PR>F |
|
Seq |
1 |
1.4621 |
1.4621 |
3.58 |
0.079 |
|
Subject(Seq) |
14 |
5.7126 |
0.4084 |
0.92 |
0.560 |
|
Period |
1 |
1.0658 |
1.0658 |
2.41 |
0.143 |
|
Form |
1 |
0.0421 |
0.0421 |
0.09 |
0.763 |
|
Residual |
14 |
6.2006 |
0.4429 |
- |
- |
Intra-subject CV = 46 percent
Inter-subject CV = Negative Variance Component
8.9 λ(h-1) Analysis
The necessary information and summary for analyses of λ(h-1) are shown in Tables 8-Q and 8-R.
Table 8-Q
|
λ(h-1) Analysis - Data |
||
|
ID |
Test λ |
Reference λ |
|
A |
0.3002 |
0.2660 |
|
B |
0.2384 |
0.2900 |
|
C |
0.1776 |
0.2666 |
|
E |
0.3680 |
0.2653 |
|
F |
0.3902 |
0.3114 |
|
G |
0.2768 |
0.5437 |
|
H |
0.3437 |
0.4047 |
|
I |
0.2486 |
0.3837 |
|
K |
0.3379 |
0.3580 |
|
L |
0.1318 |
0.4208 |
|
M |
0.1485 |
0.1373 |
|
N |
0.2620 |
0.3246 |
|
O |
0.2671 |
0.4028 |
|
P |
0.5031 |
0.3644 |
|
Q |
0.1833 |
0.4964 |
|
R |
0.2546 |
0.2370 |
|
MEDIAN |
0.2770 |
0.3420 |
|
STD |
0.0967 |
0.1017 |
|
CV |
34.9162 |
29.7262 |
Table 8-R
|
λ(h-1) Analysis - ANOVA |
|||||
|
Source |
df |
SS |
MS |
F |
PR>F |
|
Seq |
1 |
0.0013 |
0.0013 |
0.12 |
0.736 |
|
Subject(Seq) |
14 |
0.1561 |
0.0111 |
1.13 |
0.400 |
|
Period |
1 |
0.0022 |
0.0022 |
0.23 |
0.640 |
|
Form |
1 |
0.0339 |
0.0339 |
3.47 |
0.084 |
|
Residual |
14 |
0.1368 |
0.0098 |
- |
- |
Intra-subject CV = 32 percent
Inter-subject CV = 8 percent
8.10 Calculations for AUC Ratio and Cmax Ratio Estimates Corrected for Measured Content
Tables 8-S and 8-T show the method of calculating the AUC ratio and Cmax ratio estimates and their confidence limits, based on data corrected for measured content. The whole analysis need not be repeated; but only the corrected estimates need be given.
Table 8-S
|
Estimates Based on Correction for Measured Content |
||
|
|
Test Formulation |
Reference Formulation |
|
Lot number |
EX109 |
40904 |
|
Expiry date |
06/89 |
05/89 |
|
Date of analysis |
01/04/88 |
01/04/88 |
|
Measured content |
95.4 |
99.3 |
|
Correction factors |
|
|
|
-raw scale-multiply |
1.0482 |
1.0070 |
|
-log scale-add |
0.0471 |
0.0070 |
Table 8-T
AUCRatio and Cmax Ratio - Calculations
Based on measured contents in Table 8-S, the following factor is obtained:
In (99.3 ÷ 95.4) = 0.04
which is to be added to the estimates on the ln scale.
Therefore:
AUC Ratio = e(−0.13 + 0.04) × 100% = 91%
Lower Limit = 100 × e(−0.13 + 0.04 − 1.761 × 0.0955) = 77%
Upper Limit = 100 × e(−0.13 + 0.04 + 1.761 × 0.0955) = 108%
Cmax Ratio = e(−0.21 + 0.04) = 84%
Lower Limit = 100 × e(−0.21 + 0.04 − 1.761 × 0.1600) = 64%
Upper Limit = 100 × e(−0.21 + 0.04 + 1.761 × 0.1600) = 112%
8.11 Time-Dependent Profiles (Subject A)
Figure 8.1 shows a plot of the concentration versus time profile for subject A. Each plot must include profiles for all formulations given to that subject. Similar profiles should be given for each subject.
Figure 8.1: Concentration-Time Profile for Subject A
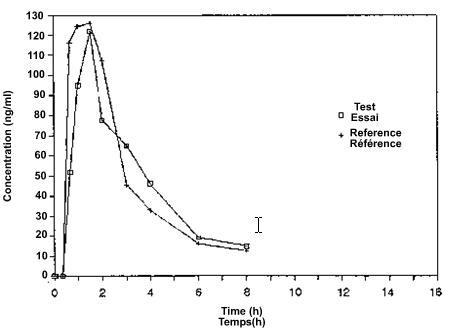
Figure 8.2 gives a plot of the In (concentration) versus time profile for subject A. This plot should contain the regression lines from which the terminal disposition rate constants (λ) were estimated. This line must start and end at the time points considered to be in the log-linear elimination phase. Any point that was not used to estimate the regression line must be identified.
Figure 8.2: Ln (concentration) - Time Profile for Subject A
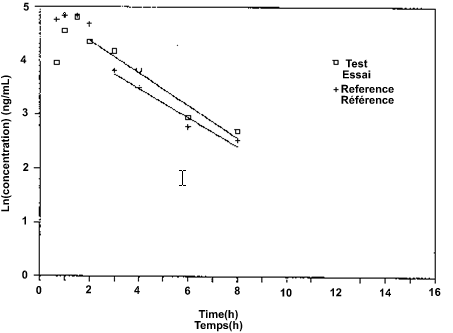
Figure 8.3 shows a profile of the arithmetic means over all subjects for each formulation and sampling time.
Figure 8.3: Average Concentration-Time Profile for All Subjects
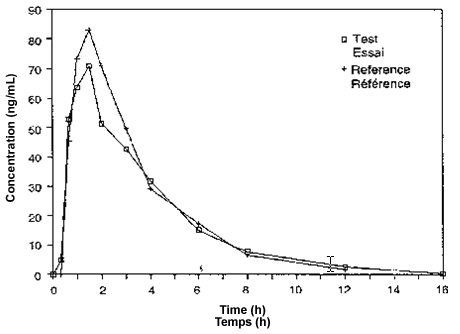
Figure 8.4 shows a profile of the In (arithmetic means) over all subjects for each formulation and sampling time.
Figure 8.4: Ln(average concentration)-Time Profile for All Subjects
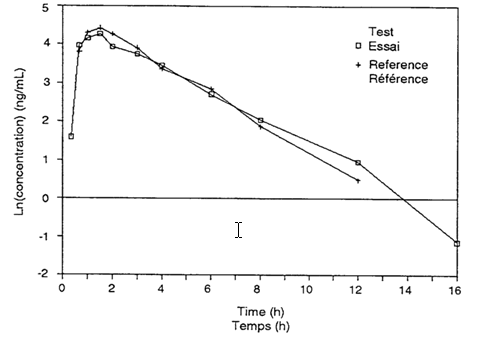
9. Glossary of Terms
Accuracy
The extent to which an experimentally determined value agrees with the true or absolute value.
Adverse Drug Reaction
An undesirable effect that is suspected to be associated with the use of a drug by a subject.
Anova Appropriate to the Design
The ANOVA (analysis of variance) selected to reflect the effects of the way in which the study was executed. For the two-period cross-over design these effects include: sequence, subject (sequence), period, formulation and the within-subject (intra-subject) error term. (See Section 7).
AUC(Area Under the Curve)
The area under the drug (or metabolite) concentration in plasma (or serum, or whole blood) versus time curve. The AUC symbol may be qualified by a specific time (e.g., 8 hours, or AUC8), time of last quantifiable concentration (AUCT ), or infinity (AUCI ).
AUCI(AUC to Infinity)
The area obtained by extrapolating to infinity the AUCT . This can be calculated by adding CT/λ to AUCT where CT is the estimated last quantifiable concentration and λ is the terminal disposition rate constant.
AUCratio
The ratio of geometric means of the test and reference AUCs. It is calculated as the antilogarithm of the difference between the means of the logarithms (ln) of the test and reference AUCs. The Cmax ratio should be similarly calculated. (See Section 8).
AUCT(AUC to the Last Quantifiable Concentration)
This describes the AUC to the time of the last quantifiable concentration. AUCT is calculated from observed data at specific time points by the linear trapezoidal rule.
Balanced Cross-over Design
A cross-over design in which subjects are randomly assigned into each sequence in equal numbers.
Bioavailability
The rate and extent of absorption of a drug into the systemic circulation.
Bioequivalence
A high degree of similarity in the bioavailabilities of two pharmaceutical products (of the same galenic form) from the same molar dose, that are unlikely to produce clinically relevant differences in therapeutic effects, or adverse effects, or both.
Bioequivalent means that test and reference products containing an identical drug or drugs, after comparison in an appropriate bioavailability study, were found to meet the standards for rate and extent of absorption specified in these guidances.
Cmax (Maximum Observed Concentration)
The observed maximum or peak concentration of drug (or metabolite) in plasma (or serum, or whole blood).
CT (Last Quantifiable Concentration)
The last concentration of the drug (or metabolite) profile in plasma (or serum, or blood) that can be quantified and is equal to or greater than the lowest limit of quantitation.
Excipient
Any ingredient, excluding the drug substances, incorporated in a formulation for the purpose of enhancing stability, usefulness or elegance, or facilitating preparation; for example, base, carrier, coating, colour, flavour, preservative, stabilizer, and vehicle.
First-pass (or Pre-systemic) Metabolism
The metabolism of an orally administered drug occurring during its first-pass through certain metabolizing organs, before reaching the systemic circulation. Although the major site of first-pass metabolism is the liver, it may also occur in the intestine or portal blood owing to the presence of enzymes (e.g., esterases). First-pass metabolism is usually assessed by comparing areas under the curve obtained following the oral and intravenous doses of the drug.
Formulation
An ingredient or mixture of specific ingredients; that is, drug substances and excipients in specific amounts, defining a given product.
Genetic Phenotype
A category or group to which a person may be assigned on the basis of differences in drug metabolism attributable to genetic characteristics (e.g., slow or fast metaboliser).
Label
Includes any legend, word, or mark attached to, included in, belonging to, or accompanying any drug or package. (Section 2 of the Food and Drugs Act.)
Last Quantifiable Concentration (CT)
See CT.
Lowest Limit of Detection (LOD)
The lowest concentration that can be differentiated from background levels.
Lowest Limit of Quantitation (LOQ)
The lowest measured concentration on the standard curve having an acceptable degree of precision. The LOQ cannot be below the lowest nominal concentration on the same standard curve.
Maximum Observed Concentration (Cmax )
See Cmax .
Measured Content of The Drug Product
The drug contents of representative samples (i.e., the lots used in the bioavailability/bioequivalence study) of the test and reference drug products established as percent label claim by an appropriate assay, such as USP.
Modified - Release Dosage Form
A dosage form for which the drug-release characteristics of time-course or drug-release location are chosen to accomplish therapeutic or convenience objectives not offered by conventional dosage forms.
MRC
Medical Research Council.
90% Confidence Interval
An interval about the estimated value that provides 90 percent assurance that it contains the true value. The method of constructing the interval is described in( Section 8, "Sample Analysis for a Comparative Bioavailability Study").
Non-linear Kinetics
A general term referring to dose or time dependency in pharmacokinetic parameters arising from factors associated with absorption, first-pass metabolism, binding, and excretion.
Precision
The closeness of agreement of values obtained in the analysis of replicate samples of the same specimen, usually indicated by the coefficient of variation (relative standard deviation).
Pro-drug
An inactive (or much less active) precursor that is bio-transformed to the active drug.
Rate of Absorption
The rate at which a drug reaches the systemic circulation after oral administration.
Standard Meal
A meal of known and fixed caloric content and carbohydrate, protein, fat, and fluid composition.
Suitability of Facilities
The physical plant and capability of a facility involved in experiments with human subjects or in the analysis of biological samples. Facilities should conform to requirements for Good Clinical Practice or Good Laboratory Practice.
Terminal Disposition Rate Constant (λ)
The rate constant estimated from the slope of the terminal portion of the In (drug concentration) versus time curve. The terminal half-life (t½) is calculated from this constant (t½=ln2/λ). (Also known as Terminal Elimination Rate Constant.)
Terminal Half-life
See Terminal Disposition Rate Constant (λ).
Terminal Elimination Rate Constant
See Terminal Disposition Rate Constant (λ).
Therapeutic Equivalence
Therapeutic equivalence means that a chemical equivalent of a drug product (i.e., containing the same amount of the same drug in the same dosage form) when administered to the same individuals in the same dosage regimen will provide essentially the same efficacy and toxicity.
Time of Maximum Observed Concentration) (tmax)
The time after administration of the drug at which Cmax is observed.
References:
1. Canadian Health protection branch (HPB) (2009) Guideline on conduct and analysis of comparative bioavailability studies.
2. Chineses Pharmacopoeia (2000) Edition 2. Drug Bioavailability and Bioequivalence testing guidance principle, Appendix 193-197.
3. CPMP guideline of TGA on the investigator of bioavailability and bioequivalence-CPMP/EWP/QWP/1401/98.
4. Diletti E, Hauschke D, Steinijans VW (1991) Sample size determination for Bioequivalence assessment by means of confidance intervals. Int J Clin Pharmacol Ther Toxicol, 29: 1-8.
5. European Medicines Agency-Doc Ref: EMEA/CHMP/EWP/200943/2007.
6. European Medicines Agency-Doc Ref: EMEA/CHMP/EWP/40326/2006.
7. Guidance document for Bioequivalence study of Korea Food and drug administration Notification 2008 -22 (May 07, 2008).
8. Guidance for industry Bioavailability and Bioequivalence studies for Orally administered drug products-General considerations, U.S. department of Health and Human services, food and drug administration, center for drug evaluation and research. (CDER), March 2003, BP
9. Guidance for industry, food effect/fed BE studies, U.S. Department of Health and Human services, food and drug administration, center for drug evaluation and research., Dec-2002, BP.
10. Guidance for medication interchangeability of Mexican official journal (1999) section 1: 45-68.
11. Guideline for Bioequivalence studies of Generic products (2000) National Institute of Health Sciences Japan NIHS.
12. Guideline of medicice control council on registration of medicine, version 3 Jun 2010.
13. Interchangeable multisourcepharmaceutical products. WHO draft guidance on marketing authorization requirments, December 1993.
14. MHW guideline for bioequivalent studies of generic products, Dec 1997.
15. Rani S, Pargal A (2004): An overview of stastical concepts. Indian J Pharmacol 36: 209-216.
16. Saudi food and drug administration drug authority sector Bioequivalence requirments guidelines, (2005).
17. Schuirmann DJ (1987) A comparision of the two one sided test procedures and the power approach for assessing the bioequivalence of average bioavailability. J pharmacokinet Biopharm 15: 657-680.
18. Stastical Approaches to Establish Bioequivalence US Food and drug administration center for evaluation and drug research FDA, (2001).
19. The European agency for the evaluation of medicinal products-CPMP/EWP/QWP/1401/98 Rev. 1/ Corr*
20. fda.gov/downloads/Drugs/GuidanceComplianceRegulatoryInformation/Guidances/ucm070111.pdf, accessed on 15/03/11 at 3:00 pm
21. bebac.at/Guidelines.htm, accessed on 15/03/11 at 4:00 pm
22. https://www.fda.gov/OHRMS/DOCKETS/98fr/3657gd2.pdf, accessed on 15/03/11 at 4:30 pm
23. equilab.wordpress.com/category/bioequivalence-study-babe, accessed on 16/03/11 at 2:00 pm
24. scribd.com/doc/4204778/Bioavailability-and-Bioequivalence-An-FDA-Regulatory-Overview, accessed on 16/03/11 at 3:00 pm
25. clinicalresearchsociety.org/babe-studies/guidelines-for-ba-be-studies, accessed on 16/03/11 at 4:00 pm
26. ecronacunova.com/pdf/ebrochures/BABE_E_Brochure.pdf, accessed on 16/03/11 at 11:00 pm
27. whoguideline.blogspot.com/2010/07/how-to-design bioequivalence-be-studies.html, accessed on 22/03/11 at 3:00 pm
28. firstclinical.com/regdocs/doc/?db=FDA_1572_FAQ, accessed on 23/03/11 at 4:00 pm
29. bebac.at/lectures/LJ2010-PCWS3.pdf, accessed on 25/03/11 at 3:30 pm


