About Authors:
Ujjwal S. Yeotkar*, Mahendra Nimbhorkar, Tushar A. Deshmukh, Vijay R. Patil
Department of Pharmacognosy,
Tapi Valley Education Society’s,
Hon’ble, Loksevak Madhukarrao Chaudhari College of Pharmacy,
North Maharashtra University,
Faizpur- 425 503,
Maharashtra, India.
ABSTRACT
Churna are important group of formulation used by Ayurvedic physicians to treat various types of diasease. Trikatu and Pimpali churna, as per Ayurvedic literature is used for the treatment of resperatory disorders. In the present study,an attempt has been made to develop a HPTLC method of quantitative estimation of marker compound, piperine in laboratory prepared authentic formulation and a marketed formulation of Trikatu and Pimpali churna. The stationary phase used was precoated silica gel G 60 F 254 plates. The mobile phase containing n- Hexane-ethyl acetate, (5:5 v/v ), was used to separate the spot of Piperine. Plates were developed to a distance of 8 cm at room temperature. Spectrodensitometric scanning was performed by TLC scanner III (CAMAG) in absorbance mode at the wavelength of 339nm. The Rf values of piperine was 0.44± 0.02. The method was validated in terms of Linearity, Accuracy and Precision. The linearity curve found to be linear in between 200–900 ng/spot. The limit of Detection (LOD) and limit of Quantification (LOQ) were found to be 1 ng and 3 ng respectively. The mean results from % Recovery was found to be, laboratory formulation contain 85.13% and 83.47% while the commercial formulation shows 96.65%, and 90.32% respectively. The proposed method can be used to determine Piperine from Ayurvedic formulations.
[adsense:336x280:8701650588]
Reference Id: PHARMATUTOR-ART-1224
INTRODUCTION:
The increasing demand for herbal medicines invitably led to the issue of obtaining and maintaining their quality. As a result, there has been a tremendous quality consciousness for the herbal formulations in countries like USA, member countries of European Union, China and Austria etc1 .Unfortunately, however in our country; the concept of quality did not get much attention. In this communication, an attempt has been made to review the current status of standardization of herbal products with special reference to marketed herbal formulation analysis.
The selected marketed herbal formulation is a Trikatu churna which contains, Piper longum, Piper nigrum, and Zingiber officinalis, and Pimpali choorna which contain Piper longum. Pipli (Piper longum) is a pungent alkaloidal drug; well known for its bioavailability enhancing properties 2,3. The objective of the present work was to develop an accurate, specific and reproducible method for the estimation of Piperine from Ayurvedic formulations.
MATERIALS AND METHODS:
Equipment: A Camag HPTLC system comprising of Linomat V automatic sample applicator, Hamilton Syringe, Camag TLC Scanner-3, Camag Win CAT software, Camag Twin trough chamber was used, for the present study.
Chemicals:StandardPiperine was purchased from Total herbs solutions Pvt. Ltd. (Mumbai, India). Analytical grade reagents; n-hexane, ethyl acetate, acetone, formic acid and methanol (Merck Chemicals, India) were used. Stationary phase used wasSilica gels G60F254, 20x10 cm TLC plate were obtained from E. Merck Ltd (Mumbai, India).
Drugs: Pippali (Piper longum), kalimirch (Piper nigrum) and sunth (Zingiber officinalis) were collected from the local market and authenticated by the Department of Botany, Rashtrasant Tukdoji Maharaja, Nagpur University, Nagpur. Ayurvedic formulations such as Trikatu churna from Ritesh Pharmaceutical, Vadodara, Gujarat and Pimpali choorna from Aushadhi bhavan, Ayurved seva sangh, Panchavati, Nashik were procured from the local market.
Preparation of Trikatu and Pimpali churna
Trikatu and Pimpali churna were prepared in the laboratory as per the formulation given in the “Ayurvedic Formulary of India”. The individual drugs were powdered separately and sieved through a fine mesh. Then the required quantities by weight were taken and thoroughly mixed to uniformity.
HPTLC method for estimation of Piperine
Preparation of standardpiperine solution
A stock solution of piperine, 1 mg/ml was prepared by dissolving 10mg of accurately weighed piperine in methanol and making up the volume to 10 ml in amber coloured volumetric flask covered with aluminium foil, because piperine in solution isomerizes to isopiperine, chavicine and isochavicine on exposure to light 4. The stock solution was further diluted with methanol to yield a concentration of 100µg/ml.
Preparation of Sample solution
The laboratory formulation samples and the commercial formulation samples (1gm each) of Trikatu churna and Pimpali choorna were extracted using maceration process in 10ml methanol. This extract is filtered through a whatmann filter paper no.1 and the filtrate collected in a 100 cm3 volumetric flask, and then sonicated the solution. The contends are diluted to volume with methanol, this solution gives the final concentration of 20 mg/ml.
Chromatographic conditions
Stationary phase: HPTLC precoated, silica gel G60, F254 (Merck)
Thickness: 0.2 mm
Mode of application: Band
Band width: 8mm
Separation technique: Ascending
Temperature: 25 ± 3°
Saturation time: 15 min with plate
Migration distance: 80 mm
Wavelength: 339 nm (CAMAG 3 Scanner)
Preparation of Mobile Phase
Mobile Phase was prepared by mixing n- hexane and ethyl acetate in the proportion of 05:05 v/v.
Calibration Curve
Standard solution of Piperine concentration of 100 µg mL-1 prepared and was applied duplicate in 1μL,2μL, 3μL, 4μL, 5μL, 6μL,7μL, 8μL, 9μL, 10μL over the silica gel G60F 254 plate. The plate was developed and analyzed as described earlier.The plate was then developed using the optimized mobile phase and the peak areas were plotted against the corresponding concentrations to obtain the calibration curves.
Validation of method:
The developed method was validated in terms of Linearity, Accuracy, and precision, Limit of detection, Limit of quantification, robustness and ruggedness5, 6.
[adsense:468x15:2204050025]
RESULTS AND DISCUSSION
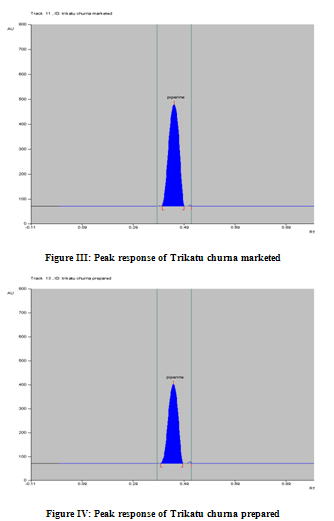
The solvent system of n- hexane: ethyl acetate (05:05 v/v) was found to be ideal mobile phase for separation of piperine. Standard piperine showed single peak in HPTLC chromatogram (Figure II). Sample and Standard solution applied in various volumes (Table I). Calibration curve of piperine was prepared by plotting concentration of piperine versus average area of the peak. The methanol extract of formulations shows more number of peaks.The difference of % it may be due to varied factors like drug variety, geographical variation, and age of the plant at the plant at the time of harvest, genetic and environmental factors.
Table I: Application volume for Piperine
|
Sr. no |
Sample |
Application volume (µl) |
|
1 |
Piperine |
1-10 |
|
2 |
Trikatu churna marketed |
6 |
|
3 |
Trikatu churna prepared |
6 |
|
4 |
Pimpali choorna marketed |
6 |
|
5 |
Pimpali choorna prepared |
6 |
Quantitative Estimation
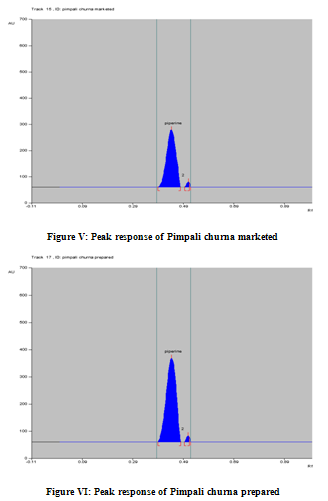
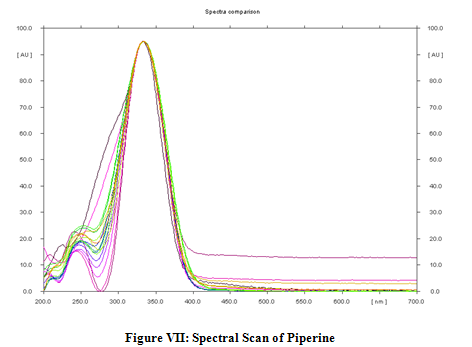
In the chromatogram of the drugs extracted from the churna, many well resolved spots were observed, out of these spots one spot was matches with the Rf value (0.44± 0.02) shown by Standard Piperine and having the same lambda max (339 nm) (Figure II – VI). The drug content as per label claim of laboratory formulation was found to contain 4.23%, 4.15% of piperine. A while the commercial formulation shows 4.8%, 4.49% of piperine in methanol extracts with% Residual Standard Deviation (R.S.D) is 0.183, 1.083 and 0.948, 1.499. The low %R.S.D values as shown in (Table-III) indicated the suitability of this method for routine analysis of Piperine in Ayurvedic formulations.
NOW YOU CAN ALSO PUBLISH YOUR ARTICLE ONLINE.
SUBMIT YOUR ARTICLE/PROJECT AT articles@pharmatutor.org
Subscribe to Pharmatutor Alerts by Email
FIND OUT MORE ARTICLES AT OUR DATABASE
VALIDATION
Calibration Curves
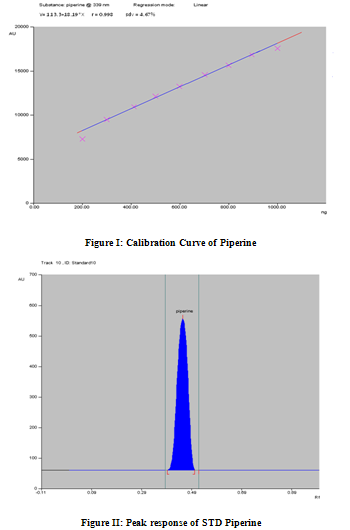
Calibration graph was found to be linear over the concentration range 200-900 ng/spots. The peak area and concentration was subjected to least square linear regression analysis to calculate the calibration equation Y=113.03+18.19X andregression coefficient (r2) was 0.998 and S.D. was found 4.67 (figure I). Response obtained for piperine in preparation of calibration curve (Table II).
Linearity
A representative calibration curve of piperine was obtained by plotting the peak area of piperine against the concentration of piperine (200- 900ng) respectively. The correlation coefficient for piperine was found to be 0.998 respectively and thus exhibits good linearity between concentration and area.
Accuracy (Recovery Studies)
To study accuracy of the developed method, recovery studies were carried out using standard addition method at three different level and the % recoveries were calculated.The average % recovery of laboratory formulation was found to be 85.13%, 83.47% and commercial formulation was found to be 96.65%, 90.32% which are satisfactory.(Table III).
Specificity
It was observed that other constituents present in the formulations did not interfere either with the peak of piperine. Therefore the method was specific. The spectrum of standard piperine and piperine a present in the samples were found to be similar or overlap. (Figure VII)
Precision
The repeatability of sample application and measurement of peak area were expressed in terms of % R.S.D. Precision studies were carried out by using the sample solution. Six spots of 6 μL of sample solution were applied on the plate & the plate was scanned 339nm after development. The amount of Piperine present in per track were calculatedby using regression equations Y=113.3+18.19X. The results were revealed that the % R.S.D. was found to be < 2% i.e. 0.164 (Table IV).
Limit of Detection (LOD) and Limit of Quantification (LOQ)
LOD is the amount of applied sample producing the peak area which is equal to the sum of the mean blank area and three times of its standard deviation.LOQ is the amount of applied sample producing the peak area which is equal to the sum of the mean blank area and ten times of its standard deviation. The LOD and LOQ were found to be 1ng and 3ng (Table V).
3.2.5 Ruggedness and Robustness
The study of ruggedness & Robustness was carried out by keeping all the parameters constant except for the time, day and analysts. The results were shown in (Table VI). All the Validation study data were shown in (Table VII)
Conclusion
The proposed HPTLC method was found to be rapid, simple and accurate for quantitative estimation of Piperine in different formulation extracts. The % recovery values of piperine was found to be 96.65% and 90.47% respectively, which shows the reliability and suitability of the method. The standard deviation and coefficient of variation were 4.67 and 0.998 respectively.Thus proving the accuracy and precision of the analysis. The method was found to be useful in detecting the genuiness of the formulation and thus suitable to evaluate various formulations available in the market. The proposed solvent system and the scanning wavelength found suitable to identify and estimate piperine respectively.
References
1. Dobrial RM and Narayana DB. Eastern Pharmacist. 1998; 4: 31.
2. Mukherjee PK. Quality Control of Herbal Drugs. Horizons Pharmaceutical Publisher 1st edition. 2002. 185-245,755-757,767-769.
3. Wealth of India. Raw Materials and Cumulative Index. Council of Scientific and Industrial Research. New Delhi. 2003. vol.-XI: Ph-Re. 83-118.
4. Agrawal SS and Pardhavi M. Herbal Drug Technology. Universities press. Hyderabad.2007.361-363.
5. ICH guidelines Q2A, Text on Validation of Analytical Procedures: Methodology, Harmonized Tripartite Guideline prepared within the International Conference on Harmonization of Technical Requirements for the Registration of Pharmaceuticals for Human Use. Geneva.1996.1-13.
6. Sethi PD. High Performance Thin Layer Chromatography. Quantitative Analysis of Pharmaceutical Formulations. New Delhi.1996.61.
Table II: Responses Obtained for STD Piperine in Preparation of Calibration Curve
|
Track |
Volume (µl) |
Concentration (ng/spot) |
Rf |
Average Area* |
Sdv |
% RSD |
|
1 |
1 |
100 |
0.48 |
1280.46 |
0.98 |
0.0765 |
|
2 |
2 |
200 |
0.45 |
3490.19 |
1.37 |
0.0362 |
|
3 |
3 |
300 |
0.43 |
5540.30 |
0.85 |
0.0153 |
|
4 |
4 |
400 |
0.43 |
7360.25 |
0.03 |
0.0004 |
|
5 |
5 |
500 |
0.43 |
9090.72 |
1.15 |
0.0127 |
|
6 |
6 |
600 |
0.44 |
10910.99 |
0.65 |
0.006 |
|
7 |
7 |
700 |
0.44 |
12730.92 |
1.41 |
0.0110 |
|
8 |
8 |
800 |
0.44 |
14460.85 |
1.56 |
0.0108 |
|
9 |
9 |
900 |
0.44 |
16450.21 |
2.69 |
0.0164 |
|
10 |
10 |
1000 |
0.47 |
17600.29 |
4.53 |
0.0257 |
* Average of two determinations
Table III: Result and statistical data for recovery study of piperine
|
Herbal Formulation |
Amount of sample taken [mg] A |
Amount of Piperine present in (A) [ng] B |
Amount of Piperine added to (A) [ng] C |
Total Piperine taken (B+C) [ng] D |
Total Piperine found [ng] E |
% Recovery E/Dx100 (mean) |
|
Trikatu churna marketed
|
20 |
600 |
360 |
960 |
926.74 |
96.65 |
|
20 |
600 |
600 |
1200 |
1159.98 |
||
|
20 |
600 |
840 |
1440 |
1393.25 |
||
|
Trikatu churna prepared
|
20 |
600 |
360 |
960 |
816.09 |
85.13 |
|
20 |
600 |
600 |
1200 |
1021.67 |
||
|
20 |
600 |
840 |
1440 |
1227.25 |
||
|
Pimpali choorna marketed |
20 |
600 |
360 |
960 |
865.99 |
90.32 |
|
20 |
600 |
600 |
1200 |
1084.05 |
||
|
20 |
600 |
840 |
1440 |
1302.11 |
||
|
Pimpali choorna prepared |
20 |
600 |
360 |
960 |
800.16 |
83.47 |
|
20 |
600 |
600 |
1200 |
1001.76 |
||
|
20 |
600 |
840 |
1440 |
1203.36 |
Table IV: Statistical data for precision study of piperine
|
Component
|
Amount Present (μl) |
Amount Found* (%) |
Sdv |
% R.S.D. |
|
Piperine |
6 |
99.73 |
0.164 |
0.164 |
* Average of Six determinations
Table V: Statistical data of LOD & LOQ
|
Sample |
Limit of Detection (ng) |
Limit of Quantification (ng) |
|
Piperine |
1 |
3 |
Table VI: Different parameters of ruggedness & robustness
|
Sr. no. |
Parameter |
Initial condition |
Changed condition |
Effect |
|
1 |
Mobile Phase composition |
n- Hexane : Ethyl acetate (5:5) |
n- Hexane : Ethyl acetate (5:6) |
Rf increased but no effect on resolution. |
|
2 |
Development Distance |
8 cm |
6 cm |
No effect on resolution. |
|
3 |
Temperature |
25 |
40 |
Number of bands increased. Rf of components increased. |
|
4 |
Tank Saturation Time |
15 min. |
30 min. |
Plate develops slowly. |
|
5 |
Extracting solvent |
Methanol |
chloroform |
No effect on resolution. |
|
6 |
Analyst |
Ujjwal |
Sharada |
No effect on resolution. |
|
Sample |
Initial % |
AVG (A) |
% in changed condition |
AVG (B) |
AVG (A and B) |
SDV ( A and B ) |
RSD |
|
Piperine |
0.98935 |
0.9913 |
0.99123 |
0.98835 |
0.98983 |
0.002086 |
0.211 |
|
0.99325 |
0.98546 |
Table VII: Validation study data of Piperine
|
Parameter |
Piperine |
|
Linearity range |
200-900ng |
|
Correlation coefficients |
0.998 |
|
Accuracy(mean recovery) |
96.65%, 90.32%, 85.13%, 83.47% |
|
Precision (RSD) |
0.164 |
|
LOD |
1ng |
|
LOQ |
3ng |
|
Ruggedness/Robustness(RSD between two experiments |
0.211 |