

{ DOWNLOAD AS PDF }
ABOUT AUTHORS:
Kotecha B*, Pambhar M, Zala G, Faldu S
Department of Quality assurance, Smt. R.D. Gardi B.Pharmacy College,
Nyara, Rajkot-360 110, Gujarat, India
kotecha_bijal29@yahoo.com
ABSTRACTS:
The present manuscript describe simple, sensitive, rapid, accurate, precise and economical q-absorbance method for the simultaneous determination of Amlodipine besylate and Candesartan cilexetil in synthetic mixture. Absorbance ratio method uses the ratio of absorbance at two selected wavelengths, one which is an Isoabsorptive point at 242 nm in Methanol. The second wavelength is used 255 nm, which is λmax of Candesartan cilexetil in Methanol. The linearity was obtained in the concentration range of 5-25 μg/mlof both drugs. The concentration of drugs was determined by using ratio of absorbance at isoabsorptive point and at the λ-max of Candesartan cilexetil. The method was successfully applied to pharmaceutical dosage form because of no interference. The result of analysis has been validated by recovery studies.
INTRODUCTION: [3, 11, 12, 14, 15, 16, 19]
Amlodipine besylate (AB) (fig. 1a) is the besylate salt of amlodipine, chemically known as, 2-[(2-aminoethoxy)methyl]-4-(2-chlorophenyl)-1,4-dihydro-6-methyl3,5pyridinedicarboxylic acid3-ethyl, 5-methyl ester (±) monobenzenesulfonate[1]. It is a long-acting, calcium channel blocker. It is used in the treatment of hypertension and anginal [12, 16]. Candesartan cilexetil a potent [4], orally active and selective angiotensin II type 1 receptor blocker, belongs to benzimidazole class with chemical name1-[[(cyclohexyloxy) carbonyl] oxy] ethyl2-ethoxy-1-[[2'(1H-tetrazol-5-yl) [1, 1'-biphenyl]-4yl] methyl]-1H-benzimidazole-7-carboxylate1-3. It is an anti hypertensive drug and is used in treatment of angina. AB is official in USP, BP, EP & IP whereas CC is official in JP [14, 15, and 19]. The chemical structures of AB & CC are shown in Fig. 1.Combination drug products of AB and CC are widely marketed and used in the treatment of hypertension and cardiac disorders [12, 16]. Several analytical methods like UV spectrophotometry, HPLC, HPTLC, UPLC have been reported for estimation of AB & CC by single drug and also by combining with other drugs [9, 10, 17, 20, 23, 25, and 26]. However no method has been reported till date for the simultaneous estimation of AB & CC using the UV spectrophotometric method. The present paper describes the development and validation of two analytical methods for simultaneous estimation of AB & CC by UV spectrophotometry in tablet dosage form; the methods include absorbance ratio method. The proposed methods are optimized and validated as per the ICH guidelines [6].
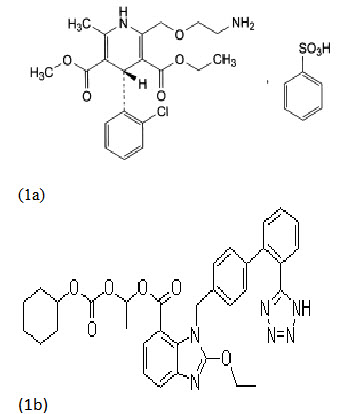
Fig. 1 Chemical structures of the analytes (1a) AB & (1b) CC [3, 11]
MATERIALS AND METHODS
SITE OF EXPERIMENTATION: Smt. R. D. Gardi B. Pharmacy College, Nyara, Rajkot
INSTRUMENTATION:UV visible spectrophotometer Helios Alpha, Thermo Scientific, (model UV A 1002E) with 1 cm matched quartz cells were used for all absorbance measurements. Contech, EIE instrument pvt. Ltd. (model CA 34) balance was used for weighing the samples.
REAGENTS: Double distilled water and Whatmann filter paper (0.45μm) were used for filtration. Active pharmaceutical ingredient (API) working standards of amlodipine besylate (AB), candesartan cilexetil (CC) were obtained as gift sample from Alembic Pharma limited, Baroda, India and test samples (tablets with composition CC-8 mg and AB (equivalent to amlodipine-5 mg) were procured from the local market.
CHEMICAL: Methanol obtained from Chemdyes co. Rajkot.
FOR Q-ABSORPTION RATIO METHOD [2, 5, 8, 13]
Mode: Scan
Scan speed: Intelli scan
Wavelength range: 200 - 400 nm
Absorbance scale: 0.00 - 2.00 A
Initial base line correction: Methanol [27]
PREPARATION OF STANDARD SOLUTION IN METHANOL
(A)Amlodipine besylate standard stock solution: (1000 μg/ml)
A 100 mg of Amlodipine besylate was weighed and transferred to a 100 ml volumetric flask. Mix with half quantity of Methanol and volume was made up to the mark.
Amlodipine besylate working standard solution: (100 μg/ml)
Pipette out 10 ml from the standard stock solution in other 100 ml volumetric flask and volume was made up to the mark with Methanol.
(B)Candesartan cilexetil standard stock solution: (1000 μg/ml)
A 100 mg of Candesartan cilexetil was weighed and transferred to a 100 ml volumetric flask. Mix with half quantity of Methanol and volume was made up to the mark.
Candesartan cilexetil working standard solution: (100 μg/ml)
Pipette out 10 ml from the standard stock solution in other 100 ml volumetric flask and volume was made up to the mark with Methanol.
PREPARATION OF SYNTHETIC MIXTURE [21, 22, 28]
The synthetic mixture of Candesartan cilexetil and Amlodipine besylate was prepared in ratio of 8:5. Accurately weighed 8 mg of Candesartan cilexetil and 5 mg of Amlodipine besylate were transferred to 100 ml volumetric flask, and 70 ml of Methanol was added. Excipients, such as Mannitol, glycerol, povidone, Mg-stearate and corn starch which were used in tablet formulation, were added in this mixture and mechanically stirred for 20 minutes. This solution was filtered through the Whatmann filter paper No. 41 and filtrate was collected. Residues were washed with Methanol. The volume of filtrate and washing was combined and volume was made up to 100 ml with Methanol.
PROCEDURE FOR DETERMINATION OF WAVELENGTH FOR MEASUREMENT
1.5 ml of working standard stock solution of AB (100 μg/ml) and 1.5 ml of working standard stock solution of CC (100 μg/ml) were pipetted out into two separate 10 ml volumetric flask and volume was adjusted to the mark with Methanol to get 15 μg/ml of AB and 15 μg/ml of CC. Each solution was scanned between 200 - 400 nm against Methanol as a reagent blank. Isoabsorptive point was selected from the overlay spectra of AB and CC.
PREPARATION OF CALIBRATION CURVE
(A) Calibration curve for AB
Calibration curve for AB consists of different concentrations of standard AB solution ranging from 5 - 25 μg/ml. The solutions were prepared by pipetting out 0.5, 1, 1.5, 2.0, and 2.5 ml of the working standard solution of AB (100 μg/ml) into series of 10 ml volumetric flasks and the volume was adjusted to mark with Methanol. The absorbance of the solutions was measured at 242 nm (λ1) and 255 nm (λ2) against Methanol as a reagent blank. Calibration curve was plotted at both wavelengths and two equations were constructed using the absorptivity.
(B) Calibration curve for CC
Calibration curve for PAM consisted of different concentrations of standard CC solution ranging from 5 - 25 μg/ml. The solutions were prepared by pipetting out 0.5, 1.0, 1.5, 2.0, and 2.5 ml of the working standard solution of CC (100 μg/ml) into series of 10 ml volumetric flasks and the volume was adjusted to mark with Methanol. The absorbance of the solutions was measured at 242 nm (λ1) and 255 nm (λ2) against Methanol as a reagent blank. Calibration curve was plotted at both wavelengths and two equations were constructed using the absorptivity.
VALIDATION OF PROPOSED METHOD [6]
Parameters to be considered for the validation of method are:
A) Linearity and Range
The linearity response was determined by analyzing 6 independent levels of calibration curve in the range of 5 - 25 μg/ml and 5 - 25 μg/ml for AB and CC respectively (n = 3).
The calibration curve of absorbance vs. respective concentration was plotted and correlation coefficient (r2) and regression line equations for AB and CC were calculated.
B) Precision
I) Repeatability
Aliquots of 1.5 ml of working standard solution of AB (100 μg/ml) were transferred to a series of 10 ml volumetric flask. Aliquots of 2.0 of working standard solution of CC (100 μg/ml) were respectively transferred to the same above series of 10 ml volumetric flask. The volume was adjusted up to mark with Methanol to get 15 μg/ml solution of AB and 20 μg/ml solution of CC. The absorbance of solutions was measured spectrophotometrically three times and coefficient of variance (% C.V.) was calculated.
II) Intraday precision
Aliquots of 0.5, 1, and 1.5 ml of working standard solution of AB (100 μg/ml) were transferred to a series of 10 ml volumetric flask. Aliquots of 0.5, 1.0, and 1.5 ml of working standard solution of CC (100 μg/ml) were respectively transferred to the same above series of 10 ml volumetric flask. The volume was adjusted up to mark with Methanol to get 5, 10 and 15 μg/ml solution of AB and 5, 10, and 20 μg/ml solution of CC.
The absorbance of solutions was measured spectrophotometrically three times and coefficient of variance (% C.V.) was calculated.
C) Accuracy
Procedure
I) Preparation of Sample Solution for AB:
Synthetic mixture X: AB (50 μg/ml) + CC (80 μg/ml)
Standard solution Y: AB (100 μg/ml)
|
Sr. No. |
Step 1 |
Step 2 (diluents as methanol) |
Total AB Conc.(μg/ml) |
|
1. |
0.5 ml of solution y |
Add diluents make up to 10ml |
5 |
|
2. |
0.5 ml soln y + 0.8 ml of soinx |
Add diluents make up to 10ml |
9 |
|
3. |
0.5 ml soln y + 1 ml of soinx |
Add diluents make up to 10ml |
10 |
|
4. |
0.5 ml soln y + 1.2 ml of soinx |
Add diluents make up to 10ml |
11 |
II) Preparation of sample solution for CC:
Synthetic mixture X: AB (50 μg/ml) + CC (80 μg/ml)
Standard solution Y: CC (100 μg/ml)
|
Sr. No. |
Step 1 |
Step 2 |
Total CC Con. (μg/ml) |
|
1. |
0.8 ml soln y |
Add diluents make up to 10ml |
8 |
|
2. |
0.8 ml soln y + 0.8 ml of soinx |
Add diluents make up to 10ml |
14.4 |
|
3. |
0.8 ml soln y + 1 ml of soinx |
Add diluents make up to 10ml |
16 |
|
4. |
0.8 ml soln y + 1.2 ml of soinx |
Add diluents make up to 10ml |
17.6 |
Each solution was scanned between 200 to 400 nm against Methanol as a blank.
Absorbance of solutions was measured at selected wavelengths for AB and CC.
The amount of AB and CC was calculated at each level (80%, 100%, 120%) and % recoveries were computed.
D) LOD and LOQ [5]
The LOD (Limit of Detection) and LOQ (Limit of Quantitation) was estimated from the set of three calibration curves used to determine method linearity. The LOD and LOQ was calculated as,
LOD = 3.3 * SD
-------------
Slope
LOQ = 10 * SD
----------
Slope
Where,
S.D. = Standard deviation of the Y- intercepts of the 3 calibration curves
Slope = Mean slope of the 3 calibration curves
DRUG – EXCIPIENTS INTERACTION STUDY [21, 22, 28]:
Drug – excipients interaction study was performed by accuracy study. First prepare synthetic mixture without excipient was prepared as per dosage form ratio and % recovery was calculated. Then synthetic mixture was prepared by using common excipients present in marketed formulation. In synthetic mixture, mannitol, povidone, glycerol, mg-stearate and corn starch were added as per standard reference. All ingredients were transferred to 100 ml volumetric flask and 70 ml of Methanol was added and mechanically stirred for 20 minutes. This solution was filtered through the whatmann filter paper no. 41 and filtrate was collected. Residues were washed with Methanol. The filtrate and washing were combined and volume of solution was made up to 100 ml with Methanol. Recovery studies were performed at three levels (80%, 100% and 120%). The percentage recovery should lie within the range 98 % - 102%. If it should lie within the range then it indicate that drug does not interact with excipients. If it does not lie within the range then add excipients individually one by one and find out which excipient interact with drug.
ESTIMATION OF CC AND AB IN SYNTHETIC MIXTURE [21, 22, 28]
(A) Absorption Ratio Method
The synthetic mixture of Candesartan cilexetil and Amlodipine besylate was prepared in ratio of 8:5. Accurately weighed 8 mg of Candesartan cilexetil and 5 mg of Amlodipine besylate were transferred to 25 ml volumetric flask, and 10 ml of Methanol was added. Excipients, such as mannitol, povidone, glycerol, mg-stearate and corn starch which were used in tablet formulation, were added in this mixture and mechanically stirred for 20 minutes. This solution was filtered through the whatmann filter paper no. 41 and filtrate was collected. Residues were washed with Methanol. The filtrate and washing were combined and volume of solution was made up to 10 ml with Methanol. 2.5 ml of this solution was diluted up to 10 ml with Methanol. Absorbance of the resulting solution was measured at 242 nm and 255 nm against Methanol as a reagent blank. The concentration of AB and CC can be calculated using equation [2],
CX = [(QM – QY) / (QX -QY)] × A1/aX1
CY = [(QM – Qx) / (Qy -Qx)] × A1/ay1
Where,
Qm = A2/A1, Qx = ax2/ax1, Qy = ay2/ay1;
1. Designates isoabsorptive point at 242 nm (λ1)
2. Designates 255 nm λmax of CC;
A1, A2 are absorbance of mixture at 242 nm (λ1) and 255 nm (λ2) respectively
ax1 and ax2 are absorptivity of AB at λ1 and λ2 respectively,
ay1 and ay2 are absorptivity of CC at λ1 and λ2 respectively,
Cx and Cy are concentrations of AB and CC respectively.
RESULT AND DISCUSSION
Selection of wavelength for Absorption Ratio Method of AB and CC
To determine wavelength for measurement, standard spectra of AB and CC were scanned between 200-400 nm against Methanol.
Isoabsorptive Point at 242 nm and at 255 nm for λmax of CC respectively.
Overlay spectra of AB and CC are presented in figure 2.
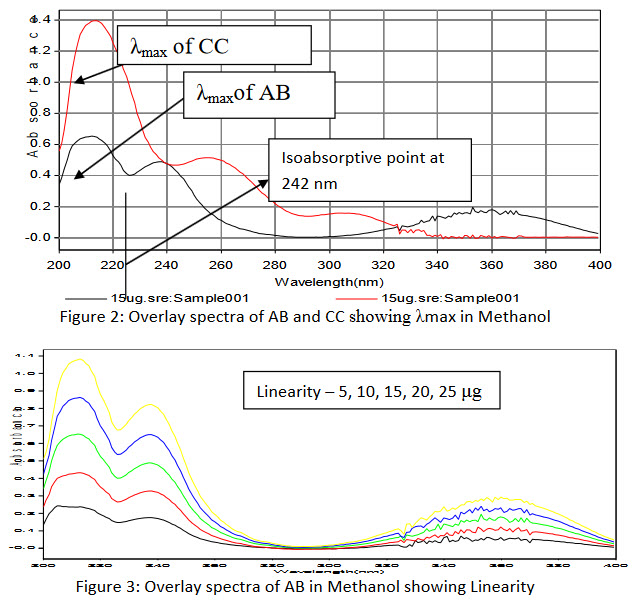
Figure 2: Overlay spectra of AB and CC showing λmax in Methanol ; Figure 3: Overlay spectra of AB in Methanol showing Linearity
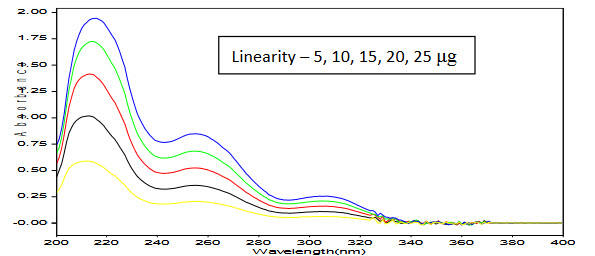
Figure 4: Overlay spectra of CC in Methanol showing Linearity
METHOD VALIDATION
A) Linearity and Range
The linearity range for AB and CC were found to be in the range of 5 - 25 μg/ml and 5 – 25 μg/ml respectively. Linearity data for AB at 242 nm (λ1) and 255 nm (λ2) are depicted in table 3. Linearity data for CC at 242 nm (λ1) and at 255 nm (λ2) are depicted in table 4.
Table 3: Linearity data for AB at 242 nm and 255 nm
|
Conc. µg/ml |
Absorbance at λ1 = 242 nm ± S.D. (n=3) |
% RSD
|
Absorbance at λ2= 255 nm ± S.D. (n=3) |
% RSD
|
|
5 |
0.171 ± 0.00124 |
0.72 |
0.086 ± 0.00081 |
0.94 |
|
10 |
0.321 ± 0.00124 |
0.38 |
0.140 ± 0.00047 |
0.33 |
|
15 |
0.475 ± 0.0004 |
0.099 |
0.198 ± 0.00163 |
0.82 |
|
20 |
0.633 ± 0.0009 |
0.14 |
0.261 ± 0.00244 |
0.93 |
|
25 |
0.803 ± 0.00163 |
0.203 |
0.318 ± 0.0021 |
0.66 |
*n= 3
Table 4: Linearity data for CC at 242 nm and 255 nm
|
Conc. µg/ml |
Absorbance at λ1 = 242 nm ± S.D. (n=3) |
% RSD
|
Absorbance at λ2= 255 nm ± S.D. (n=3) |
% RSD
|
|
5 |
0.183 ± 0.001247 |
0.726 |
0.204 ± 0.001247 |
0.6 |
|
10 |
0.335 ± 0.0029 |
0.387 |
0.364 ± 0.00094 |
0.24 |
|
15 |
0.476 ± 0.0028 |
0.099 |
0.518 ± 0.0029 |
0.559 |
|
20 |
0.629 ± 0.0047 |
0.148 |
0.682 ± 0.00163 |
0.239 |
|
25 |
0.793 ± 0.002357 |
0.2033 |
0.853 ± 0.002828 |
0.331 |
*n= 3
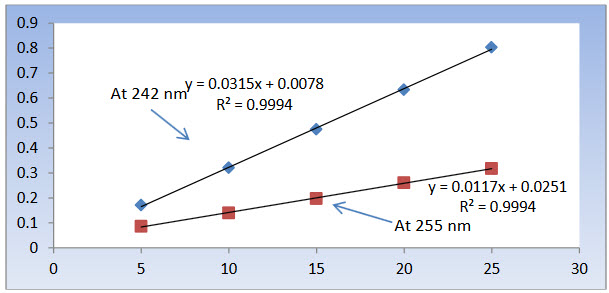
Figure 5: Calibration curve for AB at 242 nm and 255 nm
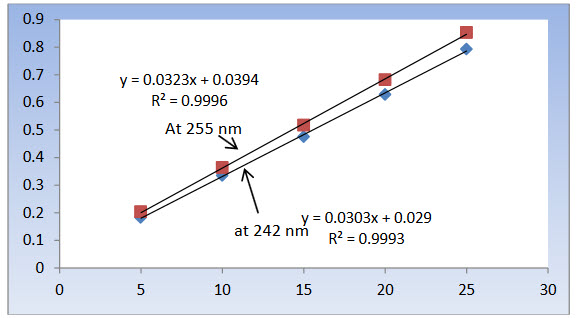
Figure 6: Calibration curve for CC at 242 nm and 255 nm
|
CHARACTERISTICS |
AMLODIPINE BESYLATE |
CANDESARTAN CILEXETIL |
||
|
λ1 |
λ2 |
λ1 |
λ2 |
|
|
Wavelength (nm) |
242 |
255 |
242 |
255 |
|
Linearity (μg/ml) |
5-25 |
5-25 |
5-25 |
5-25 |
|
Regression Equation |
y = 0.031x + 0.007 |
y = 0.011x + 0.025 |
y = 0.030x - 0.029 |
y = 0.032x + 0.039 |
|
Slope |
0.031 |
0.011 |
0.030 |
0.032 |
|
r2 |
0.9990 |
0.9996 |
0.9994 |
0.9990 |
|
Intercept |
0.007 |
0.025 |
0.029 |
0.039 |
|
LOD(μg/ml) |
0.11 |
0.444 |
0.2651 |
0.292 |
|
LOQ (μg/ml) |
0.357 |
1.35 |
0.8034 |
0.599 |
Table 5: Statistical data of AB and CC
B) Precision
I) Repeatability
The data for repeatability for AB and CC at 242 nm and 255 nm are shown in Table.
Table 6: Repeatability data of AB at 242 nm and 255 nm
|
Sr. No. |
Conc.(μg/ml) |
Absorbance at 242 nm |
%RSD At 242 nm |
Absorbance at 255 nm |
%RSD at 255 nm |
|
1 |
15 |
0.478 |
0.335 |
0.171 |
0.81 |
|
2 |
0.476 |
0.172 |
|||
|
3 |
0.475 |
0.174 |
|||
|
4 |
0.480 |
0.175 |
|||
|
5 |
0.478 |
0.173 |
|||
|
6 |
0.479 |
0.171 |
Table 7: Repeatability data of CC at 242 nm and 255 nm
|
Sr. No. |
Conc.(μg/ml) |
Absorbance at 242 nm |
%RSD At 242 nm |
Absorbance at 255 nm |
%RSD at 255 nm |
|
1 |
20 |
0.629 |
0.664 |
0.655 |
0.682 |
|
2 |
0.625 |
0.653 |
|||
|
3 |
0.637 |
0.655 |
|||
|
4 |
0.635 |
0.664 |
|||
|
5 |
0.630 |
0.660 |
|||
|
6 |
0.634 |
0.662 |
Table 8: Intraday precision data of AB at 242 nm and at 255 nm
|
Sr. No. |
Conc. (μg/ml) |
Absorbance at 242 nm ± S.D |
%RSD At 242 nm |
Absorbance at 255 nm ± S.D |
%RSD at 255 nm |
|
1 |
5
|
0.176±0.001247 |
0.7059 |
0.067±0.00047 |
0.7 |
|
2 |
10
|
0.325±0.001633 |
0.5024 |
0.122±0.00129 |
0.81 |
|
3 |
15 |
0.477±0.001247 |
0.2611 |
0.183±0.00163 |
0.89 |
Table 9: Intraday precision data of CC at 242 nm and at 255 nm
|
Sr. No. |
Conc. (μg/ml) |
Absorbance at 242 nm ± S.D |
%RSD At 242 nm |
Absorbance at 255 nm ± S.D |
%RSD at 255 nm |
|
1 |
5
|
0.176±0.001247 |
0.7059 |
0.202±0.0017 |
0.83 |
|
2 |
10
|
0.331±0.0017 |
0.5124 |
0.361±0.00094 |
0.26 |
|
3 |
15 |
0.477±0.00216 |
0.4528 |
0.519±0.000816 |
0.15 |
Table 10: Interday precision data of AB at 242 nm and at 255 nm
|
Sr. No. |
Conc. (μg/ml) |
Absorbance at 242 nm ± S.D |
%RSD At 242 nm |
Absorbance at 255 nm ± S.D |
%RSD at 255 nm |
|
1 |
5
|
0.179±0.001247 |
0.69 |
0.063±0.00326 |
0.52 |
|
2 |
10
|
0.328±0.001247 |
0.37 |
0.122±0.000816 |
0.66 |
|
3 |
15 |
0.478±0.00471 |
0.098 |
0.178±0.00124 |
0.696 |
Table 11: Interday precision data of CC at 242 nm and at 255 nm
|
Sr. No. |
Conc. (μg/ml) |
Absorbance at 242 nm ± S.D |
%RSD At 242 nm |
Absorbance at 255 nm ± S.D |
%RSD at 255 nm |
|
1 |
5
|
0.198±0.000471 |
0.23 |
0.216±0.000471 |
0.21 |
|
2 |
10
|
0.343±0.001414 |
0.41 |
0.371±0.00216 |
0.58 |
|
3 |
15 |
0.502±0.002357 |
0.46 |
0.542±0.00216 |
0.39 |
Table 12: Accuracy data of AB
|
Amount of Drug in sample (µg/ml) |
Amount of Std. Drug added (µg/ml) |
Total amount of Drug (µg/ml) |
Mean Total amount of Drug recovered (µg/ml) Mean ± S.D.* |
%Recovery |
% R.S.D. |
|
5 |
0 |
5 |
5.05 ± 0.017 |
101 |
0.80 |
|
5 |
4 |
9 |
9.00 ± 0.0012 |
100.38 |
0.38 |
|
5 |
5 |
10 |
9.89 ± 0.0016 |
99.8 |
0.45 |
|
5 |
6 |
11 |
10.95 ± 0.0021 |
99.56 |
0.50 |
Table 13: Accuracy data of CC
|
Amount of Drug in sample (µg/ml) |
Amount of Std. Drug added (µg/ml) |
Total amount of Drug (µg/ml) |
Mean Total amount of Drug recovered (µg/ml) Mean ± S.D.* |
%Recovery |
%R.S.D. |
|
8 |
0 |
8 |
8.1 ± 0.0040 |
102.56 |
0.19 |
|
8 |
6.4 |
14.4 |
13.74 ± 0.0015 |
95.5 |
0.48 |
|
8 |
8 |
16 |
15.67 ± 0.0025 |
98.00 |
0.25 |
|
8 |
9.6 |
17.6 |
17.42 ± 0.0009 |
99.05 |
0.09 |
Applicability of the Method
Analysis using synthetic mixture
Applicability of the proposed method was tested by analyzing synthetic mixture prepared in laboratory.
Table 14: Analysis of synthetic mixture
|
Synthetic mixture |
Label claim |
Assay (% of label claim) Mean* ± S. D. |
||
|
AB |
CC |
% AB |
% CC |
|
|
5 mg |
8 mg |
101.02±0.37 |
99.95±0.452 |
|
The assay results were comparable to labeled value of each drug in synthetic mixture. These results indicate that the developed method is accurate, precise, simple and rapid. It can be used in the routine quality control of dosage form in industries.
CONCLUSION: Spectrophotometric methods Q – absorption Ratio method was developed for estimation of AB and CC in bulk drugs and synthetic mixture without prior separation. Methods were found to be precise and accurate as can be reflected from validation data. Developed methods were successfully applied for estimation of AB and CC in Synthetic mixture.
ACKNOWLEDGEMENT: The authors are grateful to Alembic Pharma Baroda, for providing gift sample of candesartan cilexetil to the research department of quality assurance, at Smt. r. d. gardi pharmacy college, department of quality assurance, Rajkot.
REFERENCES:
- Yasuda T, Tanaka M, Iba K, “Quantitative determination of amlodipine in serum by liquid chromatography with atmospheric pressure chemical ionization tandem mass spectrometry”, Journal of Mass Spectrom, 1996, 31(2), 879.
- Chatwal GR, Anands, Ultraviolet-Spectroscopy, Instrumental Methods of Chemical Analysis, Mubai, Himalaya Publishing House, 2000.
- Sweetman SC. Martindale: The complete drug refference, pharmaceutical press, 33rd edn. ALondon: The pharmaceutical press, 2002, 862 & 907.
- Govi-verlag, “Application of 1st derivative spectrophotometry for simultaneous estimation of candesaran cilexetil and hydrochlorthiazide”, Die pharmazie-An international journal of pharmaceutical science, 2003, 58(11), 796-800.
- Backett AH, and Stenlake JB, Practical Pharmaceutical Chemistry, First Edition, Reprint, CBS Publishers and Distributors, New Delhi, 2004, 275 – 325.
- International Conference on Harmonization of Technical Requirments for Registration of Pharmaceutical for Humanuse. Validation of analytical proceure: Text book and Methodology ICH Q2 (R1), 2005.
- Miller JM, Chromatography, Concept And Contract, 2nd Edn, John Willey And Sons, Newyork, 2005, 43-45.
- Sharma S, Sher P, Badve S, Atmaram PP. Recent advances in Spectroscopic technique, 6th Edn, London, APS Publisher and distributors, 2005, E 618-E 625.
- Kanakapura B, Umakanthappa C, and Paregowda N, “Spectrophotometric and High Performance Liquid Chromatographic Determination of Amlodipine Besylate (ADB) in Pharmaceuticals”, ScienceAsia, 2005, 31(2), 13-21.
- Malesuik MD, Cardos SG, Bajerski L, Lanzanova FA, “Determination of amlodipine in pharmaceutical dosage forms by liquid chromatography and ultraviolet spectrophotometry.”, Journal of AOAC international, 2006, 89(2), 359-364.
- The Merck Index, An Encyclopedia of Chemicals, Drugs, and Biologicals, Merck & Co, Inc, Whitehouse Station, NJ, 2006, 497 & 281.
- Rang HP, Dale MM, and Ritter JM, Pharmacology, 6th Edn, Churchill Livingstone, New York, 2007, 294-315.
- Mendham J, Denny JD, Barner & Thomas MJK, Vogel’s Text book of Quantitative Chemical Analysis, 6th Edn, Dorling Kindersley, India, 2007, 717-756.
- “Indian Pharmacopoeia ”, Volume 2, Ghaziabad: Govt. of India Ministry of Health & Family welfare, The Controller of Publication, 2007, 714-716, 749-752, A-84.
- “British Pharmacopoeia”, Vol-I, London: HMSO Publication, 2007, 137-138.
- Tripathi KD, Essential of Medical Pharmacology, 6th Edn, Jaypee Brothers Medical Publishers (P) Ltd, New Delhi, 2008, 540,522.
- Garg G, Saraf S, Saraf S, Development and validation of “Amlodipine Besylate and Enalepril Maleate in combined dosage form”, Trends in Applied sciences research, 2008, 3(3), 278-284.
- Kakde RB, Kotak VH, Barsagade AG, Chaudhary NK, and Kale DL, “Spectrophotometric Method for Simultaneous Estimation of Amlodipine Besylate and Bisoprolol Fumarate in Pharmaceutical Preparation”, Research Journal of Pharamaceuticals and Technolgy, 2008, 1(4), 513-515.
- USP32, NF27 VOL.I (1225) Validation of compendial procedure, 2009, pp 733-736 & 1872 -1873.
- Sureshkumar GV, Rajendraprasad Y. “Development and validation of reversed phase HPLC method for telmisartan and amlodipinein tablet dosage form”. International Journal of Pharmaceutical Science, 2010, 2(3), 128-31.
- Shah PN, Patel BN, Patel CN and Dave JB, “RP-HPLC Method of Simultaneous Estimation of Enalapril maleate and Lercanidipine HCl in synthetic mixture”, International Journal of Research in Pharmacy and Chemistry, 2011, 1(3), 308-314.
- Vyas AJ, Patel JK, Bhandari A, Chavda JR and Sheth NR, “Simultaneous Estimation of Lornoxicam and Paracetmaol by Vierodt’s Method in API and in Synthetic mixture”, International Journal of ChemTech Research, 2011 3(3), 1269-1273.
- Patil BK, RaghevendraNG,Jadhav KD, KulkarniupendraCV, Gada MJ,”Estimation of candesartan cilexetil in bulk and tablet dosage form by u.v spectrephotometric method”,International journal of research in ayrveda & pharmacy, 2011, 2(1), 204-206.
- General monographs of hypertensive drugs, “Japanese Pharmacopoeia”,by Ministry of Health, Labour & Welfare Ministerial Notification No.519,14th Edition,Part II, (JP) , for candesartan cilexetil: 2376-2378, & for Amlodipine besylate: 2363-2365, 2011.
- Mathrusri AS, Rav NB, Kushwala FB, “Liquid chromatography method for simultaneous quantitative determination of candesartan cilexetil and hydrochlorthiazide in pharmaceutical dosage form”.Journal of drug delivery & therapeutics, 2012, 2(2), 48.
- Kalyani GK, Deshmukh BN, Vaishanv YTand Kashyap PF,”, Anlytical method development and validation for the estimation of candesartan by derivative spectroscopy (First order and second order ).”International journal of pharmaceutical science and research, 2012, 3(5), 1379-1384.
- Drug Bank Open drug and open target database :
- http://www.drugbank.ca/drugs/DB00381 (Amlodipine)
- http://www.drugbank.ca/drugs/DB00796 (Candesartan)
- For Marketed preparation : http://www.MIMS.com/mimsphillipines
REFERENCE ID: PHARMATUTOR-ART-2156
|
PharmaTutor (ISSN: 2347 - 7881) Volume 2, Issue 5 Received On: 11/03/2014; Accepted On: 18/03/2014; Published On: 01/05/2014 How to cite this article: B Kotecha, M Pambhar, G Zala, S Faldu; Q-Absorbance Ratio Spectrophotometric Method for the Simultaneous Estimation of Amlodipine Besylate and Candesartan Cilexetil in Synthetic Mixture; PharmaTutor; 2014; 2(5); 167-178 |


