ABOUT AUTHORS
Ms. Swati Dhande*, Mr. Parikshit Gandhi
Bharati Vidyapeeth's College of Pharmacy
Navi Mumbai, 400614, Maharashtra, India.
*dswatir@gmail.com
ABSTRACT
Diabetes Mellitus describes a metabolic disorder which is characterized by chronic hyperglycaemia with disturbances of carbohydrate, fat and protein metabolism resulting from defects in insulin secretion. Various combination therapies are used to treat metabolic syndrome and includes an antidiabetic drug to control the blood glucose levels, anti-hyperlipidemic drug to control cholesterol and lipid levels. In this study interaction between Sitagliptin phosphate, drug from antidiabetic class i.e. dipeptidyl peptidase IV inhibitor and Atorvastatin calcium other from antihyperlipidemic class i.e. HMG-COA reductase inhibitor was evaluated in Streptozotocin and High-fat diet induced type II diabetic rat model. The combination was selected since Sitagliptin phosphate and Atorvastatin Calcium share a common metabolizing enzyme, CYP3A4, there might be chances of interaction taking place due to the co-administration of the same. Bioanalytical method was developed and validated according to ICH guidelines for evaluation of pharmacokinetic parameters. Pharmacodynamic parameters such as Serum glucose, Serum cholesterol, Serum triglyceride levels and other related tests were performed to evaluate interaction at pharmacodynamic level. Results suggest that, at pharmacodynamic and pharmacokinetic level, this combination treatment can have good application in managing blood glucose level and lipid level as well. Being not affected by the CYP450 metabolisms as when correlated with plasma levels at their particular half-life, we suggest that Sitagliptin phosphate and atorvastatin calcium on simultaneous administration will not lead to cause any toxic effect.
[adsense:336x280:8701650588]
Reference Id: PHARMATUTOR-ART-2572
|
PharmaTutor (Print-ISSN: 2394 - 6679; e-ISSN: 2347 - 7881) Volume 6, Issue 3 Received On: 22/01/2018; Accepted On: 22/01/2018; Published On: 01/03/2018 How to cite this article: Dhande S, Gandhi P; Interaction Studies between Sitagliptin Phosphate and Atorvastatin Calcium in Streptozotocin Induced Chronic Type II Diabetes Mellitus Rat Model; PharmaTutor; 2018; 6(3); 45-57; http://dx.doi.org/10.29161/PT.v6.i3.2018.45 |
INTRODUCTION
Type II Diabetes mellitus is characterised by high blood sugar level due to insulin resistance and/ or relative lack of insulin. In many cases of chronic diabetes along with high blood sugar level, high level of lipids are also observed which leads to dyslipidemic conditions (which includes any abnormal lipid levels) (Srinivasan K et.al., 2005). Various combination therapies are prescribed to treat such coexisting conditions such as Sitagliptin phosphate and Simvastatin calcium; Glimepride, Rosuvastatin and Telmisartan; Metformin, Glimepride, Telmisartan and Atorvastatin; Sitagliptin phosphate and Atorvastatin calcium. Drug interaction refers to the consequences leading due to co-administration of two or more drugs. This action can increase or decrease the drug effect or a new effect can be produced that neither produces on its own. Typically, interactions between drugs can be termed as drug-drug interaction. However, interactions may also exist between drugs and food, drug and medicinal plants or herbs which can be termed as drug-food interaction, drug-herb interaction respectively (Tornio A et.al., 2012). Drug interactions are basically of two types i.e. pharmacokinetic drug interaction and pharmacodynamic drug interaction. Pharmacokinetic drug interactions occur when one drug affects the absorption, distribution, metabolism, or excretion of another. Pharmacodynamic drug interactions occur when two drugs affects the pharmacological action of each other (Scheen A. 2007) (Takanohashi T. 2010). As Sitagliptin phosphate an antidiabetic drug and Atorvastatin calcium an antihyperlipidemic drug share common metabolizing enzyme CYP3A4, their plasma protein binding being 38% and 96% respectively, since their site of metabolism and route of excretion are similar, when used in a combination may lead to a drug interaction (Sankar P et.al., 2012).
Sitagliptin phosphate is an oral antihyperglycemic drug of dipeptidyl peptidase IV inhibitor class. It competitively inhibits the enzyme dipeptidyl peptidase. This enzyme breaks down the incretins GLP-1 and GIP; gastrointestinal hormones released in response to a meal. By preventing GLP-1 and GIP inactivation, they increase the secretion of insulin and suppress the release of glucagon by the alpha cells of the pancreas. This drives blood glucose levels towards normal. As the blood glucose level approaches normal, the amounts of insulin released and glucagon suppressed diminishes (XiangFei J et.al., 2011) (Dubala A et.al., 2012) (Inamdar H and Mhaske A, 2012). Atorvastatin calcium is a member of the drug class known as statins, which are used primarily for lowering blood cholesterol and for prevention of events associated with cardiovascular disease. Like all statins, atorvastatin works by inhibiting HMG-CoA reductase, an enzyme found in liver tissue that plays a key role in production of cholesterol in the body (Kumar P et.al., 2008) (Dongyang L et.al., 2012). A base for pharmacokinetic interaction study, simple, rapid and sensitive bio-analytical method on RP-HPLC was developed; for simultaneous estimation of Sitagliptin phosphate and Atorvastatin calcium from rat plasma.
Materials and methods
Materials and reagents
Sitagliptin phosphate, Atorvastatin calcium and Eplerenone hydrochloride pharmaceutical grade were obtained as generous gifts from Glenmark Generics Mumbai, Rubicon Pharmaceuticals Pvt. Ltd. Mumbai and RPG life science Mumbai respectively. Methanol and Acetonitrile of HPLC grade were purchased from SD Fine Chemicals, Mumbai.
Animal Procurement
Male Sprague Dawley rats (150 to 200 g) were procured from Animal house of Maharashtra Animal and Fishery Sciences University, Mumbai, India. Rats were acclimatized with 12 hours dark and light cycle, Food (Standardised pellets) and water was given ad libitium and animal house was maintained at average temperature (24.00C± 20C) and 30-70% relative humidity respectively accordance with the guidelines set by the Committee for Purpose of Control and Supervision on Experiments on Animals (CPCSEA).
Preparation of standard solutions
Stock solutions of Sitagliptin phosphate, Atorvastatin calcium and Eplerenone hydrochloride each 1mg/ml were prepared in methanol. Working standard solutions of Sitagliptin phosphate and Atorvastatin calcium were prepared by serial dilution of stock solutions with mobile phase, to achieve final concentration range of 100 to 9500 ng/ml for Sitagliptin phosphate and 10-200 ng/ml for Atorvastatin calcium, keeping (Eplerenone hydrochloride) IS concentration 100 ng/ml in each sample. Calibration curves were constructed for the standard solutions of each drug after RP- HPLC/UV analysis.
Plasma sample preparation
The plasma was collected and stored at −20°C until analysis. For sample preparation the plasma was thawed at room temperature and a volume of 250μl was transferred to a glass tube and spiked with 50μl of standard solutions containing concentrations ranging from 100 – 9500 ng/ml of Sitagliptin phosphate and 10 to 200 ng/ml of Atorvastatin calcium and a constant concentration of Eplerenone hydrochloride 100 ng/ml as IS in each solution. Blank plasma samples were spiked with 50μl of mobile phase.
Protein Precipitation Method
Drugs were extracted from plasma samples using protein precipitation technique. Ammonium acetate buffer (100μl of 100mM) was added to each plasma sample for protein precipitation. The samples were then vortex-mixed for 2min. Further 1ml methanol was added for extraction of Sitagliptin phosphate or Atorvastatin calcium respectively, then vortex-mixed for 2min and centrifuged at 5500 rpm, 5oC for 10 min. The clear supernatant layer was separated in a glass test tube and evaporated to complete dryness under the nitrogen evaporator at 60°C. After drying, the residue was reconstituted in 250μl of mobile phase. Samples were vortex-mixed for 1min then put in insert tubes inside the pre-labelled HPLC vials and 50μl were injected into the RP-HPLC column for analysis.
Calibration curves were constructed for spiked plasma samples containing Sitagliptin phosphate in the range of 100-9400 ng/ml at 100, 1650, 3200, 4750, 6300, 7850 and 9400 ng/ml and a calibration curve for spiked plasma samples containing Atorvastatin calcium in the range of 10-220 ng/ml at 10, 45, 80, 115, 150, 185 and 220 ng/ml for each drug with Eplerenone hydrochloride 1000 ng/ml as IS.
Bio-analytical Method Development and Standardization: (European union agency, 2011) (Entidhar J et.al., 2013)
Chromatographic conditions
Thermo Autosampler HPLC System with PDA detector (model number HPLC PU – 2080 PLUS) was used for the separation of the compounds. The separation was being achieved on a HiQsil C18HS (4.6mm×250mm) analytical column. Various mobile phases like Methanol: Water [12] – 60:40, 80:20, 50:50, Acetonitrile : Water – 70:30, 60:35, 85:15, Potassium hydrogen phosphate buffer (10mM, 15mM, 20mM. 25mM and 50 mM) : Acetonitrile 45:55, 75:25, 50:50 etc were tried and optimised. The mobile phase with optimum resolution and sharp peak was selected. The final mobile phase was Acetonitrile: 50mM Potassium hydrogen phosphate buffer (pH- 4.5): Methanol in the ratio of 6:3:1. The flow rate kept was 0.6 ml/min and UV detection was performed at 255 nm. The mobile phase was sonicated on an ultrasonic bath for 30 min. The resulting transparent mobile phase was filtered through a 0.45 μ membrane filter (Millipore, Ireland). A 50 μl sample was injected six times under optimized chromatographic conditions and the data was acquired using Chromquest Software. The mobile phase ratio was optimized in isocratic mode for the analysis of Sitagliptin phosphate and Atorvastatin calcium. Different ratio of methanol : water for Sitagliptin phosphate such as 63:37, 65:35, 68:32 and 70:30 and for Atorvastatin calcium 50:50, 55:45, 60:40 and 68:32 were studied. The mobile phase ratio that resulted in a better resolution and higher recovery of the studied compounds was selected as the best mobile phase ratio for the analysis. The mobile phase flow rate was adjusted in isocratic mode for the analysis of studied compounds after applying various flow rats in the range of 0.5–1.5 ml/min. in order to get better separation. Different compounds including Eplerenone hydrochloride, Metformin hydrochloride, Losartan hydrochloride, Valsartan hydrochloride and Paracetamol were tried to be used as IS. The compound that showed better compatibility, best recovery and shorter analysis time was selected as IS for the suggested method. The sample loop size was evaluated in the range of 50–100 μl to adjust the sample size and minimize the problems like column loading and lack of sensitivity of the mentioned compounds.
In vivo Streptozotocin and High-fat diet induced type II diabetic rat model (Srinivasan K et.al., 2005).
42 Male Sprague Dawley rats (150 to 200 g) were distributed in 5 different groups. In group I and II 6 animals per group were taken while in Group III, IV and V 10 animals per group were taken. Group I serves as vehicle control, thus no diseases was induced to this group. Whereas rats of Group II, III, IV and V were fed with high fat diet for 30 days. On 15th day these rats were challenged by single dose of Streptozotocin i.p. (35 mg/kg). As Group II is Diseases control, no treatment was given to this group. Group III was treated with Sitagliptin phosphate (50 mg/kg). Group IV was treated with Atorvastatin calcium (40 mg/kg) and Group V was treated with both Sitagliptin phosphate (50 mg/kg) and Atorvastatin calcium (40 mg/kg) simultaneously. For pharmacokinetic study rats of Group III, IV, V were further distributed in 5 sub-sets consisting 2 animals each. Blood samples were withdrawn from retro-orbital plexus for pharmacodynamic studies at 0, 2, 4, 8, 12, 14 and 24 hours on the 1st day of the treatment and on 1,7, 14 day of the treatment i.e. on Day 0, Day 14, Day 21 and Day 28 of the experimental model for pharmacodynamic studies. For the pharmacodynamic studies the serum concentration of total triglycerides, total cholesterol and blood glucose level will be measured by standard procedures using auto analyser and for pharmacokinetic studies plasma samples were prepared according to the standards procedures and were used for RP-HPLC analysis.
Optimized Chromatographic conditions
Injection Volume : 50µL
Column : HiQsil C18 HS (250 × 4.6 mm; 5µm)
Column Oven : 300C
Mobile Phase : Acetonitrile: Potassium hydrogen phosphate buffer (50 mM, pH- 4.5): Methanol. (60:30:10).
Flow Rate : 0.6 mL/min
UV detector : 255 nm
Width : 0.2
Threshold : 400
Extraction method : Protein precipitation method
Extracting solvent : Methanol
IS : Eplerenone hydrochloride
RESULTS:
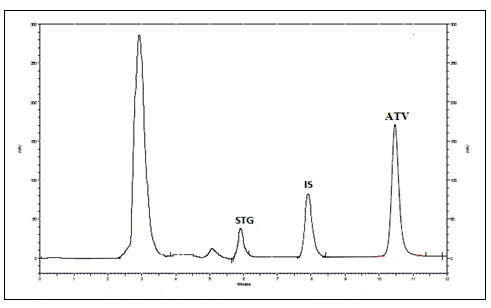
Figure 1 - Chromatogram of recovery of drugs and IS using methanol
Selectivity
No interferences from plasma components were seen at the Rt of Sitagliptin phosphate and Atorvastatin calcium and IS. The method was found to be selective at LLOQ (100ng /ml) for Sitagliptin phosphate and (10ng/ml) for Atorvastatin calcium. The blank responses were found to be less than 20% of area response of LLOQ and 5% for IS.
Carry-over
Carry over in the blank sample following the high concentration standard should not be greater than 20 % of the LLOQ and 5 % for the IS. The calculated value of drugs and IS were found to be 1.23% of Sitagliptin phosphate, 2.09% of Atorvastatin calcium and 1.04% of IS. Result showed that no carryover was found. So study samples can be randomized.
Lower Limit of Quantification
The lower limit of quantification of Sitagliptin phosphate which could be detected was found to be 100ng/ml with % RE = 0.36 % and % CV =0.22 (n=5) which is within acceptable limit. Similarly, the LLOQ of Atorvastatin calcium was found to be 10 ng/ml with % RE = -1.643 and %CV= 0.72 (n=5) which is within acceptable limit.
NOW YOU CAN ALSO PUBLISH YOUR ARTICLE ONLINE.
SUBMIT YOUR ARTICLE/PROJECT AT editor-in-chief@pharmatutor.org
Subscribe to Pharmatutor Alerts by Email
FIND OUT MORE ARTICLES AT OUR DATABASE
Calibration Curve
Calibration curves were constructed over the range of concentration of 100ng/ml-9500 ng/ml for Sitagliptin phosphate and 10ng/ml-200 ng/ml for Atorvastatin calcium on four different days. Since, homoscedasticity was observed by ordinary linear regression model, the best fit and least square residual model were used for calibration function by subjecting to unweighted linear regression. The unweighted linear regression model was selected for back calculation of concentrations from calibration curve. The linearity plots of Sitagliptin phosphate and Atorvastatin calcium are given in following table 1 and table 2 and it gives the mean, %relative error, % nominal and % coefficient of variation and it was found to be within acceptable limits of 15% accuracy and precision 20% for LLOQ.
|
Calibration Level |
Nominal concentration (ng/ml) |
Mean of back calculated concentration (ng/ml) |
%RE* |
%CV* |
% Nominal |
|
1 |
100 |
100.36 |
0.36 |
0.22 |
110.36 |
|
2 |
1650 |
1538.23 |
6.77 |
4.49 |
93.22 |
|
3 |
3200 |
3126.85 |
-2.28 |
2.65 |
97.71 |
|
4 |
4750 |
4728.06 |
-0.46 |
1.03 |
99.53 |
|
5 |
6300 |
6449.26 |
2.36 |
4.30 |
102.36 |
|
6 |
7850 |
8043.62 |
2.46 |
5.55 |
102.46 |
|
7 |
9400 |
9782.62 |
4.07 |
1.35 |
104.07 |
Where %RE = relative error, %CV= coefficient of variance.
Table 2: Result for linearity of Atorvastatin calcium in Rat plasma.
|
Calibration Level |
Nominal concentration (ng/ml) |
Mean of back calculated concentration (ng/ml) |
%RE* |
%CV* |
% Nominal |
|
1 |
10 |
10.35 |
-89.64 |
0.72 |
103.56 |
|
2 |
45 |
39.09 |
-62.91 |
8.75 |
92.42 |
|
3 |
80 |
77.20 |
-22.79 |
4.07 |
96.50 |
|
4 |
115 |
119.25 |
19.25 |
4.95 |
103.69 |
|
5 |
150 |
151.73 |
51.73 |
2.44 |
101.15 |
|
6 |
185 |
186.86 |
91.86 |
4.75 |
103.70 |
|
7 |
220 |
223.16 |
128.16 |
2.83 |
103.71 |
Where %RE = relative error, %CV= coefficient of variance
Accuracy, Precision and Recovery
Within run batch % CV for Sitagliptin phosphate were found to be below 0.227% and between run batch were below 5.25% at all concentration level and for Atorvastatin calcium within run batch %CV were found to be below 0.724% and between run batch were below 3.32% at all concentration level. Similarly, for Sitagliptin phosphate, the % RE for within run batch varied between -7.75% and 9.14% and for between run batches, it was -6.77% and 2.46% and for Atorvastatin calcium the % RE for within run batch varied between -16.99% to 18.1% and for between run batches, it was -89.64% to 91.46%. The percent coefficient of variation (%CV) and percent nominal (%) as shown in Table 3 were within the acceptable limits. The recovery of Sitagliptin phosphate and Atorvastatin calcium determined at the three concentrations LQC, MQC and HQC was found to be 93.22, 99.53 and 102.46% for Sitagliptin phosphate and 82.42, 103.69, 103.70% for Atorvastatin calcium respectively. Recovery of IS was calculated as 79.11%. The mean absolute recoveries obtained were high and consistent (refer table no. 3
Table 3: Accuracy, Precision and Recovery values for Sitagliptin phosphate and Atorvastatin calcium in Rat plasma
|
Parameters Sitagliptin phosphate |
Concentration |
|||
|
LLOQ (100ng/ml) |
LQC (1650ng/ml) |
MQC (4750ng/ml) |
HQC (7850ng/ml) |
|
|
Within-run (n=5) |
||||
|
Mean |
107.35 |
1571.69 |
4642.07 |
7948.63 |
|
SD |
5.38 |
77.33 |
311.23 |
361.09 |
|
%RSD |
3.27 |
14.31 |
15.59 |
8.23 |
|
%RE |
9.14 |
-7.75 |
-2.00 |
0.75 |
|
% Nominal |
109.14 |
92.24 |
97.99 |
100.75 |
|
Between-run (n=20) |
||||
|
Mean |
110.24 |
1585.63 |
4700.15 |
7591.93 |
|
SD |
0.22 |
69.10 |
48.85 |
446.74 |
|
%RSD |
2.84 |
4.12 |
4.79 |
1.34 |
|
%RE |
0.36 |
-6.77 |
-0.46 |
2.46 |
|
% Nominal |
100.36 |
93.22 |
99.53 |
102.46 |
|
|
||||
|
Parameters Atorvastatin calcium |
Concentration |
|||
|
LLOQ (10ng/ml) |
LQC (45ng/ml) |
MQC (115ng/ml) |
HQC (185ng/ml) |
|
|
Within-run (n=5) |
||||
|
Mean |
11.62 |
39.01 |
109.58 |
174.73 |
|
SD |
0.19 |
3.06 |
5.87 |
9.22 |
|
%RSD |
0.62 |
1.43 |
1.55 |
0.82 |
|
%RE |
18.1 |
-16.99 |
0.70 |
0.07 |
|
% Nominal |
118.1 |
83.00 |
100.70 |
100.07 |
|
Between-run (n=20) |
||||
|
Mean |
10.36 |
38.88 |
113.17 |
181.74 |
|
SD |
0.07 |
3.24 |
5.91 |
9.11 |
|
%RSD |
0.28 |
0.41 |
0.47 |
1.34 |
|
%RE |
-89.64 |
-62.91 |
19.25 |
91.86 |
|
% Nominal |
103.5 |
82.42 |
103.69 |
103.70 |
Where SD = Standard deviation, %RSD = relative standard deviation, %RE = relative error
Dilution integrity
The results of dilution integrity using five replicates are presented in the table 4. The precision and accuracy values for dilution integrity were found to be within acceptable limits. It indicates that dilution can be carried out on higher analyte concentration above the upper limit of quantification (ULOQ), if encountered during real subject sample analysis. The results obtained were found to be within acceptable limits of accuracy and precision i.e., within ±15% of nominal concentration.
Table 4: Results of Dilution integrity of Sitagliptin phosphate and Atorvastatin calcium in Rat plasma.
|
Concentration level in plasma |
Sitagliptin phosphate |
Atorvastatin calcium |
||
|
2 * (4750ng/ml) |
4* (2375ng/ml) |
2 * (100ng/ml) |
4 * (50ng/ml) |
|
|
Mean of back calculated concentration (n=5) |
4825.489 |
2417.901 |
106.33 |
58.041 |
|
%RE |
-7.35 |
4.46 |
4.48 |
13.0 |
|
%CV |
12.92 |
12.44 |
11.51 |
14.65 |
|
% Nominal |
93.95 |
102.46 |
96.98 |
105.43 |
Where %RE = relative error, %CV = coefficient of variation.
The results obtained were found to be within acceptable limits of accuracy and precision i.e., within ±15% of nominal concentration.
Stability
The results of stability of Sitagliptin phosphate and Atorvastatin calcium are summarized in Table 5. For short term stability, there was no observed effect on quantification of extracted samples kept at room temperature for eight hours. Sitagliptin phosphate and Atorvastatin calcium appeared to be stable after three freeze-thaw cycles. QC samples of Sitagliptin phosphate and Atorvastatin calcium were stable after long term storage of 30 days at -20°C. Less than 10 % deviation was seen for the stability samples on comparison with fresh samples. Stock solutions of drug samples and IS were stable after storing in refrigerator for 90 days. Under all the conditions for stability, the mean accuracy (%RE) values were within acceptable limits.
Table 5: Results of Stability studies for Sitagliptin phosphate and Atorvastatin calcium in Rat plasma.
|
Stability studies |
||||||
|
Sitagliptin phosphate |
Short-term stability |
Freeze-thaw stability |
Long-term stability |
|||
|
LQC |
HQC |
LQC |
HQC |
LQC |
HQC |
|
|
Mean |
1571.69 |
7948.63 |
1489.69 |
7812.36 |
1426.69 |
7798.66 |
|
SD |
77.33 |
361.09 |
61.33 |
354.02 |
82.33 |
337.19 |
|
%RSD |
14.31 |
8.23 |
12.51 |
7.78 |
13.45 |
7.16 |
|
% Nominal |
92.24 |
100.75 |
94.14 |
98.67 |
94.00 |
97.24 |
|
% Deviation |
-7.75 |
0.75 |
-6.58 |
-1.24 |
-7.02 |
-2.31 |
|
|
||||||
|
Atorvastatin calcium |
Short-term stability |
Freeze-thaw stability |
Long-term stability |
|||
|
LQC |
HQC |
LQC |
HQC |
LQC |
HQC |
|
|
Mean |
107.35 |
174.73 |
105.45 |
171.13 |
104.85 |
169.26 |
|
SD |
5.38 |
9.22 |
7.48 |
8.76 |
6.58 |
7.92 |
|
%RSD |
3.27 |
0.82 |
4.12 |
1.024 |
3.89 |
1.14 |
|
% Nominal |
109.14 |
100.07 |
106.57 |
97.69 |
105.88 |
95.87 |
|
% Deviation |
9.14 |
0.07 |
8.51 |
1.07 |
7.32 |
1.10 |
Where SD = standard deviation, %RSD = relative standard deviation
Pharmacokinetic analysis: Blood samples were withdrawn after the administration of drugs on Day1, the plasma samples were separated and were carried further for RP-HPLC analysis by using the developed and standardised bio-analytical method and samples were observed at 0,2,4,8,10,12,14 and 24 hours. (Table 6)
Table 6 - Results of pharmacokinetic plasma samples
|
Sitagliptin Phosphate |
Atorvastatin calcium |
||||
|
Samples in hours |
Mean peak area |
Samples in hours |
Mean peak area |
||
|
Group III |
Group V |
Group IV |
Group V |
||
|
2 |
33037.5 |
33268.5 (0.69%) |
2 |
151238.8 |
153125.3 (1.23%) |
|
4 |
67599.25 |
68648.75 (1.52%) |
4 |
321193.5 |
324963.8 (1.16%) |
|
8 |
93394 |
95481 (2.18%) |
8 |
509898.5 |
514726.8 (0.93%) |
|
12 |
119651.8 |
122868.5 (2.61%) |
12 |
653923 |
660523.3 (0.99%) |
|
14 |
101113.5 |
105268 (3.93%) |
14 |
784922 |
791456 (1.16%) |
|
24 |
40529.25
|
41875.5 (3.21%) |
24 |
373968.3 |
376403.5 (0.64%) |
Where (%) show the recovery of the drug.
Results of Pharmacodynamic analysis are represented in tables 7 to table 12 and figures 2 to 7.
1. Effect of Glucose level
Table 7 - Effect of Glucose level
|
Groups |
Day 0 |
Day 14 |
Day 21 |
Day 28 |
|
Group I$ |
91.13 ± 1.40 |
97.18 ± 2.91 |
90.13 ± 4.46 |
97.66 ± 2.60 |
|
Group II$ |
91.68 ± 3.22 |
97.02 ± 3.27 |
288.71 ± 3.79 |
295.40 ± 4.36 |
|
Group III# |
97.88 ± 1.50 |
94.52 ± 2.22* |
144.58 ± 3.70* |
127.95 ± 17.06* |
|
Group IV# |
95.99 ± 2.229 |
94.20 ± 9.74* |
193.09 ± 4.30* |
174.92±17.87* |
|
Group V# |
93.80 ± 2.17 |
94.84 ± 9.81* |
135.69±3.39*^~ |
120.68±10.35*^~ |
All values are expressed as Mean ± S.E.M were n = $6 or #10 Statistical analysis was performed by one way ANOVA followed by Dunnett’s test, where *, ^, ~ p<0.01, when compared with diseases control group, Sitagliptin phosphate group, Atorvastatin calcium group respectively.
NOW YOU CAN ALSO PUBLISH YOUR ARTICLE ONLINE.
SUBMIT YOUR ARTICLE/PROJECT AT editor-in-chief@pharmatutor.org
Subscribe to Pharmatutor Alerts by Email
FIND OUT MORE ARTICLES AT OUR DATABASE
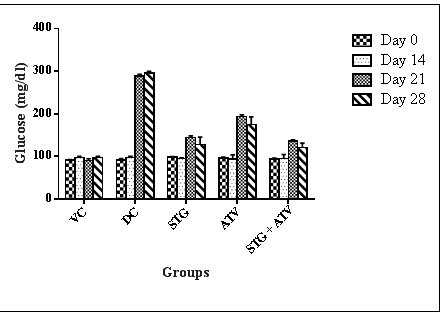
Figure 2 : Serum Glucose
2. Effect on Serum Cholesterol
Table 8: Effect on Serum Cholesterol
|
Groups |
Day 0 |
Day 14 |
Day 21 |
Day 28 |
|
Group I$ |
50.18±1.83 |
51.62 ± 1.05 |
55.68 ± 4.31 |
56.59 ± 4.71 |
|
Group II$ |
41.94 ± 1.60 |
105.45 ± 4.23 |
117.28 ± 2.37 |
127.12 ± 0.95 |
|
Group III# |
45.89 ± 0.96 |
107.16 ± 2.51* |
100.76 ± 1.46* |
99.06 ± 13.00* |
|
Group IV# |
43.07 ± 1.28 |
106.53 ± 8.46* |
95.90 ± 2.73* |
86.64 ± 8.43* |
|
Group V# |
44.11 ± 1.22 |
103.2 ± 8.31* |
100.12±1.75*~ |
82.42 ± 0.80*^~ |
All values are expressed as Mean ± S.E.M were n = $6 or #10
Statistical analysis was performed by one way ANOVA followed by Dunnett’s test, where *, ^, ~ p<0.01, when compared with diseases control group, Sitagliptin phosphate group, Atorvastatin calcium group respectively.
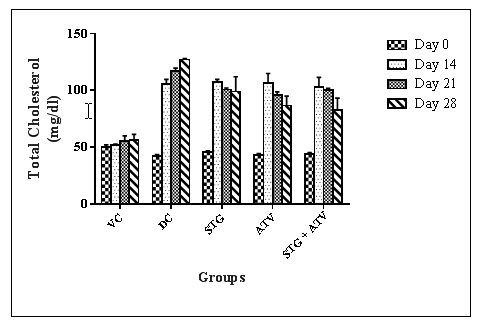
Figure 3 : Serum Cholesterol
3. Effect on Serum Triglycerides
Table 9: Effect on Serum triglyceride
|
Groups |
Day 0 |
Day 14 |
Day 21 |
Day 28 |
||
|
Group I$ |
67.23 ± 1.46 |
66.46 ± 1.98 |
66.89 ± 2.04 |
66.64 ± 1.79 |
||
|
Group II$ |
75.33 ± 3.12 |
179.54 ± 2.43 |
211.4 ± 9.71 |
240.95 ± 9.15 |
||
|
Group III# |
73.35 ± 1.88 |
168.54 ± 2.90* |
157.42 ± 2.34* |
132.22±13.09* |
||
|
Group IV# |
72.01 ± 2.22 |
170.26 ±13.60* |
147.23 ± 3.14* |
109.37±9.70*^ |
||
|
Group V# |
73.16 ± 1.61 |
171.25±10.73*^ |
142.53±12.89*^ |
101.97±17.06*^~ |
||
All values are expressed as Mean ± S.E.M were n = $6 or #10
Statistical analysis was performed by one way ANOVA followed by Dunnett’s test, where *, ^, ~ p<0.01, when compared with diseases control group, Sitagliptin phosphate group, Atorvastatin calcium group respectively.
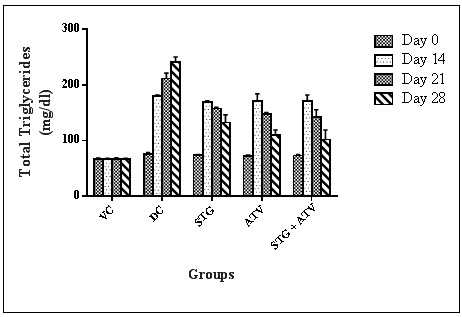
Figure 4: Serum Triglyceride
4. Effect on High density lipoprotein.
Table 10: Effect on High Density Lipoprotein
|
Groups |
Day 0 |
Day 14 |
Day 21 |
Day 28 |
|
Group I$ |
24.12 ± 1.26 |
24.17 ± 0.56 |
24.24 ± 1.11 |
24.77 ± 1.19 |
|
Group II$ |
21.44 ± 0.75 |
11.93 ± 1.14 |
10.53 ± 0.50 |
10.18 ± 0.56 |
|
Group III# |
22.82 ± 0.81 |
10.61 ± 0.50* |
12.69 ± 0.55* |
13.49 ± 2.15* |
|
Group IV# |
23.08 ± 0.61 |
11.62 ± 1.21* |
15.87± 0.25*^ |
16.89± 1.77*^~ |
|
Group V# |
23.16 ± 0.75 |
12.30±1.30*^ |
16.06±0.40*^~ |
17.33± 2.84*^~ |
All values are expressed as Mean ± S.E.M were n = $6 or #10
Statistical analysis was performed by one way ANOVA followed by Dunnett’s test, where *, ^, ~ p<0.01, when compared with diseases control group, Sitagliptin phosphate group, Atorvastatin calcium group respectively.

Figure 5: High Density Lipoprotein
5. Effect on Low density lipoprotein.
Table 11: Effect on Low Density Lipoprotein
|
Groups |
Day 0 |
Day 14 |
Day 21 |
Day 28 |
|
Group I$ |
12.60 ± 0.63 |
14.15 ± 0.59 |
18.06 ± 3.88 |
18.49 ± 5.10 |
|
Group II$ |
5.43 ± 1.04 |
57.61 ± 5.65 |
64.47 ± 3.29 |
68.75 ± 0.99 |
|
Group III# |
6.84 ± 1.43 |
62.83 ±2.78* |
56.58 ± 1.23* |
49.06 ± 8.18* |
|
Group IV# |
5.58 ± 1.14 |
61.31 ±5.01* |
50.56±2.98*^ |
37.86 ±5.73*^ |
|
Group V# |
6.31 ± 1.27 |
56.64 ±5.12* |
55.42±1.50*^ |
33.02±4.70*^~ |
All values are expressed as Mean ± S.E.M were n = $6 or #10
Statistical analysis was performed by one way ANOVA followed by Dunnett’s test, where *, ^, ~ p<0.01, when compared with diseases control group, Sitagliptin phosphate group, Atorvastatin calcium group respectively
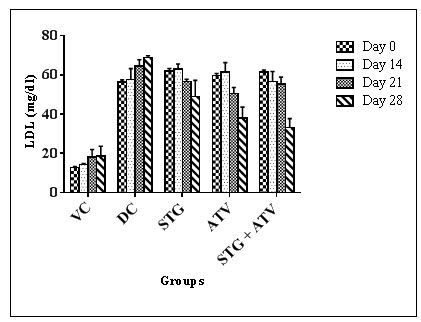
Figure 6: Low Density Lipoprotein
NOW YOU CAN ALSO PUBLISH YOUR ARTICLE ONLINE.
SUBMIT YOUR ARTICLE/PROJECT AT editor-in-chief@pharmatutor.org
Subscribe to Pharmatutor Alerts by Email
FIND OUT MORE ARTICLES AT OUR DATABASE
6.Effect on Very low density lipoprotein.
Table 12 - Effect on Very low density lipoprotein.
|
Groups |
Day 0 |
Day 14 |
Day 21 |
Day 28 |
|
Group I$ |
13.44 ± 0.29 |
13.29 ± 0.39 |
13.37 ± 0.40 |
13.32 ± 0.35 |
|
Group II$ |
15.06 ± 0.62 |
35.90 ± 4.48 |
42.28 ± 1.94 |
48.19 ± 1.83 |
|
Group III# |
14.67 ± 0.37 |
33.70 ± 0.58* |
31.48 ± 0.46* |
26.44 ± 2.78* |
|
Group IV# |
14.40 ± 0.44 |
33.85 ± 2.72* |
29.45 ± 0.62* |
21.87 ± 1.94*^~ |
|
Group V# |
14.63 ± 1.01 |
34.34± 2.41*^ |
28.50±2.57*^ |
20.89 ± 3.41*^~ |
All values are expressed as Mean ± S.E.M were n = $6 or #10
Statistical analysis was performed by one way ANOVA followed by Dunnett’s test, where *, ^, ~ p<0.01, when compared with diseases control group, Sitagliptin phosphate group, Atorvastatin calcium group respectively.
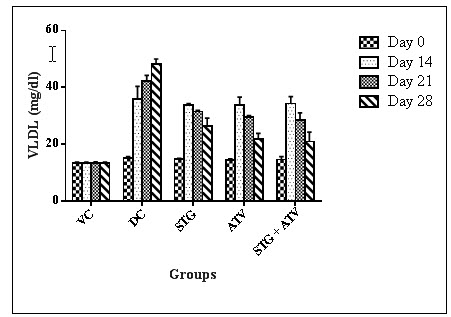
Figure 7: Very low Density Lipoprotein
DISCUSSION
This study has been carried out to evaluate the interaction mainly the pharmacokinetic and pharmacodynamic types. In pharmacokinetic drug interaction plasma levels of drugs were determined in presence of the drugs simultaneously. It was noted that in presence of Atorvastatin calcium the Sitagliptin phosphate levels in plasma were found to be almost same i.e. non-significantly as that of individual drug while in presence of Sitagliptin phosphate the Atorvastatin calcium levels in plasma were found to be almost same i.e. non – significant as that of individual drugs.
The drug Sitagliptin phosphate is completely absorbed after oral administration. However, Sitagliptin is subject to extensive first-pass metabolism in the gut wall as well as in the liver. As a consequence, oral bioavailability is more, around 87%. Food increases the absorption rate of Sitagliptin after oral administration, as indicated by increased peak concentration and decreased time to peak concentration. The volume of distribution of Sitagliptin phosphate is 198 L, and plasma protein binding exceeds 38%. The total plasma clearance of Sitagliptin phosphate is 350 ml/min and the half-life is about 12.4 hrs. The urine route is of minor importance (< 1%) for the elimination of Sitagliptin phosphate (Waeber B et al., 2010) (Bergman A et al., 2007) (Chu XY et al., 2007). The drug Atorvastatin calcium is completely absorbed after oral administration. However, atorvastatin is subject to extensive first-pass metabolism in the gut wall as well as in the liver. As a consequence, oral bioavailability is rather low, around 14%. Food decreases the absorption rate of atorvastatin after oral administration, as indicated by decreased peak concentration and increased time to peak concentration. The volume of distribution of atorvastatin is 381 L, and plasma protein binding exceeds 98%. The total plasma clearance of atorvastatin is 625 ml/min and the half-life is about 7 h. The renal route is of minor importance (< 1%) for the elimination of atorvastatin. Atorvastatin is extensively metabolized in both the gut and liver by oxidation, lactonization and glucuronidation, and the metabolites are eliminated by biliary excretion and direct secretion from blood to the intestine. Cytochrome P 450 3A4 is common metabolising enzyme of both drugs (Bernini F et al., 2001) (Neuvonen PJ et al., 2006).This indicates that Sitagliptin phosphate and Atorvastatin calcium though have common CYP 450 metabolising enzyme and common plasma protein binding site, these drugs manage to achieve individual levels in the plasma on simultaneous administration of these two drugs at dose 50 mg/kg of Sitagliptin phosphate and 40 mg/kg of Atorvastatin calcium. Further it is important to note that the pharmacokinetic interaction was not significant at a specific dose used in this study. But an increase in dose of both or either of the drugs can probably lead to pharmacokinetic drug interaction.
Elevation in plasma TG and cholesterol level usually indicates raised levels of serum LDL-C. Increased LDL-C levels may result in formation of oxidised LDL-C (ox-LDL), a precursor for atherosclerotic process.There exists an inverse relationship between HDL-Cholesterol and risk of coronary heart diseases. Low concentrations i.e. below 30mg/dL in humans are one of the risk factors for cardiac ailments (Harrison D et al., 2003). It was observed that the serum glucose level, serum cholesterol level, serum triglyceride level, low density lipoprotein levels, atherosclerotic index, cardiac risk ratio and atherosclerotic coefficient were observed to be significantly lowered in combination than that of individual treatment on 21st and 28th day of the experimental model. High density lipoprotein levels were found to be more significantly increased in combination group than that of individual group on 21st and 28th day of experimental model. This suggests that the combination showed pharmacodynamic drug interaction. The serum parameters were not found crossing the lower limit of normal range hence not a harmful interaction.
We can suggest that Sitagliptin phosphate and Atorvastatin calcium on simultaneous administration will not lead to any toxic effect at a dose of Sitagliptin phosphate (50mg/kg) and Atorvastatin calcium (40 mg/kg). Thus this combination can be referred as one of the preferred combination to treat chronic diabetes mellitus with least chances of drug interaction. Also if given at these doses they are not resulting in any of the toxic effect and found to be the beneficial combination.
CONCLUSION
Depending on these findings it is important to note that though this combination was found to safe and working individually at these doses (Sitagliptin phosphate 50 mg/kg and Atorvastatin calcium 40 mg/kg) we need to extrapolate this readings in humans to reach a proper conclusion of safety of this combination and pharmacokinetic drug interaction are to be studied to detect the proper toxicological effect at various different doses.
REFERENCES
1. Bergman A, Ebel D, Liu F. (2007); Absolute bioavailability of Sitagliptin, An oral dipeptidyl peptidase-4 inhibitor, in healthy volunteers. Journal of Biopharmaceutics Drug Disposition; 28; 315-335.
2. Bernini F, Poli A, Paoletti R. (2001); Safety of HMG-CoA reductase inhibitors: focus on atorvastatin. Journal of Cardiovascular Drugs Therapeutics; 15; 211-218.
3. Chu XY, Bleasby K, Yabut J. (2007); Transport of the dipeptidyl peptidase-4 inhibitor sitagliptin by human organic anion transporter 3, organic anion transporting polypeptide 4C1, and multidrug resistance P-glycoprotein. Journal of Pharmacology and Experimental Therapeutics; 321; 673-683.
4. Dongyang L, Jiang J, Zhou H, Hu P. (2008); Quantitative Determination of Atorvastatin and Para-hydroxy Atorvastatin in Human Plasma by LC–MS–MS. Journal of Chromatographic Science.; 46; 862-866.
5. Dubala A, Khatwal R, Kosaraju J, Meda V, Malay S. (2012); Bio-analytical method development and validation of sitagliptin phosphate by RP-HPLC and its application to pharmacokinetic study. International Journal of Pharmacy and Pharmaceutical Sciences; 4; 691-694.
6. Entidhar J, Akkam A, Rasool A, Adnan A, Badwan D, Nawzat D. (2013); Development and validation of a sensitive and accurate method for Determination of Atorvastatin and Rosuvastatin in rat plasma by RP-HPLC with UV detection method. International Journal of Pharmacy and Pharmaceutical Sciences; 5; 211-219.
7. European union agency; (2011); Bio-analytical method validation by guidelines of Eurpoean Medicines Agency Science Medicines Health, available at: http://www.ema.europa.eu/docs/en_GB/document_library/Scientific_guideline/2011/08/WC500109686.pdf
8. Harrison D, Griendling KK, Landmesser U, Hornig B, Drexler H. (2003); Role of oxidative stress in atherosclerosis. American Journal of Cardiology; 91; 3A; 7A–11A.
9. Inamdar H, Mhaske A. (2012); RP-HPLC Method for Simultaneous Determination of Metformin Hydrochloride, Rosiglitazone and Sitagliptin – Application to Commercially Available Drug Products. International Journal of Pharmaceutical Sciences and Research; 3; 3267-3276.
10. Kumar P, Narsimha R, Reddy N. (2008); Simultaneous determination of Atorvastatin calcium and lercanidipine in rat plasma by RP-HPLC and pharmacokinetic studies. Asian Journal of Pharmacodynamics and Pharmacokinetics; 8; 299-304.
11. Neuvonen PJ, Niemi M, Backman JT. (2006); Drug interactions with lipid-lowering drugs: mechanisms and clinical relevance. Journal of Clinical Pharmacology and Therapeutics; 80; 565-581.
12. Sankar P, Subhashree S, Sudharani S. (2012); Effect of Trigonellafoenum-graecum seed powder on the antioxidant levels of high fat diet and low dose Streptozotocin induced type II diabetic rats. Journal of European Review for Medical and Pharmacological Sciences; 16; 10-17.
13. Scheen A. (2007); Drug–drug and food–drug pharmacokinetic interactions with new insulinotropic agents repaglinide and nateglinide; Journal of Clinical Pharmacokinetics. 46; 93-108.
14. Srinivasan K, Viswanad B, Asrat L, Kaul C, Ramarao P. (2005); Combination of high-fat diet-fed and low-dose streptozotocin-treated rat: A model for type 2 diabetes and pharmacological screening,; Journal of Pharmacological Research; 52; 313-320.
15. Takanohashi T. (2010); Inhibition of human liver microsomal CYP by nateglinide. Journal of Pharmceutical research and Pharmacology; 62; 592-597.
16. Tornio A, Niemi M, Pertti J, Neuvonen TT, Backman G. (2012); Drug interactions with oral antidiabetic agents: pharmacokinetic mechanisms and clinical implications; Journal of Trends in Pharmacological Sciences; 33; 312-322.
17. Waeber B, Buclin T, Grouzmann E. (2010); Angioedema during ACE and DPP-4 inhibition. Journal of Review Medicine; 6; 28-31.
18. XiangFei J, DeWei S, Ye C, XinGang L, XiaoMeng W, TianYan Z, Wei L. (2011); A high performance liquid chromatography method for the quantitative determination assay of sitagliptin in rat plasma and its application in pharmacokinetics study. Journal of Chinese Pharmaceutical Sciences; 20; 63-69.
NOW YOU CAN ALSO PUBLISH YOUR ARTICLE ONLINE.
SUBMIT YOUR ARTICLE/PROJECT AT editor-in-chief@pharmatutor.org
Subscribe to Pharmatutor Alerts by Email
FIND OUT MORE ARTICLES AT OUR DATABASE