

About Authors:
*Kaumudi Singh, Shrishti Saroha
IIMT, Uttar Pradesh, India
*kaumudisingh.info@gmail.com
Abstract
In this research work we actually try to determine elastic modulous and hardness of a fiberglass of a car .this is done by AFM-like scan and in this thermoplastic has shown elastic modulous 7.40 and hardness 0.43 and fiberglass shows 76.69 and hardness 7.90. In this article we concluded that fibre glass is more beneficial than thermoplastic,hence fiberglass are good for tranportation of pharmaceuticles as I concluded.also as fibreglass is made up of glass it is inert with active ingredients also.
Reference Id: PHARMATUTOR-ART-1311
Introduction
To obtain surface maps of elastic modulus and hardness has been a main goal of our project.One prepared solution is to detect properties from an AFM-like scan of the surface. This modulus mapping technique, has more benefits but significant limitations. In many practical circumstances, surface roughness and incipient plascity compromise the determination of contact area and thus elastic modulus[1]. Furthermore, for modulus mapping to work, the contact must be elastic, but this requirement does not include hardness mapping because a hardness test need causing plascticity in the material.
[adsense:336x280:8701650588]
Express test
Shimadzu company introduced express test option offers users of the shimadzu nanlodentar G210 a prepared solution for mechnical properties mapping. Express test has more advantage over traditional indentation testing[2] in a new way in order to achieve traditional testing speed[3].
Express test performs complete one indentation cycle per second, including, approach, load, contact detection, unload and movement to the next indentation location. Thus, Expess test can be utilized to create correct surface maps of elastic modulus and hardness, simply by making a high-speed array of indents. In this brief article we will describe the use of express test to map the hardness and elastic modulus of fiberglass.
The express test option utilizes another G210 option, shimadzu, as a designed component; it provides superior positioning, flatness of travel, and image-processing software. These two options are not identical, however. Express Test requires it is as an integral part of ultrafast testing, but this can also be used as it was originally conceived (i.e.,in order to create high-quality, AFM-like images). In the work presented here, it is demonstrated both on its own and as a component of Express Test.
Method
All testing was performed with an shimadzu NanoIndenter G210 utilizing Express Test, NanoVision.The sample was a section of fiberglass car board, which was metallographically mounted and polished for nanoindentation. Fiberglass is a plastic that is reinforced by fine fibers of glass. For fiberglass car boards, thermosetting plastics (thermosets) are used as filler material. The exact constitution of the fiberglass tested in this work is unknown, but much can be learned from the mechanical properties of the constituents.
The test area was selected by viewing the surface under an optical microscope (40x optical magnification). Next, a NanoVision scan was performed in order to obtain a high-quality, AFM-like image of the surface. The scan load was 10mN. Express Test was then used to prescribe an array of 43 x 43 indents over an area of 43mm x 43mm. The test method was ‘Express Test to a Force.mss’ and all indents in the Express Test array had a maximum force of 1mN.
[adsense:468x15:2204050025]
Results
NanoVision Scan Results
Figure 1 displays surface topology from a NanoVision scan. This scan took about 19 minutes and is typical of what can be accomplished with NanoVision. The red circles are the exposed ends of individual glass fibers; the blue areas are the thermoset filler. It is important to note that Figure 1 is a genuine scan in which the indenter remains in continuous contact with the surface while tracing its topology. In other words, this image is not an Express Test; Express Test performs individual indentations over the domain, picking the indenter up off the surface after each indentation. Figure 1 comprises 250 line scans, evenly spaced in the x-direction with 410 points recorded in the y-direction along the length of each scan, forming an 82,000-pixel image.
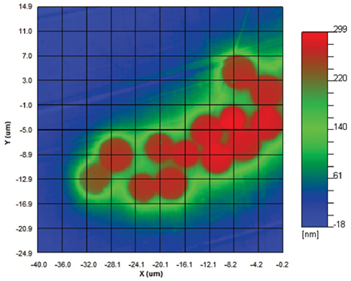
Figure 1. Surface topology of fiberglass via NanoVision scan.Scan force = 10mN; scan time = 179min; image size = 250x450 pixels.
Express Test Results
Figure 2 shows the results of the Express Test indentation array over the same domain as Figure 1. Figure 2(a) displays the elastic modulus, while Figure 2(b) displays the hardness. Only one indentation array was required to obtain the information for both the modulus and hardness maps. In addition to modulus and hardness, other channels are available for mapping, including stiffness, surface elevation, and contact depth. This Express Test comprised an array of 43x43 indents, which makes these maps 1900-pixel images. Testing time was 29minutes - just a little longer than the NanoVision scan.
NOW YOU CAN ALSO PUBLISH YOUR ARTICLE ONLINE.
SUBMIT YOUR ARTICLE/PROJECT AT articles@pharmatutor.org
Subscribe to PharmaTutor Alerts by Email
FIND OUT MORE ARTICLES AT OUR DATABASE
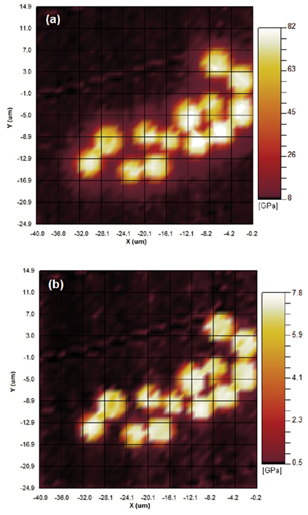
Figure 2. (a) Young’s modulus and (b) hardness maps of fiberglass via Express Test. These images display the results of a single Express Test comprising 1600 individual indents. Max indentation force = 1mN; test time = 29 min; image size = 43x43 pixels.
Figures 3 and 4 show the same information as Figure 2, but in histogram form. Both hardness and modulus show peaks that represent the two components of the fiberglass: the thermoset plastic and the glass fibers. From this information, the properties of the components are deduced and reported in Table 1. The reported properties are reasonable: 71 GPa is a typical modulus for glass, and 9.5 GPa is a reasonable modulus for a stiff polymer.
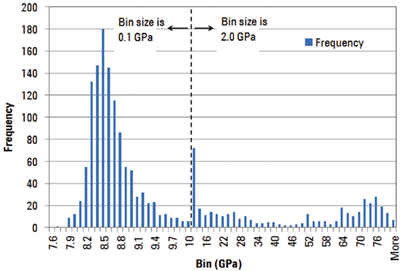
Figure 3. Histogram of 1600 modulus measurements showing peaks for each fiberglass constituent. Intermediate values are affected by both constituents.
|
Component |
Modulus (Std. Dev.) |
Hardness (Std. Dev.) |
|
Thermoset Plastic |
7.40 (0.23) |
0.43 (0.03) |
|
Glass Fiber |
76.69 (4.49) |
7.90 (0.23) |
Table 1. Properties of fiberglass components from Express Test mechanical properties map.
Discussion of Results
Comparison of NanoVision Scan and Express Test
If an image of surface topology is desired, then it is better to perform a NanoVision scan than an Express Test array; however, if quantitative mechanical properties are desired, then it is better to perform an Express Test array. Each technique has its proper usage. For comparable testing times, a NanoVision scan yields a much higher-resolution image than an Express Test array.
In the work presented in this article, Figure 1 (generated by NanoVision alone) comprises 80,000 pixels and Figure 2 (generated by Express Test) comprises only 1600 pixels. With a NanoVision scan, the indenter remains in continuous contact with the surface, but with Express Test, the indenter actually performs a complete indentation cycle (approach, contact detection, load, unload, and movement to the next indentation site) at each point in the array in order to obtain quantitative mechanical properties. In summary, NanoVision is best for basic imaging, but Express Test is the only avenue for obtaining quantitative mechanical properties maps.
Comparison of Modulus Map and Hardness Map
The modulus map shown in Figure 2(a) reveals that the reported values are significantly influenced by constraint effect, especially at the boundaries of the two materials. There is a ‘halo’ around the fibers where the sensed modulus is slightly higher than that of the plastic filler, but still much less than that of the glass. When the indenter contacts the surface in this area, it causes a field of elastic deformation that is large enough to reach the fiber. Thus, the sensed modulus is not just that of the plastic but is influenced by the high modulus of the nearby fiber. This is called constraint effect because the constraining material affects the measured modulus, even when the indenter does not contact it directly.
Actually, constraint effect goes both ways. When the indenter is in contact with a glass fiber, but is near the fiber’s edge, the sensed modulus is lower due to the compliance of the nearby plastic. Constraint effect is also visible in the modulus histogram shown in Figure 3 - the readings between the two peaks are for indents whose elastic fields encounter both materials.
By contrast, the hardness map in Figure 2(b) is strictly bimodal. The properties are either that of the plastic or that of the glass, with very little in between. The hardness histogram shown in Figure 4 also supports this observation (i.e., there are very few readings between that of the plastic and that of the glass). Generally, hardness measurements are less sensitive to constraining material because the field of plastic deformation (which is quantified by the hardness measurement) is much smaller than the field of elastic deformation.
Conclusions
Generally, utilizing the shimadzu NanoVision option alone creates images of surface topology that are more highly resolved, but utilizing the Express Test option (which incorporates NanoVision) provides quantitative mechanical properties mapping, albeit with lower resolution than a NanoVision scan. Express Test was used to perform an array of 43x43 indents in order to map the hardness and elastic modulus of a sectioned fiberglass computer board over a 43µm x 43µm area. The 1900 indents were completed in less than 29 minutes. The measured properties matched expectations for the component materials. As expected, the modulus map manifested constraint effect to a greater degree than the hardness map.
References
1. Crawford, B., "Stiffness Mapping: A Dynamic Imaging Technique," Agilent Technologies, Inc., 2011, Document No: 5990-6329EN, Date Accessed: February 21, 2012; Available from: cp.literature.agilent.com/litweb/pdf/5990-6329EN.pdf.
2. Oliver, W.C. and Pharr, G.M., "An Improved Technique for Determining Hardness and Elastic-Modulus Using Load and Displacement Sensing Indentation Experiments," Journal of Materials Research 7(6), 1564-1583, 1992.
3. Hay, J., "Rapid Characterization of Elastic Modulus and Hardness via Express Test," Agilent Technologies, Inc., 2012, Available from:home.agilent.com/agilent/product.jspx?nid=-34000.0.00&c=186083.i.2&to=79831.g.1&cc=US&lc=eng&pageMode=LB
NOW YOU CAN ALSO PUBLISH YOUR ARTICLE ONLINE.
SUBMIT YOUR ARTICLE/PROJECT AT articles@pharmatutor.org
Subscribe to PharmaTutor Alerts by Email
FIND OUT MORE ARTICLES AT OUR DATABASE


