

 ABOUT AUTHORS
Satish A. Patel, Kaushik P Hariyani*
Department of Quality Assurance, S. K. Patel College of Pharmaceutical Education and Research,
Ganpat University, Ganpat Vidyanagar – 384012, Mehsana, Gujarat, India.
*hariyanikaushik@gmail.com
ABSTRACT
A simple, sensitive, accurate, precise and rapid reverse phase high performance liquid chromatographic method has been developed and validated for the simultaneous determination of Tolperisone hydrochloride and Diclofenac sodium from synthetic mixture. The chromatographic separation was performed on ACE 5 C18 column (150 mm × 4.6 mm i.d, 5 μm particle size). Mobile phase consisted of a mixture of phosphate buffer pH 6, acetonitrile and methanol in the ratio of 10: 50: 40, v/v/v at a flow rate of 0.7 ml/min. The detection wavelength was set at 267 nm. The proposed method was validated for linearity, accuracy, precision, LOD and LOQ. The calibration was linear over the concentration range of 2-30 μg/ml for Tolperisone hydrochloride and 2-30 μg/ml for Diclofenac sodium. The retention times were found to be 2.1 ± 0.14min for Diclofenac sodium and 4.7 ± 0.13min for Tolperisone hydrochloride. The mean recoveries were 100.5 ± 0.34 and 100.8 ± 0.80 for Tolperisone hydrochloride and Diclofenac sodium, respectively. The method can be easily adopted for quality control analysis.
REFERECNE ID: PHARMATUTOR-ART-1717
INTRODUCTION
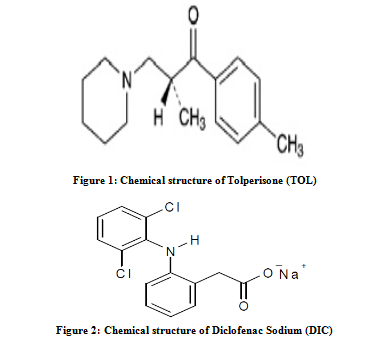
Tolperisone (TOL) is chemically, 2-methyl-1-(4-methylphenyl)-3-(1-piperidyl) propan-1-one (Figure 1) is a well known antispasmodic drug1. It is official in Japanese Pharmacopoeia (JP). JP2 describe potentiometric method for its estimation. Literature survey reveals HPLC3 and UV4 methods for estimation of TOL in single dosage form. Literature survey also reveals HPLC5 and UV spectrophotometry6 methods for determination of TOL with other drugs in combination. Diclofenac sodium (DIC) is chemically, 2-[2,6dichlorophenylamino] benzene acetic acid sodium salt7 (Figure 2). Diclofenac sodium (DIC) is official in IPand BP. IP8 and BP9 describes liquid chromatography method for its estimation. Literature survey reveals HPLC10-11 and UV12 methods for determination of DIC in single dosage form. Literature survey also reveals HPLC13-15, UV spectrophotometry16 and HPTLC17 method for the determination of DIC with other drugs in combination. The combination of these two drugs is not official in any pharmacopoeia; hence no official method is available for the simultaneous estimation of TOL and DIC in their combined dosage forms. Literature survey does not reveal any simple chromatographic method for simultaneous estimation of TOL and DIC in synthetic mixture or dosage forms. The present communication describes simple, sensitive, rapid, accurate, precise and cost effective RP-HPLC method for simultaneous estimation of both drugs in their combined synthetic mixture.
MATERIALS AND METHODS
[adsense:468x15:2204050025]
Apparatus
RP-HPLC instrument (Shimadzu, LC-2010CHT, Japan) equipped with a UV-Visible detector and a photodiode array detector, auto sampler, ACE 5 C18 column (150 x 4.6 mm, 5 µ particle size) was used. Chromatograms were automatically obtained by LC-Solution system software. A Sartorius CP224S analytical balance (Gottingen, Germany), an ultrasonic bath (Frontline FS 4, Mumbai, India), Nylon 0.45 µm – 0.47 mm membrane filter (Gelman Laboratory, Mumbai, India), Whatman filter paper no. 41 (Millipore, USA), Digital pH meter (LI 712 pH analyzer, Elico Ltd., Ahemedabad) were used in the study.
Reagent and materials
TOL and DIC bulk powder was kindly gifted by Torrent Research Centre, Gandhinagar, India and Acme Pharmaceuticals Ltd., Ahmedabad, Gujarat, India respectively.HPLC grade methanol (Merck Ltd., Mumbai, India), HPLC grade acetonitrile (Finar Chemicals Ltd.,Mumbai, India), NaH2PO4 and Na2HPO4 (S. D. Fine Chemicals Ltd., Mumbai, India)were used in the study. Water for RP-HPLC was prepared by triple glass distillation and filtered through a nylon 0.45 µm – 47 mm membrane filter.
Preparation of phosphate buffer solution (pH 6.0)
Phosphate buffer (pH 6) was prepared by dissolving 1.56 g sodium dihydrogen ortho phosphate and 0.35 g disodium hydrogen phosphate in 1000 ml HPLC-grade water.
Preparation of standard stock solutions
An accurately weighed standard TOL and DIC powder (10 mg) were weighed and transferred to 100 ml separate volumetric flasks and dissolved in methanol. The flasks were shaken and volumes were made up to mark with methanol to give a solution containing 100 μg/ml of each TOL and DIC.
Preparation of synthetic mixture
Tolperisone (150 mg) and Diclofenac (50 mg) were taken and then both the drug were mixed with routinely used excipients like starch, lactose, magnesium stearate, and Talc in suitable proportion. Total 500 mg of mixture was prepared and used as synthetic mixture.
Methodology
To optimize the RP-HPLC parameters, several mobile phase compositions were tried. A satisfactory separation and good peak symmetry for TOL and DIC was obtained with a mobile phase consisting of phosphate buffer (pH 6): acetonitrile: methanol (10: 50: 40, v/v/v)at a flow rate 0.7 ml/min to get better reproducibility and repeatability. Quantification was carried out at 267 nm based on peak area. Complete resolution of the peaks with clear baseline was obtained (Figure 3). System suitability test parameters for TOL and DIC for the proposed method are reported in Table 1. Overlain UV spectrum showed that both drugs showed good absorbance at 267 nm, hence the wavelength of 267 nm was selected for quantification of TOL and DIC (Figure 4).
Table 1: System suitability parameters of chromatogram
|
Parameters |
TOL ± RSD (n = 6) |
DIC ± RSD (n = 6) |
|
Retention time (min) |
5.748 ± 0.14 |
2.194 ± 0.13 |
|
Tailing factor |
1.362 ± 0.67 |
1.115 ± 0.54 |
|
Theoretical plates |
4529 ± 0.46 |
2166 ± 0.79 |
|
Resolution |
3.665 ± 0.63 |
|

NOW YOU CAN ALSO PUBLISH YOUR ARTICLE ONLINE.
SUBMIT YOUR ARTICLE/PROJECT AT articles@pharmatutor.org
Subscribe to Pharmatutor Alerts by Email
FIND OUT MORE ARTICLES AT OUR DATABASE
Method Validation
Calibration Curve (Linearity)
Calibration curves were constructed by plotting peak areas Vs concentrations of TOL and DIC and the regression equations were calculated. The calibration curves were plotted over the concentration range 2-30 µg/ml for TOL and 2- 30µg/ml for DIC. Accurately measured standard working solutions of TOL (0.2, 0.5, 1.0, 1.5, 2.0, 2.5, 3.0 ml) and DIC (0.2, 0.5, 1.0, 1.5, 2.0, 2.5, 3.0 ml) from100 µg/ml of stock solution were transferred to a series of 10 ml of volumetric flasks and diluted to the mark with methanol. 20 µl of each solution were injected under the operating chromatographic conditions described above.
Accuracy (% Recovery)
The accuracy of the method was determined by calculating recovery of TOL and DIC by the standard addition method. Known amounts of standard solutions of TOL and DIC (50, 100, and 150 %) were added to pre quantified sample solutions of TOL. The amounts of TOL and DIC were estimated by applying obtained values to the regression equation of the calibration curve.
Method Precision (% Repeatability)
The precision of the Method was checked by repeatedly injecting six sample solutions of TOL (10 μg/ml) and DIC (10 μg/ml) under the same chromatographic condition and measurements of peak area, retention time and tailing factor. Percentage relative standard deviation (RSD) or % coefficient of variation (CV) should not be more than 2.
Intermediate Precision (Reproducibility)
The intraday and interday precision of the proposed method was determined by analyzing the corresponding responses 3 times on the same day and on 3 different days over a period of 1 week for 3 different concentrations of sample solutions of TOL (15, 20, 25 μg /ml) and DIC (15, 20, 25 μg /ml). The results were reported in terms of relative standard deviation (RSD).
Limit of Detection and Limit of Quantification
LOD and the LOQ of the drug were calculated using the following equations as per International Conference on Harmonization (ICH) guidelines18.
LOD = 3.3 × σ/S
LOQ = 10 × σ/s
Where σ = the standard deviation of the response
S = Slope of calibration curve.
Analysis of TOL and DIC in synthetic mixture
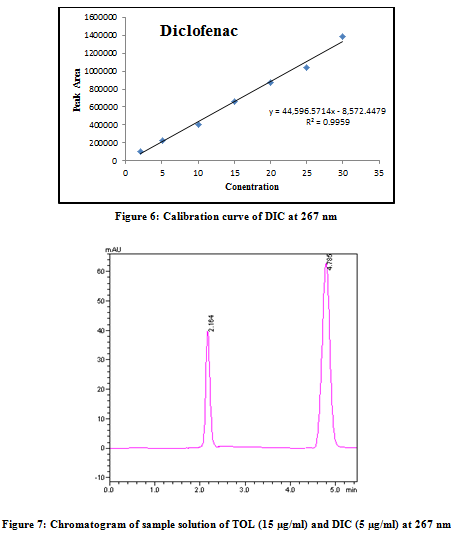
TOL (150 mg) and DIC (50 mg) standard drug powder were accurately weighed and then mixed with commonly used formulation excipients like starch, lactose, DCP, magnesium stearate and talc in appropriate proportion. The mixture was then transferred to 100 ml volumetric flask containing 50 ml methanol and sonicated for 20 min. The solution was filtered through Whatman filter paper No. 41 and the volume was adjusted up to the mark with methanol. The above solution was suitably diluted with methanol to obtain final concentration of 15 µg/ml TOL and 5 µg/ml DIC. Aliquot (20 µl) of sample solution was injected under the operating chromatographic condition as described above and peak area was determined for both drugs. From these area values, the concentrations of TOL and DIC were determined using respective calibration graph. The analysis procedure was repeated six times with synthetic mixture.
RESULTS AND DISCUSSION
A RP-HPLC method was developed and validated for the determination of TOL and DIC in synthetic mixture on ACE 5 C18 column (150 mm x 4.6 mm i.d., 5 µm particle size) with variable wavelength detection at 267 nm. The retention time of DIC and TOL was 2.1 ± 0.14min and 4.7 ± 0.13min, respectively. System suitability test parameters for method are summarized in Table 1. Linear correlation was obtained between area and concentration of TOL and DIC in the concentration range of 2–30 µg/ml for both drugs (Figure 5 & 6). The low RSD value of interday (0.55-1.45 % for TOL and 0.41-1.23 % for DIC) and intraday (0.33-0.73 % for TOL and 0.32-1.18 % for DIC) at 267 nm, reveal that proposed method is precise. The limit of detection (LOD) and limit of quantification (LOQ) for TOL and DIC were found to be 0.4433 and 0.4371 µg/ml and 1.3433 and 1.3248µg/ml, respectively. These data show that method is sensitive for the determination of TOL and DIC. The recovery experiment was performed by the standard addition method. The mean recoveries were 100.5 ± 0.34 and 100.8 ± 0.80 for TOL and DIC, respectively (Table 2). The results of recovery studies indicate that the proposed method is highly accurate. The proposed validated method was successfully applied to determine TOL and DIC in synthetic mixture. No interference of the excipients with the retention time of drugs appeared (Figure 7); hence the proposed method is applicable for the routine simultaneous estimation of TOL and DIC (Table 3). The regression analysis data and summary of validation parameters is summarized in Table 4.
Table 2: Recovery data for the proposed method
|
Drug |
Level |
Amount of sample taken (µg/ml) |
Amount of standard spiked (%) |
Mean% Recovery ± SD |
|
TOL |
I |
6 |
50 % |
101.3 ± 0.59 |
|
II |
6 |
100 % |
99.13 ± 0.12 |
|
|
III |
6 |
150 % |
101.1 ± 0.31 |
|
|
DIC |
I |
2 |
50 % |
100.7 ± 0.91 |
|
II |
2 |
100 % |
101.3 ± 0.44 |
|
|
III |
2 |
150 % |
100.4 ± 1.05 |
Table 3: Analysis of synthetic mixture of TOL and DIC by proposed method (n = 6)
|
Sample No. |
Label Claim |
Amount Found |
% Label Claim |
|||
|
TOL (mg) |
DIC (mg) |
TOL (mg) |
DIC (mg) |
TOL (%) |
DIC (%) |
|
|
1 |
150 |
50 |
150.61 |
50.1 |
100.4 |
100.2 |
|
2 |
150 |
50 |
150.4 |
50.94 |
100.2 |
101.8 |
|
3 |
150 |
50 |
150.9 |
49.5 |
101.2 |
99.00 |
|
4 |
150 |
50 |
149.75 |
49.76 |
99.83 |
99.52 |
|
5 |
150 |
50 |
150.95 |
50.78 |
100.6 |
101.5 |
|
6 |
150 |
50 |
150.5 |
50.8 |
100.3 |
101.6 |
|
Mean |
150.6 |
50.31 |
100.4 |
100.6 |
||
|
S.D. |
0.7129 |
0.6100 |
0.4753 |
1.220 |
||
Table 4: Regression analysis data and summary of validation parameters for RP-HPLC method
|
Parameters |
RP-HPLC method |
|
|
TOL |
DIC |
|
|
Concentration range (µg/ml) |
2-30 |
2-30 |
|
Regression equation Y= mX + c |
Y= 52071.17X– 11668.26 |
Y= 44596.57X– 8572.44 |
|
Correlation coefficient |
0.9969 |
0.9959 |
|
LOD(µg/ml) |
0.4433 |
0.4371 |
|
LOQ(µg/ml) |
1.3433 |
1.3248 |
|
% Recovery (Accuracy, n = 3) |
100.5 ± 0.34 |
100.8 ± 0.80 |
|
Repeatability (% RSD, n = 6) |
0.42 |
0.64 |
|
Precision (%RSD) |
|
|
|
Interday (n = 3) |
0.55 - 1.45 |
0.32 - 1.18 |
|
Intraday (n = 3) |
0.33 - 0.73 |
0.41 - 1.23 |

CONCLUSION
In this proposed RP-HPLC method, the linearity is observed in the concentration range of 2-30 µg/ml for both drugs with co-efficient of correlation, (r2) = 0.9969 and (r2) = 0.9959 for TOL and DIC, respectively at 267 nm. The results of the analysis of synthetic mixture by the proposed method are highly reproducible and reliable. The method can be used for the routine analysis of the TOL and DIC in mixture without any interference of excipients.
ACKNOWLEDGEMENT
The authors are thankful to Torrent Research Centre, Gandhinagar, India and Acme Pharmaceutical Ltd., Ahmedabad, India for providing gift sample of TOL and DIC, respectively for carry out the research work. The authors are highly thankful to S. K. Patel College of Pharmaceutical Education and Research, Ganpat University, Ganpat Vidyanagar – 384012, Mehsana, Gujarat, India for providing all the facilities to carry out the research work.
REFERENCES
1. Maryadele. J. O’ Neil. The Merck Index: An Encyclopedia of chemicals, drugs and biologicals, 13th ed. New Jersey: Published by Merck Research Laboratories, Division of Merck and Co., Inc. Whitehouse station 2006. p. 1698.
2. Japanese Pharmacopoeia. Society of Japanese Pharmacopeia. 15th ed. Shibuya Tokyo Japan 2006.p. 1190-1191.
3. Murali M, Satyanarayana PV. Simple Validated Iso-cratic RP-HPLC method for estimation of Tolperisone in Bulk and Pharmaceutical dosage Form. Der Pharma Chemica 2011; 3:13-19.
4. Koladia BB, Vaghela VM. UV Spectroscopic method for Quantitative Estimation of Tolperisone Hydrochloride in Bulk and Pharmaceutical dosage form. Int J PharmTech Res 2012; 4:1317-1322.
5. Liawruangrath S, Liawruangrath B, Pibool P. Simultaneous Determination of Tolperisone and Lidocaine by HPLC. J Pharm Biomed Anal 2001; 26:865-72.
6. Sharma KK, Patel PU. First derivative Spectroscopic method for Simultaneous Estimation of Paracetamol and Tolperisone in their combined dosage form. J Pharm Sci Bio Res 2012; 2:92-96.
7. Maryadele. J. O’ Neil. The Merck Index: An Encyclopedia of chemicals, drugs and biologicals, 13th ed. New Jersey: Published by Merck Research Laboratories, Division of Merck and Co., Inc. Whitehouse station: 2006. p. 542.
8. Indian Pharmacopoeia. Vol. II. The Controller of Publication. 6th ed. Govt. of India. New Delhi 2010.p. 1199.
9. British Pharmacopoeia. Vol. I. Stationary office. London Medicines and Healthcare product regulatory agency 2010.p. 672.
10. El-sayed YM, Abdel-hameed ME, Suleiman MS, Najib NM. A Rapid and sensitive HPLC method for the Determination of Diclofenac Sodium in Serum. J Pharm Pra 2011; 40:757-729.
11. Mayee R, Rawat S, Thosar A, Atre K, Mane P. Development and validation of HPLC method for Determination of Diclofenac Sodium by Tape Stripping method. Asian J Pharm Bio Res 2011; 1:317-322.
12. Khaskheli AR, Abro K, Sherazi ST, Afridi HI, Mahesar SA, Saeed M. Simpler and Faster Spectrophotometric Determination of Diclofenac Sodium in Tablet, Serum and Urine samples. Pak J Anal Environ Chem 2009; 10:53-58
13. Gowramma B, Rajan S, Muralidharan S, Meyyanathan SN, Suresh B. Validated HPLC method for Simultaneous Estimation of Paracetamol and Diclofenac in Pharmaceutical formulation. Int J of ChemTech Research 2010; 2:676-680.
14. Mulgund SV, Phoujdar MS, Londhe SV, Mallade PS, Kulkarni TS, Deshpande AS et al. Stability indicating HPLC method for Simultaneous determination of Mephenesin and Diclofenac Diethyl amine. Ind J Pharm Sci 2009; 71:35-40.
15. Shinde VM, Desai BS. Simultaneous Estimation of Paracetamol and Diclofenac and Chlorzoxazone by HPLC from Tablet. Ind J Pharm Sci 1995; 57:35-37.
16. Revathi G, Rama Rao N, Venkata SP. Simultaneous UV-spectrophotometric determination and validation of Diclofenac Sodium and Rabeprazole Sodium using Hydrotropic agents in its Tablet dosage form. Int J Drug Dev Res 2012; 4: 316-324
17. Dhaneshwar SR, Bhusari VK. Validated HPTLC method for Simultaneous Quantitation of Diclofenac Sodium and Misoprostol in Bulk drug and formulation. Asian J Pharm Biol Res 2011; 1:15-21.
18. The International Conference on Harmonization. Q2 (R1). Validation of Analytical Procedure Text and Methodology. 2005.
NOW YOU CAN ALSO PUBLISH YOUR ARTICLE ONLINE.
SUBMIT YOUR ARTICLE/PROJECT AT articles@pharmatutor.org
Subscribe to Pharmatutor Alerts by Email
FIND OUT MORE ARTICLES AT OUR DATABASE


