 About Authors:
Y. Kranthi Kumar*, Y.Prathyuha
Department of Pharmaceutical Analysis,
Venkateshwara Institute of Pharmaceutical sciences
Cheralapally, Nalgonda- 508001
*kk16052@gmail.com
Introduction
The present work deals with the studies carried out on the development and validation of RP-HPLC for the Lamivudine. Now a days the solutions have gained a lot of importance due to greater patient acceptability, increased potency, multiple action, fewer side effects and quicker relief.
[adsense:336x280:8701650588]
Reference Id: PHARMATUTOR-ART-1391
Classification of instrumental method of analysis
Most of the instrumental techniques fit in to one of the three principel areas such as
* Spectroscopy
* Electrochemistry
* Chromatography
Spectroscopy
Spectroscopy is the measurement and interpretation of electromagnetic radiation absorbed, scattered, or emitted by atoms , molecules or other chemical species.
Examples:
UV Spetrophotometry, Atomic Spectrometry, Infrared Spectrometry, Raman Spectrometry, Ray Spectrometry, Nuclear Magnetic Resonance Spectrometry, Electron Spin Resonance Spectrometry.
Electrochemistry
In this, each basic electrical measurement of current like resistance and voltage has been measured alone or in combination for analytical purposes.
Examples:
Potentiometry, Voltametric Techniques, Amperometric Techniques, Electrogravimetry and Conductance Techniques.
CHROMATOGRAPHY
The term ‘CHROMATOGRAPHY’ covers the processes of separation of the various species of a mixture on the basis of their distribution characteristics between a stationary and mobile phases, as shown below
Classification of chromatographic methods:
* Gas – solid chromatography
* Gas – liquid chromatography
* Solid – liquid chromatography
Examples: Column chromatography,
Thin layer chromatography
High performance liquid chromatograph
* Liquid- liquid chromatography
Examples: Paper partition chromatography
Column partition chromatography
Different modes of chromatography:
Modes of chromatography are essentialy according to the nature of the interactions between the solute and stationary phases, which may arise from hydrogen bonding, vander walls forces, electrostatic forces or hydrophobic forces or basing on the size of the particles.
Different modes of chromatography are as follows:
Ø Normal phase chromatography
Ø Reversed phase chromatography
Ø Reversed phase- ion pair chromatography
Ø Ion chromatography
Ø Ion –Exchange chromatography
Ø Affinity chromatography
Ø Size Exclusion chromatography
[adsense:468x15:2204050025]
Adsorption chromatography or normal phase chromatography
In the normal phase chromatography, the stationary phase is a polar adsorbent and the mobile phase is generally a mixture of non – aqueous solvents.
The silica structure is saturated with silanol groups at the end. These OH groups are statistically distributed over the whole of the surface. The silanol groups represent the active sites (very polar) in the stationary phase. This forms a weak type of bond with any molecule in the vicinity when any of the following interactions are present.
· Dipole- induced dipole,
· Dipole-dipole,
· Hydrogen bonding,
· π complex bonding,
These situations arise when the molecule has one or several atoms with lone pair electron or a double bond. The absorption strengths and hence k’ values (elution series) increases in the following order. Saturated hydrocarbons < olefins < aromatics < organic halogen compounds < sulphides <ethers <esters < aldehydes and ketons < amines <sulphones <amides < carboxylic acids.
The strength of interaction depends not only on the functional groups in the sample molecule but also on the steric factors. If a molecule has several functional groups, then the most polar one determines the reaction properties.
Chemically modified silica, such as the aminopropyl, cyanopropyl and diol phases are useful alternatives to silica gel as stationary phase in normal phase chromatography.
The aminopropyl and cyanopropyl phases provide opportunities for specific interactions between the analyte and the stationary phases and thus offer additional options for the optimizations of separations. Other advantages of bonded phases lie in their increased homogeneity of the phase surface.
Reverse phase chromatography:
In early days, chromatographers started modifying the polar nature of silanol group by chemically reacting silica with organic silanes. The objective was to make it less polar or non polar, so that polar solvents can be used to separate water- soluble polar compounds.
Since the ionic nature of the chemically modified silica is now reversed i.e. it is non-polar or the nature of the phase is reversed. The chromatographic separation carried out with such silica is referred to as reversed- phase chromatography. The retention of the compounds decreases in the following order: aliphatics >induced dipoles (i.e CCl4) > permanent dipoles (e.g CHCl3) >weak lewis bases (ether, aldehydes. Ketons) > strong lewis bases (amines) > weak lewis acids (alcohols, phenols ) > strong lewis acids (carboxlic acids). Also the retention increases as the number of carbon atom increases.
As the general rule the retention increases with the increasing contact area between sample molecules and stationary phase i.e. with increasing number of water molecules, which are released during the adsorption of a compound. Branched chain compounds are eluted more rapidly than their corresponding normal isomers.
In the reversed phase systems the strong attractive forces between water molecules arising from 3- dimensional inter molecular hydrogen bonded network, from a structure of water that must be distorted or disputed when a solute is dissolved. Only higher polar or ionic solutes can interact with a water structure.
Chemically bonded octadecyl silane (ODS) is alkaline with 18 carbon atoms, it is the most popular stationary phase used in pharmaceutical industry. Since most pharmaceutical compounds are polar and water soluble, the majority of HPLC methods used for quality assurance, decomposition studies, quantitative analysis of both bulk drugs and their formulations use ODS HPLC columns. The solvent strength in reverse phase chromatography is reversed from that of adsorption chromatography (silica gel) as stated earlier. Water interact strongly with silanol groups, so that, adsorption of sample molecules becomes highly restricted and they are rapidly eluted as a result. Exactly opposite applies in reverse phase system; water cannot wet the non polar (hydrophobic) alkyl groups such as C18 of ODS phase and therefore does not interact with the bonded moiety. Hence water is the weakest solvent of all and gives slowest elution rate. The elution time (retention time) in reverse phase chromatography increases with increasing amount of water in the mobile phase.
Various Types and Applications of HPLC
|
TYPE |
SAMPLE POLARITY |
MOLECULAR WEIGHT RANGE |
STATIONARY PHASE |
MOBILE PHASE |
|
Adsorption |
non-polar to somewhat polar |
100 - 104 |
silica or alumina |
non-polar to polar |
|
Partition (reversed-phase) |
non-polar to somewhat polar |
100 - 104 |
non-polar liquid adsorbed or chemically bonded to the packing material |
relatively polar |
|
Partition (normal-phase) |
somewhat polar to highly polar |
100 - 104 |
highly polar liquid adsorbed or chemically bonded to the packing material |
relatively non-polar |
|
Ion Exchange |
highly polar to ionic |
100 - 104 |
ion-exchange resins made of insoluble, high-molecular weight solids functionalized typically with sulfonic acid (cationic exchange) or amine (anionic exchange) groups |
aqueous buffers with added organic solvents to moderate solvent strength |
|
Size-Exclusion |
non-polar to ionic |
103 – 106 |
small, porous, silica or polymeric particles |
polar to non-polar |
High-Performance Liquid Chromatography (HPLC)
Introduction
High-performance liquid chromatography (HPLC) is a form of liquid chromatography to separate compounds that are dissolved in solution. HPLC instruments consist of a reservoir of mobile phase, a pump, an injector, a separation column, and a detector. Compounds are separated by injecting a plug of the sample mixture into the column. The different components in the mixture pass through the column at different rates due to differences in their partition behavior between the mobile liquid phase and the stationary phase.
Advantages of HPLC
* High resolution and speed of analysis
* HPLC columns can be used without repackaging.
* Greater reproducibility of +/- 1% due to close control of parameters effecting efficiency of separation
* Easy automation of instrument operation and data analysis
* Adaptability to large scale pre operative procedures
* High sensitivity (ng to fg)
* Greater accuracy and speed.
Principle of separation in HPLC
1. Adsorption chromatography
2. Partition chromatography
3. Ion exchange chromatography
4. Size exclusion or gel permeation chromatography
NOW YOU CAN ALSO PUBLISH YOUR ARTICLE ONLINE.
SUBMIT YOUR ARTICLE/PROJECT AT articles@pharmatutor.org
Subscribe to PharmaTutor Alerts by Email
FIND OUT MORE ARTICLES AT OUR DATABASE
Types of HPLCtechniques
i) Based on Modes of Chromatography
(a) Normal Phase chromatography
(b) Reverse Phase chromatography
ii) Based on principle of separation
(a) Adsorption chromatography
(b) Ion exchange chromatography
(c) Ion pair chromatography
(d) Size exclusion chromatography
(e) Affinity chromatography
(f) Chiral phase chromatography
iii) Based on elution technique
(a) Isocratic separation
(b) Gradient separation
iv) Based on the scale of operation
(a) Analytical HPLC
(b) Preparative HPLC
(c) RP-HPLC
Instrumentation
Solvents must be degassed to eliminate formation of bubbles. The pumps provide a steady high pressure with no pulsating, and can be programmed to vary the composition of the solvent during the course of the separation. Detectors rely on a change in refractive index, UV-VIS absorption, or fluorescence after excitation with a suitable wavelength.
High performance liquid chromatography (HPLC) is the fastest growing analytical technique for the analysis of drugs. Its simplicity, high specificity and wide range of sensitivity makes it ideal for the analysis of many drugs in both dosage forms and biological fluids. In HPLC the separation is about 100 times faster than the conventional liquid chromatography due packing of stationary phase particles in the range of 5-10µm.
Functional description of the instrument
- Mobile phase reservoir, filtering
- Pumps
- Columns
- Injector
- Detector
- Data systems
Schematic of an HPLC instrument
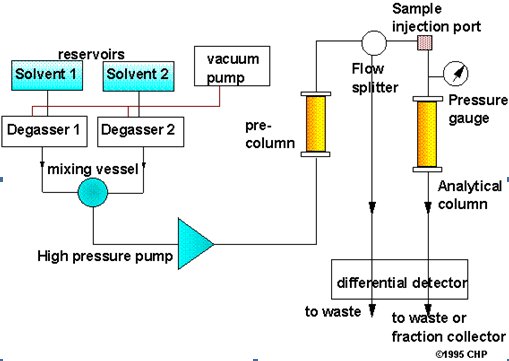
System components
Solvent delivery system
The mobile phase is pumped under pressure from one or several reservoirs and flows through the column at a constant rate. Eluting power of the mobile phase is determined by its overall polarity, the polarity of the stationary phase and the nature of the sample components. For normal phase separation the eluting power increases with the increasing polarity of the solvent but for the reversed phase separations , eluting power decreases with increasing solvent polarity. Optimum separating conditions can be achieved by making use of mixture of two solvents. Some other properties of the solvents, which need to be considered for a successful separation, are boiling point, viscosity, detector compatibility, flammability and toxicity.
The most important component of HPLC in solvent delivery system is the pump, because its performance directly effects the retention time, reproducibility and detector sensitivity. Among the several solvent delivery systems (direct gas pressure, pneumatic intensifier, reciprocating etc.) reciprocating pumps with twin or triple pistons is widely used, as this system gives less baseline noise. Good flow rate reproducibility etc.
Solvent degassing system
The constituents of the mobile phase should be degassed and filtered before use. Several methods are employed to remove the dissolved gases in the mobile phase. They include heating and stirring, vacuum degassing with an aspirator, filtration through 0.45 filters, vacuum degassing with an air-soluble membrane, helium purging ultra sonication or purging or combination of these methods. HPLC systems are also provided an online degassing system which continuously removes the dissolved gases from the mobile phases.
Isocratic and gradient elution
HPLC columns may be run isocratically, i.e., with constant eluent or they may be run in the gradient elution mode in which the mobile phase composition varies during run. Gradient elution is a means of overcoming the problem of dealing with a complex mixture of solutes.
Sample introduction systems
Two ways for analyte introduction on the column are injected into a flowing stream and a stop flow injection. These techniques can be used with a syringe or an injection valve. Automatic injector is a microprocessor-controlled version of the manual universal injector. Usually, up to 100 samples can be loaded into the auto injector tray. The system parameters such flow rates, gradient, run time, volume to be injected, ect. are chosen, stored in memory and sequentially executed on consecutive injections
Liquid chromatographic detectors
The function of the detector in HPLC is to monitor the mobile phase as it emerges from the column. Generally, there are two types of HPLC detectors, bulk property detectors and solute property detectors
Bulk property detectors
These detectors are based on differential measurement of a property, which is common to both sample and the mobile phase. Examples of such detectors are refractive index, conductivity and dielectric constant detectors.
Solute property detectors
Solute property detectors respond to a physical property of the solute, which is not exhibited by the pure mobile phase. These detectors measures a property, which is specific to the sample, either with or without the mobile phase prior the detection. Solute property detectors which do not require the removal of the mobile phase before detection include spectrophotometric,UV detector, fluorescence detectors, whilst the moving wire flame ionization detector and electron capture detector. Both require removal of the mobile phase before detection.
UV and fluorescent detectors are suitable for the gradient elution, because many solvents used in HPLC do not absorb to any significant extent.
Column and column packing materials
The heart of the system is the column. In order to achieve high efficiency of separation, the column material (micro-particles, 5-10µm size) packed in a such a way that the highest numbers of theoretical plates are possible.
Silica (SiO2 ×H2O ) is the mostly widely used substance for the manufacture of the packing materials. It consist of a network of siloxane linkages (Si –O-Si) in a rigid three dimensional structure connecting inter connecting pores.
The silanol group on the surface silica gives it a polar character, which is exploited in adsorption chromatography using non-polar organic eluents. Silica can be drastically altered by reaction with organo chloro silanes or organo alkoxy silanes giving Si-O-Si-R linkages with the surface.
The attachment of hydrocarbon to silica produces a non polar surface suitable for reversed phase chromatography where mixtures of water and organic solvents are used as eluents. The most popular material is octadecyl-silica (ODS- SILICA), which contains C18 chains, but materials with C2,C6,C8 and C22 chains are also available. During manufacture, such materials may be reacted with small mono functional silane( e.g. trimethyl chloro silane)to reduce further the number of Silanol groups remaining on the surface (end-capping). There is a vast range of materials which have intermediate surface polarities arising from the bonding to silica of another organic compounds which contains groups such as phenyl, nitro, amino and hydroxyl. Strong ion exchangers are also available in which sulphonic acid groups or quaternary ammonium groups are bonded to silica. The useful pH range for columns is 2 to 8, siloxane linkages are cleaved below PH-2 while at PH values above 8, silica may dissolve.
In HPLC, generally two types of columns are used, normal phase columns and reversed phase columns. Using normal phase chromatography, particularly of non- polar and moderately polar drugs can make excellent separation. It was originally believed that separation of compounds in mixture takes place slowly by differential adsorption on a stationary silica phase. However, it now seems that partition plays an important role, with the compounds interacting with the polar silanol groups on the silica or with bound water molecules.
While normal phase seems the passage of a relatively non-polar mobile phase over a polar stationary phase, reversed phase chromatography is carried out using a polar mobile phase such as methanol, acetonitrile, water, buffer, etc., over a non polar stationary phase. Ranges of stationary phases (C18, C8. –NH2, -CN, -Phenyl etc.)are available and very selective separation can be achieved. The PH of the mobile phase can be adjusted to suppress the ionization of the drug and there by increase the retention on the column. For highly ionized drugs ion-pair chromatography is used.
Performance calculations
Calculating the following values used to access overall system performance.
1. Relative retention
2. Theoretical plates
3. Capacity factor
4. Resolution
5. Peak asymmetry
6. Plates per meter
The following diagram shows the parameters used to calculate these system performance values for the separation of the two chromatographic components. (NOTE: where the terms W and t both appear in the same equation they must be expressed in same units).
Relative retention (selectivity):
α = (t2-ta)/(t1-ta)
Theoretical plates:
n = 16(t/W)2
Capacity factor:
k’= (t2/ta)-1
Resolution:
R = 2(t2-t1)/(w2+w1)
Peak asymmetry:
T = w0.05/2f
Plates per meter:
N = n/L
HEPT: L/n
Where, α = Relative retention.
T2 = Retention time of the second peak measured from point of injection.
T1 = Retention time of the first peak measured from point of injection.
Ta = Retention time of an inert peak not retained by the column, measured from point of injection.
n = Theoretical plates.
T = Retention time of the component.
W = Width of the base of the component peak using tangent method.
K’= Capacity factor.
R = Resolution between a peak of interest (peak 2) and the peak preceding (peak1)
W2 = Width of the base of component peak 2.
W1= Width of the base of component peak 1.
T = Peak asymmetry, or tailing factor.
W0.05 = Distance from the leading edge to the tailing edge of the peak, Measured at a point 5% of the peak height from the baseline.
f = distance from the peak maximum to the leading edge of the peak.
N = plates per meter.
L = column length, in meters.
NOW YOU CAN ALSO PUBLISH YOUR ARTICLE ONLINE.
SUBMIT YOUR ARTICLE/PROJECT AT articles@pharmatutor.org
Subscribe to PharmaTutor Alerts by Email
FIND OUT MORE ARTICLES AT OUR DATABASE
Methods Quantitative Analysis in chromatography1
The sample or solute is analyzed quantitatively by either peak height or peak area measurements. Peak areas are proportional to the amount of constant rate. Peak heights are proportional to the amount of material only when peak width are constant and are strongly affected by the sample injection techniques. Once the peak height or the peak area are measured, there are five principles evaluation method for quantifying the solute.
a) Calibration by standards
Calibration curves for each component are prepared from standards, using identical injection volumes of operating conditions for standards and samples. The concentration of solute is read from its curve if the curve is linear.
X = K × Area
Where, X= concentration of solute
K=Proportionality constant ( slope of the curve)
b) Internal standard method
In this technique a known quantity of the internal standard is chromatographed and area vs concentration is ascertained. Then a quantity of the internal standard is added to the raw sample prior to any sample pretreatment or separation operations.
The peak area of the standard in the sample run is compared with the peak when the standard is run separately. This ratio serves as a correction factor variation in sample size, for losses in any preliminary pretreatment operations, or for incomplete elution of the sample. The material selected for the internal standard must be completely resolved from adjacent sample components, must not interfere with sample components and must be present in samples.
Area ratio = Area of the sample
——————————
Area of internal standard
Sample concentration = Area ratio of the sample
——————————
Area ratio of standard
C) Area normalization
The technique is often used for the sample having identical components. It is used to evaluate the absolute purity of the sample. The procedures are to total up the areas under all peaks and then calculate the percentage of the total area that is contributed by the compound of interest. For this method the entire sample must be eluted, all components must be separated and each peak must be completely resolved.
d) Standard addition method
If only few samples are to be chromatographed, it is possible to employ the method of standard additions. The chromatogram of the unknown is recorded, then a known amount of analytes is added and the chromatogram is repeated using same reagents, instruments and other conditions. From the increase in the peak area(or peak height), the original concentration can be computed by interpolation.
The detector response must be linear function of analyte concentration and yield no signal at zero concentration of the analyte. Sufficient time must elapse between addition of the standard and actual analysis to allow equilibrium of added standards with any matrix interferant.
e) External standard method
It employs a separate injection of a fixed volume of sample and standards solution. The peaks are integrated and concentration is calculated.
Sample concentration = Peak area of the sample × Concentration of standard.
——————————
Peak area of standard
DRUG PROFILE
Name : Lamivudine
Synonyms : L-2’,3’-dideoxy-3’-thiacyatidine, Epivir, Combivir.
Molecular formula : C8H11N3O3S
Structure:
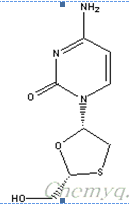
Molecular weight : 229.26g/mol
Physical state : White, crystalline powder
Solubility : Freely soluble in water.
Stability : Preserve in well-closed, light-resistant containers. Store at room temperature
Content : 150 GRAM In 1 PACKET
Loss on drying : Not more than 0.5%
Heavy metal : 20ppm
Melting point : Between 172'.to 178'c
Purity : not less than 98.0 percent and not more than 102.0 percent
PH : Between 3.4 to 3.8 in a solution (1 in 10)
Water : Not more than 0.2 %
MECHANISM OF ACTION:
The mechanism of action of lamivudine which inhibits both types of HIV reverse transcriptase and also reverse transcriptase of Hepatitis B. It is phosphorylated to active metabolites that compete for incorporation into viral DNA. They inhibit the HIV reverse transcriptase enzyme competitively and act as a chain terminator of DNA synthesis. The lack of a 3’-OH group in the incorporated nucleoside analogue prevents the formation of the 5’-3’ phosphodiester linkage essential for DNA chain elongation, and therefore, the viral DNA growth is terminated.
INDICATIONS:
EPIVIR® tablets are used for antiviral activity, it is an antiviral agent which inhibits the reverse transcriptase enzyme in virus.
DOSAGE AND ADMINISTRATION:
For adults with HIV (or children over 12), the dose is 300mg once daily, or 150mg twice a day. Lamivudine is never used on its own in the treatment of HIV.
For the treatment of adults with hepatitis B, the dose is 100mg once daily. If co-infected with HIV, then the dose is as for HIV.
For a child 3 months to 12 years old, about 1.4-2 mg per lb. of body weight twice a day, no more than 150 mg per dose. Lamivudine is administered orally and dosage form are available in form of tablets.
ANTI VIRAL ACTIVITY:
Lamivudine exerts antiviral activity, it is an analogue of cytosine. It is used for HIV mutants that are resistant to both the drug itself as well as other reverse transcriptase inhibitor.
It inhibits in the reverse transcriptase enzyme production in virus which helps in the DNA synthesis.
USES:
This medication may also be used to prevent HIV infection after contact with the virus. A lower-strength lamivudine product is used for hepatitis B infection in people without HIV infection. This drug is used with other medications to help control your HIV infection, thereby improving your quality of life. It may also lower your risk of complications from HIV (such as new infections, cancers). Lamivudine belongs to a class of drugs known as nucleoside reverse transcriptase inhibitors-NRTI.
SIDE EFFECTS:
Headache, dizziness, nausea, diarrhea, or trouble sleeping may occur. Changes in body fat (such as increased fat in the upper back and stomach areas, decreased fat in the arms and legs) may occur while you are taking HIV medication. The cause and long-term effects of these changes are unknown. Many people using this medication do not have serious side effects.
REVIEW OF LITERATURE
* Rohit Loomba, MBBS, MHSc stated that Lamivudine, a nucleoside analogue, effectively suppresses HBV replication, reduces levels of HBV DNA in serum, and improves liver injury in patients with chronic hepatitis B. Lamivudine also has an excellent long-term safety profile and is generally well tolerated. Several studies reported a beneficial effect of lamivudine in preventing HBV reactivation and HBV-related death in patients who tested positive for HBsAg and are undergoing chemotherapy. However, the quantitative benefits of preventive therapy with lamivudine have not been carefully defined. The magnitude of response to lamivudine for preventing morbidity and mortality in this clinical setting has direct implications for both clinicians and health policymakers. The research synthesis discussed here explored the following question: Does preventive lamivudine therapy reduce the risk for HBV reactivation, HBV-related hepatitis, acute hepatic failure due to HBV, or HBV-related death in patients who test positive for HBsAg.
* T.Susha,stated that a simple, precise, accurate, RP-HPLC method has been developed for the estimation of Lam and Aba in bulk and in tablet formulation. A Shimadzu HPLC system with Luna phenomenax C18 column was used for analysis optimization of mobile phase was performed based on resolution, tailing factor and peak area obtained for both Lam and Aba. The mobile phase was methanol: water (70: 30 v/v/) was gave two symmetric and well resolved peaks for both Lam and Aba. The resolution between Lam and Aba was found to be 4.13minutes which indicates good separation of both the components. The retention time for Lam and Aba were 2.259 and 3.499 respectively. The UV detection was carried out as 275nm as Lam and Aba showed very good absorbance at this wavelength.
* S. STRAUCH, stated that biowaiver is judged acceptable for new single API lamivudine multisource products and also major post-approval changes to marketed products, provided that (a) the test product contains only excipients present in lamivudine IR solid oral drug products approved in the International Conference on Harmonization.
* Anbarasi B, stated that A new gradient HPLC and UV methods has been developed and validated for the determination of assay of lamivudine in oral pharmaceutical formulation. Different kinds of columns and gradient elution programs were tested in order to achieve satisfactory separation between the active substance, and an interfering excipients used in the formulation. The best results were obtained using a Wakosil C-18 column 250 mm X 4.6mm, 5 μ, UV detection at 230 nm and a isocratic elution of phosphate buffer (0.02 M, pH 3.67) and Acetonitrile as the mobile phase. Both methods were validated with respect to linearity, precision, accuracy, specificity and robustness LOQ and LOD. It was also found to be stability indicating, and therefore suitable for the routine analysis of lamivudine in the pharmaceutical formulation.
* Umesh M. Patel, stated that A simple, rapid, precise, and accurate stability-indicating, reversed phase (RP) HPLC assay method was developed and validated for simultaneous estimation of Lamivudine (3TC) and Stavudine (d4T) in bulk drugs and commercial tablets. The retention times for lamivudine and stavudine were found to be 13.66 and 16.51 min respectively Lamivudine (3TC), stavudine (d4T) and their combination drug product were subjected to acid, base and neutral hydrolysis, oxidation, thermal and photolytic stress conditions and the stressed samples were analyzed by the proposed method. Validation of the method was carried out as per ICH guidelines.
AIM AND OBJECTIVE OF THE WORK
Pharmaceutical industries rely upon quantitative chemical analysis to ensure that the raw materials used and the final products obtained meet the required specification.
Lamivudine is used orally and it is rapidly absorbed with a bio-availability of over 80%. Lamivudine is often given in combination with zidovudine, with which it is highly synergistic. Lamivudine treatment has been shown to restore zidovudine sensitivity of previously resistant HIV.
Existing literature reveals that analytical methods like Ion exchange chromatography, thin layer ion exchange chromatography, and UV, which are quite expensive when compared to HPLC. Therefore, the present study has been undertaken in order to develop a new simple, rapid, efficient and reproducible RP-HPLC method for the analysis of Lamivudine.
PLAN OF WORK
An attempt was made in a stepwise manner to device a simple, rapid, selective, validated and sophisticated method, like, High Performance Liquid Phase Chromatography (Reverse Phase) for Aripiprazole. The following stepwise protocol was followed
- As a start up, literature survey was done and from the literature survey chemical profile like solubility, chemical structure and analytical profile was obtained.
- From the data obtained, UV spectroscopic study was tried in the first place. Placebo interference was found and hence the study failed.
- Later several trials were done in RP-HPLC using a different combination of mobile phases and finally a method was optimized.
- After the optimization of the HPLC method, validation of the analytical method for the developed RP-HPLC method was done in accordance with ICH guidelines.
Method development
During the optimization stage, the initial sets of conditions that have evolved from the stages of development are improved or maximized in terms of resolution and peak shape, plate count asymmetry, capacity, elution, detection limits, limits of quantification, and overall ability to quantify the specific analysts of interest.
Optimization of a method can follow either of two general stages:
1. Manual
2. Computer driven
The manual approach involves varying one experimental variable at a time, while holding all other constant,and recording changes in response. The variables might include flow rates, mobile or stationary phase composition, temperature, detection wavelength, and PH. This univariate approach to system optimization is sloe, time consuming and potential expensive. However, it may provide a much better understanding of the principles and theory involved and of interaction of the variables.
In the second approach, computer driven automated method development, efficiency is optimized while experimental input is minimized. Computer driven automated approaches can be applied to many applications. In addition, they are capable of significantly reducing the time, energy and cost of virtually all instrumental method development.
The various parameters that include to be optimized during method development
1. Mode of separation
2. Selection of stationary phase
3. Selection of mobile phase
4. Selection of detector
NOW YOU CAN ALSO PUBLISH YOUR ARTICLE ONLINE.
SUBMIT YOUR ARTICLE/PROJECT AT articles@pharmatutor.org
Subscribe to PharmaTutor Alerts by Email
FIND OUT MORE ARTICLES AT OUR DATABASE
1. Selection of mode of separation
In reverse phase mode, the mobile phase is comparatively more polar than the stationary phase. For the separation of polar or moderately polar compounds, the most preferred mode is reverse phase. The nature of the analyte is the primary factor in the selection of mode of separation. A second factor is the nature of the matrix.
2. Selection of stationary phase/ column
Selection of the column is the first and the most important step in method development .The appropriate choice of separation column include three different approaches they are as follows:
1. Selection of separation system
2. The partical size and the nature of the column packing.
3. The physical parameters of the column i.e . the length and diameter.
Some of the important parameters considered while selecting chromatographics columns are:
§ Length and diameter of the column
§ Packing material
§ Shape of the particles
§ Size of the particles
§ %of carbon loading
§ Pore volume
§ Surface area
§ End capping
The column is selected depending on the nature of the solute and the infoemation about the analyte. Reversed phase mode of chromatography facilitates a wide range of column like dimethy siliane (c2 ),butylsilane(c4), octylsilane(c8 ) octaecylslane(c 18 ), base deactivated silane (c18 ) BDSphenyl, cyanopropyl (CN) nitro amino etc. Xterra RP 18 was chosen for this study since it is most retentive one.
Generally longer columns provide better separation due to high theoretical plate numbers. As the particle size decreases the surface area available for coating increases. Column with 5.0µm particle size give the best compromise of efficiency, reproducibility and reliability. In this case, the column selected had a particle size of 5.0µm and a internal diameter of 4.6×250mm.
Peak shape is equally important in method development. Columns that provide symmetrical peaks are always preferred while peaks with poor asymmetry can result in,
* Accurate plate number and resolution measurement
* Imprecise quantitation
* Degraded and undetected minor bands in the peak tail
* Poor retention reproducibility
A useful and pratical measurement of peak shape is peak asymmetry factor and peak tailing factor. Peak asymmetry is measured at 10%of full peak height and peak tailing factor at 5%. Reproducibility of retention times and capacity factor is important for developing a rugged and repeatable method.
A column which gives separation of all the impurities and degradants from each other and from analyte peak and which is rugged for variation in mobile phase shall be selected.
3. Selection of mobile phase
The primary objective in selection and optimization of mobile phase is toachieve optimum separation of all individual impurities and degradants from each other and from analyte peak.In liquid chromatography, the solute retention is governed by the solute distribution factor, which reflects the different interactions of the solute - stationary phase, solute – mobile phase and the mobile phase – stationary phase. For a given stationary phase, the retention of the given solute depends directly upon the mobile phase, the nature and the composition of which has to be judiciously selected in order to get appropriate and required solute retention. The mobile has to be adapted in terms of elution strength (solute retention). Solvent polarity is the key word in chromatographic separations since a polar mobile phase will give rise to low solution retention in normal phase and solution retention in reverse phase LC.
The selectivity will be particularly alerted if the buffer pH is close to the pKa of the analytes; the solvent strength is a measure of its ability to pull analyte from the column. It is generally controlled by the concentration of the solvent with the highest strength.
The following are the parameters, which shall be taken into consideration while selecting and optimizing the mobile phase.
· Buffer
· pH of the buffer
· Mobile phase composition.
3.1 Buffer, if any and its length:
Buffer and its strength play an important role in deciding the peak symmetries and Separations. Some of the most, commonly employed buffers are
* Phosphate buffers prepared using salts like KH2PO4, K2HPO4, NaH2PO4, Na2HPO4, etc
* Phosphoric acid buffers prepared using H3.PO4.
* Acetate buffers – Ammonium acetate, Sodium acetate, etc.
* Acetic acid buffers prepared using CH3COOH.
The retention times also depend upon on the molar strengths of the buffer – molar strength is increasingly proportional to retention times. The strength of the buffer can be increased, if necessary, to achieve the required separations.
The solvent strength is a measure of its ability to elute analytes from the column. It is generally controlled by the concentration of the solvent with the highest strength.
3.2 PH of the buffer
PH plays an important role in achieving the chromatographic separation as it controls the elution properties by controlling the ionization characteristics. Experiments were conducted using buffers having different PH to obtain the required separations.
It is important to maintain the PH of the mobile phase in the range of 3.8 to 8.0 as most columns does not withstand to the PH which are outside this range. This is due to the fact that siloxane linkages area cleaved below PH.0, while PH valued above 8.0 silica may dissolve.
3.3 Mobile phase composition
Most chromatographic separations can be achieved by choosing the optimum mobile phase composition. This is due to that fact that fairly large amount of selectivity can be achieved by choosing the qualitative and quantitative composition of aqueous and organic portions. Most widely used solvents in reverse phase chromatography are methanol and acetonitrile. Experiments were conducted with mobile phase having buffers with different ph and different organic phases to check for the best separations between the impurities. A mobile phase which gives separation of the impurities and degradants from each other and from analyte peak which is rugged for variation of both aqueous and organic phase by at least ±0.2%of the selected mobile phase composition.
4. Selection of detector
The detector was chosen depending upon some characteristic property of the analyte like UV absorbance, fluorescence, conductance, oxidation, reduction ect., characteristics that are to be fulfilled by a detector to be used in HPLC determination are,
* High sensitivity, facilitating trace analysis
* Negligible baseline noise. To facilitate lower detection
* Large linear dynamic range
* Low dead volume non destructive to sample
* Inexpensive to purchase and operate
Pharmaceutical ingredients do not all absorb UV light equally, so that selection of detection wavelength is important. An understanding of the UV light absorptive properties of the organic impurities and the active pharmaceutical ingredients is very helpful.
For the greatest sensitivity should be used. UV wavelengths below 200nm should be avoided because detector noise increases in this region. Higher wavelengths give greater selectivity.
Method validation
Method validation can be defined as (ICH) Establishing documented evidence, which provides a high degree of assurance that a specific activity will consistently produce a desired result or product meeting its predetermined specifications and quality characteristics.
Method validation is an integral part of the method development; it is the process of demonstrating that analytical procedures are suitable for their intended use and that they support the identity, quality, purity, and potency of the drug substances and the drug products. simply, method validation is the process of proving that an analytical method is acceptable for its intended purpose. Method validation is the process used to confirm that the analytical procedure employed for a specific test is suitable for its intended use. Results from method validation can be used to judge the quality, reliability and consistency of analytical results; it is an integral part of any good analytical practice.
Method development, however, is generally a one-time process performed after the method has been development to demonstrate that the method is scientifically sound and that it serves the intended analytical purpose.
All the variables of the method should be consider, including sampling procedure, sample preparation, chromatographic separation, and detection and data evaluation. The USP has published specific guidelines for method validation for compound evaluation (7). USP defines eight steps for validation:
* Accuracy
* Precision
* Specificity
* Limit of detection
* Limit of quantitation
* Linearity and range
* Ruggedness
* Robustness
Analytical Procedure
The analytical procedure refers to the way of performing the analysis. It should describe in detail the steps necessary to perform each analytical test. This may include but is not limited to: the sample, the reference standard and the reagents preparations, use of the apparatus generation of the calibration curve, use of the formulae for the calculation, etc.
Accuracy
The accuracy of an analytical procedure expresses the closeness of agreement between the value which is accepted either as a conventional true value or an accepted reference value and the value found.
This is sometimes termed trueness. Accuracy is best report as percentage bias, which is calculated from the expression
Accuracy = (Measured value – True value) × 100
True value
Since for real samples the true value is not known, an approximation is obtained based on spiking drug- free matrix to a normal concentration. The accuracy of analytical method is then determined at each concentration by assessing the agreement between the measured and nominal concentrations of the analtytes in the spiked drug- free matrix sampler.
Precision
The precision of an analytical procedure expresses the closeness of agreement (degree of scatter) between a series of measurements obtained from multiple sampling of the same homogeneous sample under the prescribed conditions. Precision may be considered at three levels: repeatability, intermediate precision and reproducibility.
The precision of an analytical procedure is usually expressed as the percentage coefficient of variation (%CV), or relative standard deviation (RSD) of the replicate measurements.
%CV = Standard deviation × 100
Mean
Precision can be considered as having a within assay batch component or repeatability which defines the ability to repeat the same methodology with the same analyst, using the same equipment and same reagents in a short interval of time, eg., with in a day.
The ability to repeat the same methodology under different conditions, eg., change of analyst, reagent or equipment, or on subsequent occasions, eg across several weeks or months, is covered by the between batch precision or reproducibility, also know as inter-assay precision.
The reproducibility of the method gives better representation of the precision during routine use as it includes the variability from many sources.
Repeatability
Repeatability expresses the precision under the same operating conditions over a short interval of time. Repeatability is also termed intra-assay precision.
Intermediate precision
ntermediate precision expresses within-laboratories variations: different days, differentanalysts, different equipment, etc.
Reproducibility
Reproducibility expresses the precision between laboratories (collaborative studies, usually applied to standardization of methodology).
Specificity
Specificity is the ability to assess unequivocally the analyte in the presence of components which may be expected to be present. Typically these might include impurities, degradants, matrix, etc
Lack of specificity of an individual analytical procedure may be compensated by other supporting analytical procedure(s).
This definition has the following implications:
Identification: To ensure the identity of an analyte.
Purity Tests: To ensure that all the analytical procedures performed allow an accurate statement of the content of impurities of an analyte, i.e. related substances test, heavy metals, residual solvents content, etc.
Detection Limit
The detection limit of an individual analytical procedure is the lowest amount of analyte in a sample which can be detected but not necessarily quantitated as an exact value. it may be defined as the concentration, which gives rise to an instrumental signal that is significantly different from the blank. For spectroscopic techniques or other methods that rely upon a calibration curve for quantitative measurements, the IUPAC approach employs the standard deviation of the intercept (Sa), which may be related to LOD and the slope of the calibration curve , b, by
LOD = 3 Sa/b
Quantitation Limit
The quantitation limit of an individual analytical procedure is the lowest amount of analyte in a sample which can be quantitatively determined with suitable precision and accuracy. The quantitation limit is a parameter of quantitative assays for low levels of compounds in sample matrices, and is used particularly for the determination of impurities and/or degradation products.
The LOQ represent the concentration of analyte that would yield a signal- to- noise ratio of 10.
LOD=10 Sa/b
Where Sa- the estimate is the standard deviation of the peak are ratio of analyte to IS (5 injections) of the drugs. b is slope of the corresponding calibration curve.
Linearity
The linearity of an analytical procedure is its ability (within a given range) to obtain testresults which are directly proportional to the concentration (amount) of analyte in the sample.
Range
The range of an analytical procedure is the interval between the upper and lower concentration (amounts) of analyte in the sample (including these concentrations) for which it has been demonstrated that the analytical procedure has a suitable level of precision, accuracy and linearity.
Robustness
The robustness of an analytical procedure is a measure of its capacity to remain unaffected by small, but deliberate variations in method parameters and provides an indication of its reliability during normal usage such as ph of the mobile phase, temperature, %organic solvent strength and buffer concentration etc. to determine the robustness of the method experimental conditions were purposely altered and chromatographic characters were evaluated.
Ruggedness
Method ruggedness is defined as the reproducibility of results when the method is performed under actual use conditions. This includes different analyts, laboratories, columns, instruments source of reagents, chemicals, solvents etc. Method ruggedness may not be know when a method is first developed, but insight is obtained during subsequent use of that method.
NOW YOU CAN ALSO PUBLISH YOUR ARTICLE ONLINE.
SUBMIT YOUR ARTICLE/PROJECT AT articles@pharmatutor.org
Subscribe to PharmaTutor Alerts by Email
FIND OUT MORE ARTICLES AT OUR DATABASE
Estimation of Lamivudine by RP-HPLC
ANALYTICAL TEST METHODS:
INSTRUMENTATION:
WATERS High performance liquid chromatography system consisting of a pump, an injector, PAD/UV absorption detector and a suitable integrator with empower software.
OTHER EQUIPMENT USED:
- Volumetric flask and pipettes
- Ultrasonic bath
- Analytical balance
- 0.2µm Nylon membrane filter.
STANDARDS:
1.1 USP Lamivudine RS
1.2 USP Lamivudine Resolution Mixture A RS.
1.3 USP Lamivudine Resolution Mixture B RS.
REAGENTS AND CHEMICALS:
· Methanol HPLC grade
· Monobasic Potassium phosphate
· Water- Milli Q grade
ASSAY METHOD OF LAMIVUDINE OPTIMIZED CHRTOGOMARAPHIC CONDITIONS
The summary of the method parameters were given below.
|
Mobile phase |
0.1 M Ammonium acetate solution Methanol |
|
Column |
Xterra RP 18, 4.6 x250mm,5.0µm particle size Manufacturer: Waters., Part no.:186000496 |
|
Flow Rate |
1.0mL/min |
|
Column Temp. |
Ambient |
|
Sample Temp. |
Ambient |
|
Wave length |
270nm |
|
Injection volume |
20µL |
|
Run Time |
20Minutes |
|
Retention Time |
About 2.5 minutes for Lamivudine |
|
System suitability |
The RSD of peak area is NMT 2.0% for the Lamivudine peak. |
MOBILE PHASE
PREPARTION OF BUFFER
Weighabout 7.7 g of ammonium acetate in water, and dilute with water to 1000 mL and We get 0.1M ammonium acetate solution.
PREPARATION OF MOBILE PHASE
Mix 87 volumes of Buffer and 13volumes of Methanol a suitable container. Filter the mobile phase through 0.2µm Nylon membrane filter, degas.
PREPARATION OF STANDARD SOLUTION
Weigh accurately and transfer about 25mg of USP Lamivudine Reference standard into a 25 mL volumetric flask. Add about 15 ml of Diluent and sonicate to dissolve. Dilute to volume with diluent. Mix well.( Lamivudine standard concentration of about 1000µg/mL).
PREPARATION OF SAMPLE SOLUTION
Constitute the solution as directed in the labelling. Transfer an accurately measured volume of the constituted solution, equivalent to 100mg of Lamivudine, to a100ml volumetric flask, dilute it about 70 ml of diluents and mix well. Then mixed up the volume with diluents.(Lamivudine Sample concentration of about 1000µg/mL).
PROCEDURE:
Inject 20µl of blank, standard solution (5 Replicates) and sample preparation (Duplicate) into the chromatographic system and record the chromatogram.
SYSTEM SUITABILITY:
The Relative standard deviation for replication injections is not more than 2.0% obtained from standard solution.
CALCULATIONS:
% Assay (w/w) on anhydrous basis:
AT × WS × 100 × 1000 × P × 100 × 100
AS 25 VT LC 100 (100-MC)
Where,
AT = Average peak area of the Lamivudine from the chromatogram of the sample preparation.
AS = Average area of the Lamivudine peak from the chromatograms of the standard Preparation
WS = Weight of USP Lamivudine RS taken (in mg).
P = Purity of USP Lamivudine RS in per cent, on as is basis.
MC = Moisture content for sample
LC = Label claim in g/ packet.
VT =Volume of sample of reconstituted solution taken
Validation:
For validating the developed method the parameters like linearity, range, suitability, system precision and assay (recovery studies) are studied. The validation procedures are carried out as follows.
Linearity and range:
The linearity of the analytical procedure is its ability (with in given range) to obtain the test results with are directly proportional to the concentration of analyte in the sample.
Linearity was assessed by performing single measurement at several analyte concentrations. A minimum of seven concentrations were recommended for linearity studies.
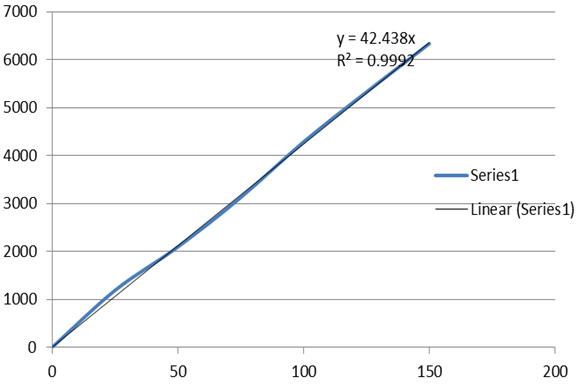
To evaluate the linearity range of Lamivudine, varying concentrations of standard solution s is diluted ranging from 50% to 150% of the target concentration (1000µg/ml) were injected into HPLC system. The linearity graph was plotted from 50% to 150%. A calibration curve was constructed for each sample by plotting the peak area obtained the concentration.
The linearity data for Lamivudine are presented as follows. The data are tabulated in table 1
Table 1
Linearity data for Lamivudine
|
s.no |
Concentration(µg/ml) |
Peak area response |
|
1 |
0 |
0 |
|
2 |
25 |
1187.7543 |
|
3 |
50 |
2095.215 |
|
4 |
75 |
3125.7569 |
|
5 |
100 |
4287.0637 |
|
6 |
125 |
5326.4865 |
|
7 |
150 |
6334.9675 |
From the data obtained correlation coefficient, y-intercept and slope were calculated to provide mathematical estimates of linearity for Lamivudine and tabulated in table 1a
Table 1a
Analytical performance parameters of Lamivudine
|
Linear regression Analysis |
Lamivudine con. In µg/ml vs. peak area |
|
Correlation coefficient ( r2) |
0.9992 |
|
Slope (m) |
42.5 |
|
y- intercept (c) |
4.40 |
System precision:
A standard solution was prepared as per the method and injected. Peak area responses for five (5) replicate injections of the standard solution were recorded. The values of peak and percentage relative standard deviation are calculated and results are tabulated in table 2
Table 2
System precision study of Lamivudine
|
S NO |
PEAK AREA RESPONSE |
|
1 |
2038.855 |
|
2 |
2045.051 |
|
3 |
2050.750 |
|
4 |
2056.462 |
|
5 |
2058.793 |
|
MEAN |
2049.98 |
|
%RSD |
0.27 |
Method precision:
Precision of the assay method was determined by injecting, in duplicate, six (6) individual samples of Lamivudine. The samples were prepared as per the method. The results are tabulated in table 3
Table 3
Method precision study of Lamivudine
|
SNO |
% ASSAY |
|
1 |
99.47 |
|
2 |
99.35 |
|
3 |
99.59 |
|
4 |
99.41 |
|
5 |
99.28 |
|
6 |
99.82 |
|
MEAN |
99.48 |
|
%RSD |
0.19 |
Specificity:
Blank, standard , Lamivudine sample, spiked sample, Individual Impurity were prepared and injected into the chromatographic system for identification and impurity interference with the Lamivudine peak. The blank and Impurity interference are tabulated in table 4.
Table 4
Blank and Impurity interference
|
Sample ID |
Interference |
Retention time |
|
Blank |
Nil |
NA |
|
Lamivudine related Compound A |
Nil |
2.56 |
Table 5
Peak purity of Lamivudine
|
Sample name |
Purity angle |
Purity threshold |
|
Spiked name |
0.191 |
1.052 |
System precision ruggedness:
The standard solutions prepared by analyst-1 and analyst -2 are injected in different HPLC systems, on different day, using a different column. The system suitability parameters calculated by analyst -2 can be compared with those of Analyst -1.
They are tabulated in table 6.
Table 6
System precision ruggedness study of Lamivudine
|
|
Analyst-1 |
Analyst-2 |
|
SNO |
PEAK AREA RESPONSE |
PEAK AREA RESPONSE |
|
1 |
2038.855 |
2191.090 |
|
2 |
2045.051 |
2184.273 |
|
3 |
2050.750 |
2190.041 |
|
4 |
2056.462 |
2191.038 |
|
5 |
2058.793 |
2191.613 |
|
MEAN |
2049.98 |
2189.61 |
|
%RSD |
0.27 |
0.10 |
Method precision ruggedness:
The sample solutions prepared by Analyst-1 and Analyst-2 are injected in different HPLC systems, on a different day, using a different column. The assay values calculated by Analyst-2 can be compared with those of Analyst-1 are tabulated in table 7.
NOW YOU CAN ALSO PUBLISH YOUR ARTICLE ONLINE.
SUBMIT YOUR ARTICLE/PROJECT AT articles@pharmatutor.org
Subscribe to PharmaTutor Alerts by Email
FIND OUT MORE ARTICLES AT OUR DATABASE
Table 7
Method precision ruggedness study of Lamivudine
|
S.NO |
Analyst-1 |
Analyst-2 |
|
|
%Assay |
%Assay |
|
1 |
99.47 |
99.64 |
|
2 |
99.35 |
99.73 |
|
3 |
99.59 |
99.85 |
|
4 |
99.41 |
100.14 |
|
5 |
99.28 |
100.04 |
|
6 |
99.82 |
99.99 |
|
MEAN |
99.48 |
99.90 |
|
%RSD |
0.19 |
0.19 |
Solution stability:
The Lamivudine precision sample and standard solutions were prepared. Replicate injections of the standard solution were made at the following time intervals: initial, 24 hours. The values were compared to initial standard area and they are tabulated in table 8.
Sample solution were injected at 24 hours time interval, and %area difference was compared to the initial area generated by these samples and are tabulated in table 9.
Table 8
Solution stability of Lamivudine
|
Initial area |
24 hours area |
%are difference |
|
2049.982 |
2057.378 |
0.25 |
Table 9
Solution stability of Lamivudine
|
Initial area |
24 hours area |
% area difference |
|
2000.226 |
2018.187 |
0.61 |
SUMMARY OF STRESS STUDY RESULTS:
The sample is digested with Acid, Base, Hydrogen peroxide and also subjected to UV and light under specific conditions to see how it will react and results are Tabulated in table 10
Table 10 Stress study of Lamivudine
|
Stress condition |
Purity Angle |
Purity Threshold |
|
Control sample |
0.169 |
1.041 |
|
Acid(5 ml 5N NaOH at 800 c for 3 hrs) |
0.177 |
1.044 |
|
Base(5 ml 5N NaOH at 80o c for 3 hrs) |
0.165 |
1.043 |
|
Oxidation(5ml30% H2O2 at 80o for 90 min) |
0.137 |
1.074 |
|
Heat ( 80oC for 3 hrs) |
0.170 |
1.028 |
|
UV Light (48 hrs) |
0.168 |
1.030 |
Robustness:
The robustness is a measure of method capacity to remain unaffected by small, deliberate variation in method parameters and provides an indication of method reliability during normal use.
Assay standard was prepared and injected into the chromatographic system as per the conditions specified in the method.
The same standard was re-injected by changing one parameter at a time, keeping other parameters constant.
A set of system suitability data was calculated for standard injected under altered method conditions and compared against the values generated under normal method conditions. The retention time peak area and % RSD was calculated and tabulated in table 11
Table 11
Robustness study of Lamivudine
|
Parameters |
RT(n=5) |
Peak area(n=5) |
%RSD |
|
|
Normal |
2.851 |
2049.982 |
0.27 |
|
|
1.0ml/min |
2.523 |
2053.490 |
0.04 |
|
|
Flow rate(1.2ml/min |
1.4ml/min |
2.643 |
2025.159 |
0.08 |
|
Column temperature |
300C |
2.740 |
2042.320 |
0.09 |
|
Buffer Ph(2.5) |
pH 2.7 |
2.510 |
2033.687 |
0.16 |
|
pH 2.3 |
2.605 |
2048.182 |
0.15 |
|
|
Mobile phase(87:13) |
85:15 |
2.593 |
2024.403 |
0.13 |
|
89:11 |
2.645 |
2055.850 |
0.11 |
|
Figure 1 Typical Chromatogram of Lamivudine.
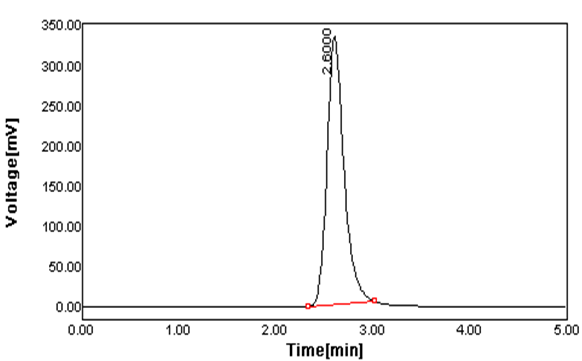
Peak Results:
|
S.NO |
Name |
Vial |
Injections |
R.T. (min) |
Area(UV2sec) |
% Area |
|
1. |
Lamivudine |
4 |
2 |
2.600 |
2002.356 |
100 |
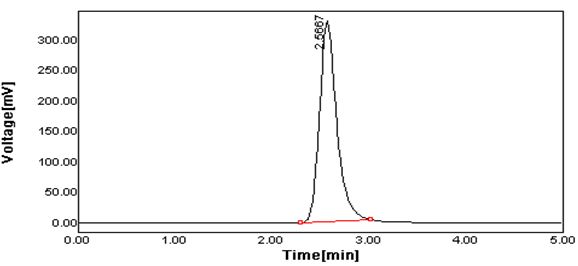
Figure 2 Typical Chromatogram of Lamivudine.
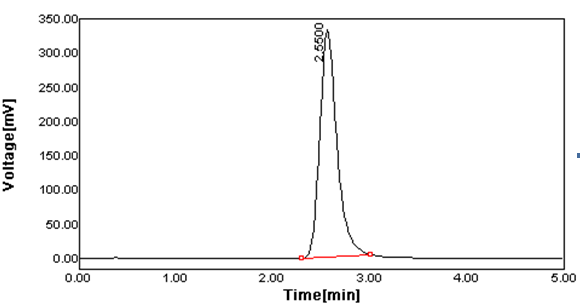
Peak Results:
|
S.NO |
Name |
Vial |
Injections |
R.T. (min) |
Area(UV2sec) |
% Area |
|
1. |
Lamivudine |
4 |
2 |
2.550 |
2038.855 |
100 |
Figure 3 Typical Blank Chromatogram of Lamivudine.
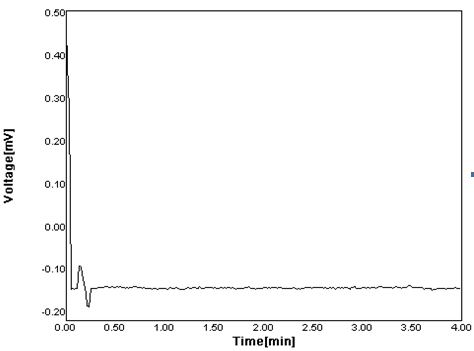
Figure 4 Typical Chromatogram of Lamivudine of Spiked sample.
Peak Results:
|
S.NO |
Name |
Vial |
Injections |
R.T. (min) |
Area(UV2sec) |
% Area |
|
1. |
Lamivudine |
42 |
1 |
2.566 |
2058.793 |
95.15 |
Figure 5 Linearity plot of Lamivudine.
RESULTS AND DISCUSSION
After several trails with various solvents, mobile phase system composed of Methanol and Water in the proportion of 87:13 respectively was chosen for method development and validation of Lamivudine for oral solution form by RP-HPLC. This mobile phase composition offered maximum resolution for the drug at the detection wavelength of 270nm.
Mobile phase with the flow rate of 1.2mL/min gave optimum separation with good resolution between the peaks. A reverse phase Xterra RP 18 column was used as stationary phase. The retention time of Lamivudine solution was found to be 2.6 minutes respectively. The total time of analysis was less than 20 minutes.
The value of percentage relative standard deviation for Lamivudine was found to be 0.71 respectively.
From the calibration curve constructed by plotting concentration vs. peak area, it was found that there exist a linear relationship in the concentration range of 50% to 150% for Lamivudine (table1), with 0.9996 as the value of correlation coefficient (table 1a).
For system precision studies, the standard solution was prepared at working concentration and analysis was carried at replicate. The percentage relative standard deviation was calculated for the peak area of each drug and it was found to be 0.27 for Lamivudine (table 2).
For method precision, the sample solution at working concentration was analysed in replicate as per assay method. The percentage relative standard deviation for the assay value was found to be 0.19 for Lamivudine respectively in (table3).
For Specificity studies the blank, standard solution, spiked sample, individual impurity were prepared and injected. The study demonstrates that no significant interference occurs from blank, degradation products or any know impurities at the retention time of Lamivudine (table 4). and peak purity analysis of the Lamivudine peaks also demonstrates peak homogeneity (table5).
Results of the ruggedness study validate that the method is reproducible under normal variation in operating conditions. The mean assay values obtained by two analysts are on anhydrous basis 99.48 % and 99.90 % respectively .The RSD of six(6) assay values is 0.19%.They are tabulated in (table 6 and 7).
Solution stability study demonstrates that the standard solution and the sample solution are stable up to 24 hrs. when stored at room temperature. The Area difference between the initial and 24 hrs of the standard and sample are calculated and are found to be 0.25 and 0.16. They are tabulated in (table 8 and 9).
The forced degradation data taken for the impurities and degradants method validation are reported in (table 10).
Results of the robustness study validated that the method is unaffected by small, deliberate changes to the method conditions of flow rate, column operating temperature, buffer pH , and organic content of mobile phase, as evidenced by system suitability. The results are tabulated in (table 11).
SUMMARY AND CONCLUSIONS
The results of proposed RP-HPLC method are summarized in table 12
TABLE 12
Summary for RP-HPLC for Lamivudine
|
Parameter |
Observation |
|
Lamivudine |
|
|
Label claim (gm/packet) |
150 |
|
Linearity range(µg/ml) |
25 to 150 |
|
Correlation coefficient (NTM 0.999) |
0.9998 |
|
System precision %RSD (NMT 2%) |
0.27 |
|
Method precision % RSD (NTM 2%) |
0.19 |
|
System precision Ruggedness |
0.27 and 0.10 |
|
Method precision Ruggedness |
0.19 and 0.19 |
|
Solution stability of standard and sample (Difference between Initial and 24 hrs) |
0.25 and 0.61 |
OVERALL CONCLUSION
The proposed RP-HPLC method for assay of Lamivudine is precise, linear over the concentration range, rugged. The method is robust with respect to variation in column temperature, floe rate buffer pH, and organic content of the mobile phase. The method is specific for the quantification of percentage Lamivudine present in Lamivudine solutions and sample solution are stable up to 24 hours when stored at room temperature. These methods are validated as per ICH guidelines.
Hence, this method can be easily and conveniently adopted for routine analysis of Lamivudine.
REFERENCES
1. Gurdeep chatwal,k. Anand , Instrumental methods of Chemical Analysis, 5th edition, Himalaya publishing house, New Delhi, 2002, 1,1-1.8, 2.566-2.570
2. William Kemp, Organic Spectroscopy, Palgrave, New York, 2005,7-10,328-330
3. D.A. Skoog.F.J. Holler and T.A. Nieman, principle of Instrumental Analysis, 5th edition, Saunders college Publishing,1998 778-787
4. A recent book provides a comprehensive treatment of the theory of high-performance gradient chromatography: Lloyd R. Snyder and John W. Dolan (2006). High-Performance Gradient Elution: The Practical Application of the Linear-Solvent-Strength Model. Wiley Interscience.
5. P.D. Senthi, HPLC: Quantitative Analysis Pharmaceutical Formulations, CBS Publishers distributors New Delhi(India), 2001, 3-137
6. H.H.Willard, L.L. Merritt, J.A.Dean, F.A.Settel, Instrumental Method of Analysis, 7th edition, CBS Publishers distributors New Delhi(India). 1986,518-521, 580-610.
7. ICH Hormonised triparitate guidelines.
8. A.John Adamovies, Chromatographic Analysis of Pharmaceutical, Marcel Dekker New York, 2nd Edition 74, 5-15
9. Behnam Davani, Ph.D , Pharmaceutical Analysis-7 USP 28-NF 23 page 1160: Pharmaceutical Forum:Volume No. 30(4) page 1258
10. Elnaz F. Firoz, Bahar F. Firoz, James F. Williams, Jeffrey S. Henning Allergic contact dermatitis to mafenide acetate Journal of Drugs in Dermatology, August, 2007, Pharmacopeial Forum:Volume No.30(4)Page 1258
11. S. R. McKenna , B. A. Latenser Serious silver sulphadiazine and mafenide acetate dermatitis
12. Howard S. Yaffee, MD; Donald P.Dressler, MD Topical Application of Mafenide Acetate Arch Dermatol. 1969;100(3):277-281.
13. R. Pendleton, J. Holmes IV Systemic absorption of amphotericin B with topical 5% mafenide acetate/amphotericin B solution for grafted burn wounds Burns, Volume 36, Issue 1, Pages 38-41
14. Paulson D, Eastman T, Bottini PB. Activity of Mafenide Acetate 5% Solution Against Nosocomial Pathogens [serial online] 2004:3(7).
15. Basir Hashemi, MD, Akbar Bayat, Comparison between topical honey and mafenide acetate in treatment of auricular burns.
16. Murphy RC, Kucan JO, Robson MC, Heggers JP. The effect of 5% mafenide acetate solution on bacterial control in infected rat burns. October 1983 - Volume 23 - Issue .
17. Pickus, Evan J. MD; Lionelli, Gerald T. MD 204Mafenide Acetate Allergy Presenting as Recurrent Chondritis Volume 48 - Issue 2 - pp 202-204.
18. Kucan, John O. MD; Smoot, E. Clyde MD Five Percent Mafenide Acetate Solution in the Treatment of Thermal Injuries March/April 1993 - Volume 14 - Issue 2.
19. Alekha K. Dash and Jennifer S. HarrisonIon-pair chromatographic method for the analysis of mafenide acetate Journal of Chromatography A.Volume 708, Issue 1, 28 July 1995, Pages 83-88.
20. M.L. Bieganowska, A. Petruczynik and A. Doraczynska-Szopa Thin-layer reversed-phase ion-pair chromatography of some sulphonamidesJournal of Pharmaceutical and Biomedical Analysis.Volume 11, Issue 3, March 1993, Pages 241-246.
21. R. M. Smith, R. J. Burgess, Buffered superheated water as an eluent for reversed-phase high performance liquid chromatography J. Chromatogr. A785, 49 (1997).
APPENDIX LIST OF ABBREVATION AND UNITS
RP- HPLC Reverse Phase High Performance Liquid Chromatography
UV Ultra – Violet
I.P Indian Pharmacopoeia
B.P British Pharmacopoeia
Mg Milligram
Gms Grams
L Liter
Ml Milliliter
µ Micron
µg Microgram
µl Micro Liter
µm Milli Micron
RS Resolution
R Retention Factor
Rt Retention Time
N Number of Theoretical plates
Conc Concentration
S.D Standard Deviation
%RSD Percentage Relative Standard Deviation
R2 Correlation Coefficient
ODS Octa Decyl silane
V/V Volume/Volume
m Slope
c Intercept
MP Mobile phase
AR Analytical Reagents
GR Grade
Std Standard
Wt Weight
Avg Average
NOW YOU CAN ALSO PUBLISH YOUR ARTICLE ONLINE.
SUBMIT YOUR ARTICLE/PROJECT AT articles@pharmatutor.org
Subscribe to PharmaTutor Alerts by Email
FIND OUT MORE ARTICLES AT OUR DATABASE