

About Authors:
Amit A. Patel
Seth G. L. Bihani S.D. College of Technical Education,
Institute of Pharmaceutical Sciences and Drug Research,
Sri Ganganagar, Rajasthan, INDIA.
amitpatelmx@gmail.com
ABSTRACT:
Chromatography may be defined as method of separating a mixture of components into individual component through equilibrium distribution between two phases. chromatography is based on the differences in the rate at which components of mixture moves through a porous medium ( called stationary phase ) under the influence of some solvent or gas ( called moving phase ). Graph showing detector response as a function of a time is called Chromatogram. The true separation of two consecutive peak on a chromatogram is measured by resolution.
[adsense:336x280:8701650588]
Reference Id: PHARMATUTOR-ART-1550
1. INTRODUCTION TO CHROMATOGRAPHY
Chromatography is non destructive procedure for resolving a multi-component mixture of trace, minor, or major constituents into its individual fraction. While chromatography may be applied both quantitatively, it is primarily a separation tool.
However final identification usually requires confirmation by some other analytical procedure such as infrared spectroscopy, nuclear magnetic resonance or mass spectrometry. Chromatrography can be used for the quantitative and qualitative analysis.
Chromatography is relatively new technique which was first invented by M. Tswett, a botanist in 1906 in Warsaw.
Few methods of chemical analysis are truly specific to a particular analyte. It is often found that the analyte of interest must be separated from the myriad of individual compounds that may be present in a sample. As well as providing the analytical scientist with methods of separation, chromatographic techniques can also provide methods of analysis. 7
2. DEFINITION OF CHROMATOGRAPHY
Chromatography may be defined as method of separating a mixture of components into individual component through equilibrium distribution between two phases.
Essentially, the technique of chromatography is based on the differences in the rate at which components of mixture moves through a porous medium ( called stationary phase ) under the influence of some solvent or gas ( called moving phase ).
Chromatography involves a sample (or sample extract) being dissolved in a mobile phase (which may be a gas, a liquid or a supercritical fluid). The mobile phase is then forced through an immobile, immiscible stationary phase. The phases are chosen such that components of the sample have differing solubilities in each phase. A component which is quite soluble in the stationary phase will take longer to travel through it than a component which is not very soluble in the stationary phase but very soluble in the mobile phase. As a result of these differences in mobilities, sample components will become separated from each other as they travel through the stationary phase.
Techniques such as H.P.L.C. (High Performance Liquid Chromatography) and G.C. (Gas Chromatography) use columns - narrow tubes packed with stationary phase, through which the mobile phase is forced. The sample is transported through the column by continuous addition of mobile phase. This process is called elution. The average rate at which an analyte moves through the column is determined by the time it spends in the mobile phase.7,6
[adsense:468x15:2204050025]
3. BASIC CHROMATOGRAPHIC TERMINOLOGY
* Chromatograph: Instrument employed for a chromatography.
* Stationary phase: Phase that stays in place inside the column. Can be a particular solid or gel-based packing (LC) or a highly viscous liquid coated on the inside of the column (GC).
* Mobile phase: Solvent moving through the column, either a liquid in LC or gas in GC.
Eluent: Fluid entering a column.
Eluate: Fluid exiting the column.
* Elution: The process of passing the mobile phase through the column.
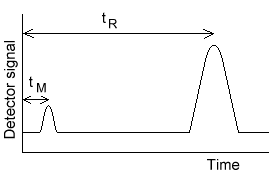
* Chromatogram: Graph showing detector response as a function of a time.
* Flow rate: How much mobile phase passed / minute (ml/min).
* Linear velocity: Distance passed by mobile phase per 1 min in the column.3
The chromatographic method of separation, in general, involves the following steps:
1. Adsorption or retention of a substance or substance on the stationary phase.
2. Separation or the retention of a substance by the mobile phase.
3. Recovery of the adsorbed substances by a continuous flow of the mobile phase; the method being called elution.
4. Qualitative and quantitative analysis of the eluted substances.
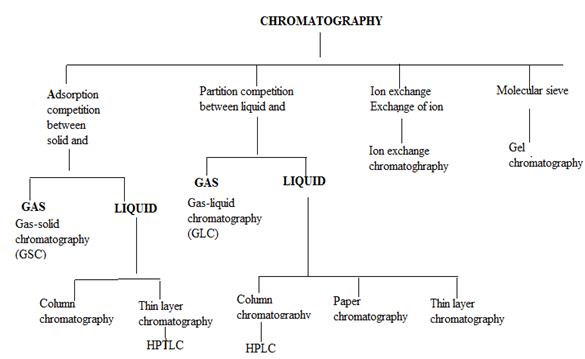
4. CLASSIFICATION OF CHROMATOGRAPHIC METHODS
In all types of chromatography, separation of components of a mixture results either by adsorption or partition for the column material. Binding of compound to the surface of solid phase take place in adsorption while in case of partition, a compound gets distributed into two liquid phases. The chromatographic methods are classified as;
4.1 Partition chromatography:6
This involves liquid or gas as mobile phase and another liquid or solid as stationary phase.
The operation includes:
(a) Partition column chromatography.
(b) Paper chromatography.
(c) Thin layer chromatography.
(d) Gas-liquid chromatography.
(e) High performance liquid chromatography.
4.2 Adsorption chromatography:
This involves liquid or gas as mobile phase and adsorbent solid as stationary phase. The type under this category includes:
(a) Adsorption column chromatography.
(b) Thin layer chromatography.
(c) Solid-liquid chromatogrraphy
(d) Gas-solid chromatography.
NOW YOU CAN ALSO PUBLISH YOUR ARTICLE ONLINE.
SUBMIT YOUR ARTICLE/PROJECT AT articles@pharmatutor.org
Subscribe to Pharmatutor Alerts by Email
FIND OUT MORE ARTICLES AT OUR DATABASE
Alternatively, chromatographic operations can be classified as follows:6
5. Distribution of analytes between phases
The distribution of analytes between phases can often be described quite simply. An analyte is in equilibrium between the two phases;
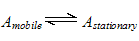
Partition coefficient
If the mobile phase flow is stopped at any time, the solute assumes an equilibrium distribution between the two phases. The concentration in each phase is given by the thermodynamic partition coefficient;
K = CS/CM
Where CS and CM are the concentration of solute in the stationary and mobile phases, respectively. When K = 1, then solute is equally distributed between the two phase.
For a symmetrical peak, when the peak maximum appears at the column exist, half of the solute has eluted in the retention volume, VR , and half remain distributed between the volume of the mobile phase,VM , and the volume of the stationary phase, VS , thus,
VRCM = VMCM + VSCS
Rearrangement and combination with upper equation,
VR = VM + K VS
It relates the retention volume of solute to the column dead volume and the product of the partition coefficient and the volume of stationary phase. This equation correct for liquid partition column, but for adsorption column, VS should be replaced by AS, the surface area of the adsorbent.1
Partition ratio
The partition ratio K’ ,is the most important quality in column chromatography. For a given set of operating parameter,K’ is a measure of the time spent in the stationary phase relative to the time spent in the mobile phase. It is defined as the ratio of moles of solutes in the stationary phase to the moles in the mobile phase: 4
k' =CSVS/CMVM = K( VS/VM)
the volumetric ratio , VM/VS, is often denoted by symbol β. Thus , K’ = K/β.
Stated another way, the partition ratio is the additional time a solute band takes to elute , as compared with an un retain solute divided by the elution time of an unretain band.
k'= t R - tM / tM = VR - VM / VM
the relation states explicity how many dead volume ( or tM ) are required to attain VR (or tR).1
6. COLUMN EFFICIENCY
Column efficiency is measured by the number of theoretical plates. the original theory of chromatography i.e. plate theory was able to describe the effect of variables that influence the migration rate in quantitative terms. However plate theory is unable to describe the effect of factor which are responsible for band broadening. Hence plate theory is now supplemented by rate theory.
6.1 plate theory
The plate model supposes that the chromatographic column is contains a large number of separate layers, called theoretical plates. Separate equilibrations of the sample between the stationary and mobile phase occur in these "plates". The analyte moves down the column by transfer of equilibrated mobile phase from one plate to the next.
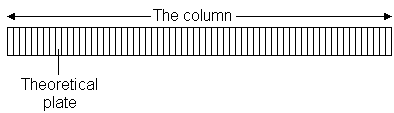
It is important to remember that the plates do not really exist; they are a figment of the imagination that helps us understand the processes at work in the column.They also serve as a way of measuring column efficiency, either by stating the number of theoretical plates in a column, N (the more plates the better), or by stating the plate height; the Height Equivalent to a Theoretical Plate (the smaller the better).
If the length of the column is L, then the HETP is
HETP = L / N
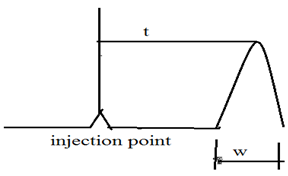
The separation efficiency of chromatographic column increases with increases number of theoretical plates. Thus the number of theoretical plates ‘N’ is used as measure of column efficiency. Theoretical plates can be easily measured from the chromatogram. the number of theoretical plates ‘N’ is given by
N = 16 (t/w)2
Where ‘t’ is the distant from injection to peak maximum ( retention time ) and ‘W’ is the peak width in units of time.
Now,
HETP = L/N = L/16(w/t)2
Where “L” is the length of chromatographic column, in centimeter. Thus, HETP and N are the preferred measures of column efficiency.4
6.2 Ratetheory
A more realistic description of the processes at work inside a column takes account of the time taken for the solute to equilibrate between the stationary and mobile phase (unlike the plate model, which assumes that equilibration is infinitely fast). The resulting band shape of a chromatographic peak is therefore affected by the rate of elution. It is also affected by the different paths available to solute molecules as they travel between particles of stationary phase. If we consider the various mechanisms which contribute to band broadening, we arrive at the Van Deemter equation for plate height;
HETP = A + B / u + C u
where u is the average velocity of the mobile phase. A, B, and C are factors which contribute to band broadening.
NOW YOU CAN ALSO PUBLISH YOUR ARTICLE ONLINE.
SUBMIT YOUR ARTICLE/PROJECT AT articles@pharmatutor.org
Subscribe to Pharmatutor Alerts by Email
FIND OUT MORE ARTICLES AT OUR DATABASE
A-Eddy diffusion
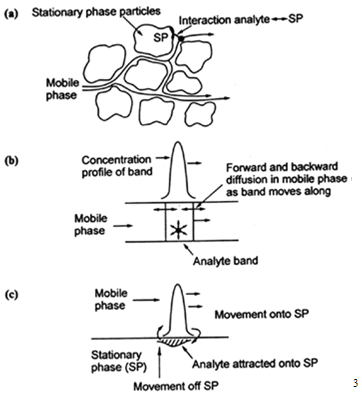
The mobile phase moves through the column which is packed with stationary phase. Solute molecules will take different paths through the stationary phase at random. This will cause broadening of the solute band, because different paths are of different lengths.
B-Longitudinal diffusion
The concentration of analyte is less at the edges of the band than at the center. Analyte diffuses out from the center to the edges. This causes band broadening. If the velocity of the mobile phase is high then the analyte spends less time on the column, which decreases the effects of longitudinal diffusion.
C-Resistance to mass transfer
The analyte takes a certain amount of time to equilibrate between the stationary and mobile phase. If the velocity of the mobile phase is high, and the analyte has a strong affinity for the stationary phase, then the analyte in the mobile phase will move ahead of the analyte in the stationary phase. The band of analyte is broadened. The higher the velocity of mobile phase, the worse the broadening becomes.
Van Deemter plots;
A plot of plate height vs. average linear velocity of mobile phase
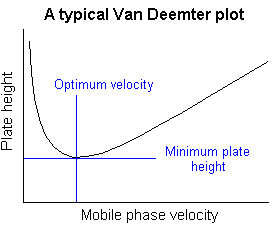
Such plots are of considerable use in determining the optimum mobile phase flow rate. 4
7. RESOLUTION
The true separation of two consecutive peak on a chromatogram is measured by resolution. It is the measure of both the column and solvent efficiencies and account for both the narrowness of the peak and the separation between maxima.
A solute with a retention time of 5 min has a width of 12 s at the base.
A neighboring peak is eluted at 5.4 min with a width of 16 s.
What is the resolution for those two components?
Resolution of two peaks from one another = Δtr/wav Want Resolution > 1.5
tr1 = 5*60=300 s tr2 =5.4*60=324 s wav=(12+16)/2=14 RS = (324-300)/14=1.7
· What happens if the peaks elute at 10 and 10.4 min with widths 16 and 20 s, respectively?
Rs = 24/18 = 1.33.
8. SEPARATION TECHNIQUES
Chromatographic separation can be carry out by the following techniques:
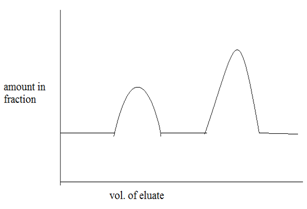
8.1 Elution analysis:6,2
It is very common method used in the column chromatography. In this method a small volume of mixture to be is added on the top of column and mobile phase is allowed to flow through column. As mobile phase down the column, the mixture introduced on the column gets separated into zones as the component of the mixture are adsorbed to the column material to different extend.
On further passage of mobile phase , each component of mixture is eluted out as separated component. A plot of graph of amount separated out versus volume of eluted or fractions. 6
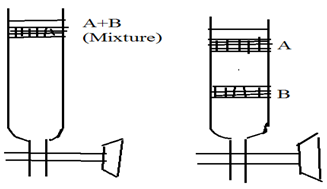
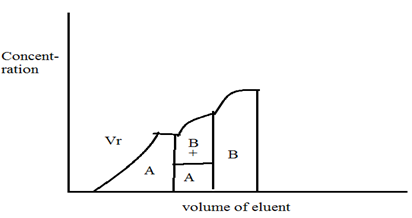
8.2 Frontal analysis:
In this method , the solution of the sample mixture is added continuously on the column. No mobile phse is used for the development of column.
This method can be understood by by the continuous addition of the sample mixture of A and B on to the column which is filled with a known amount of the adsorbent. After certain time the mixture is adsorbed completely and the column saturated. Then, on containing the addition of the mixture, the lees strongly adsorbed component A leaves the column in the pure form. Then it is eluted as a mixture with component B which gets adsobed more strongly and consequently moves more slowly. The amount of A in the mobile phase can be calculated from the retention volume VR, while other component can be determine from the volume concentration ratio. Complete separation of the component can not be achived, when more than two component are present in the sample to be separated.2
8.3 Displacement analysis:
In this method, a small quantity of sample solution first introduced at the top of the column. The component of the mixture are then separated by running a solution of a substance which is more strongly adsorbed than any of the components of the mixture. The substance thus run is termed as displasing agent.
This can be undrestood by involving the elution or development by an eluant C which is having a greater affinity for the stationary phase than the sample components A and B ( A>B). the sample mixture containing A and B is first introduced at the top of the column where it adhere to the stationary phase. Elution take place when the displacing eluant containing C is passed through the column displacing the components on the stationary phase. During the process the component undergoes separation because of the difference in the partition or adsorption properties.this method does not generally produced completely separated component.6
REFERENCES
1. Cazes J, scott R P W,chromatography theory,New York. basal: marcel dekker, inc. page no – 261-285.
2. Chatwal G R, anand S K, Intrumental methods of chemical analysis, edited by M.arora, Aseem anand, Mumbai:Himalaya publishing house, page no- 2.556-2.585
3. und.edu/dept/chromatography/documents/Chromatography.pdf. . Accessed on 25/12/2010
4. teaching.shu.ac.uk/hwb/chemistry/tutorials/chrom/chrom1.htm. Accessed on 25/12/2010
5. Jeffery, bassett, mentham, denney, vogel’s textbook of quantitative chemical analysis,fifth edition, London: the school of chemistry. Page no – 216-221.
6. Kasture A V, mahadik K R, wadodkar S G, more A H, Pharmaceutical amalysis vol-2 intrumental method, nirali prakashan. page no-6-9, 60-65.
7. Willard H H, merritt L L, dean J A, settle F A, instrumental methods of analysis, New delhi: cbs publishers & distributors. Page no-513-538.
NOW YOU CAN ALSO PUBLISH YOUR ARTICLE ONLINE.
SUBMIT YOUR ARTICLE/PROJECT AT articles@pharmatutor.org
Subscribe to Pharmatutor Alerts by Email
FIND OUT MORE ARTICLES AT OUR DATABASE


