

 About Authors:
Kapil Sharma*1, Subhash Gupta2
1Yaresun Pharmaceutical Pvt. Ltd.,India.
2Oasis test house ltd.jaipur-302006,rajasthan,india.
*pharma_kapil@rediffmail.com
INTRODUCTION
Most of the manufacturing industries rely upon both qualitative and quantitative chemical analysis to ensure that the raw material used meet certain specification, and also to check quality of the final product. The unwanted compound may be harmful to manufacturing process or may appear as a harmful impurity in the final product.1
A quantitative analysis is performed to establish the proportion of the essential component in the raw material. The final manufactured product is analyzed to ensure that its essential component is present within a predetermined range of composition and impurities do not exceed certain specified limit.
[adsense:336x280:8701650588]
Reference Id: PHARMATUTOR-ART-1437
IMPORTANCE OF NEWER ANALYTICAL METHODS
Drug analysis reveals identification, characterization and determination of the drugs in dosage forms and biological fluids etc. The number of drugs introduced into the market has been increasing at an alarming rate. These drugs may be either new entities in the market or partial structural modification of the existing drugs.2
Newer analytical methods are developed for these drugs or drugs combination because of the following reasons:
- Official compendia/ pharmacopoeia may not reveal an analytical procedure for the drugs or its combination.
- A literature search may not reveal an analytical procedure for the drug or its combination.
- Analytical methods may not be available for the drug combination due to interference caused by excipients.
- Analytical methods for the quantification of drug or drug combination from biological fluids may not be available.
- Analytical methods for drugs in combination with other drug may not be available.
On the other hand, existing procedure may:
1. Require expensive instrument, reagent or solvents.
2. Involve any tedious extraction or separation steps, which may be quite time consuming.
3. Not rapid, reliable or sensitive.
The newer developed analytical methods find their importance in various fields:
1. Research institution.
2. Quality control department in industries.
3. Approved testing laboratories.
4. Biopharmaceutics and bioequivalence studies and clinical pharmacokinetic.3
Types of analytical methods
- Spectral methods
The spectral techniques measure electromagnetic radiation, which is either absorbed or emitted by sample. For example, UV visible spectroscopy, I. R. spectroscopy, N.M.R., E.S.R. spectroscopy, flame photometry, flourimetry etc.
- Electro analytical methods
Electro analytical methods involve the measurement of current, voltage or resistance. For example, potentiometry, conductometry, amperometry etc.
- Chromatographic methods
There are various advanced chromatographic techniques, which are most reliable and widely used for estimation of multi component drugs in their formulations.
- GLC
- HPLC
- HPTLC4
METHOD DEVELOPMENT BY HPLC 5
Overall plan for method development by HPLC can be represented by the following flow chart:
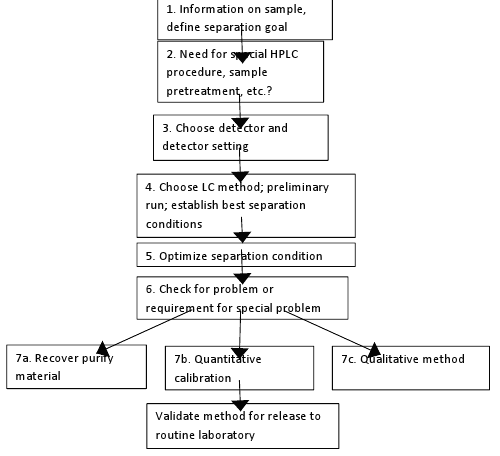
Figure 1: Flow chart of method development for HPLC
[adsense:468x15:2204050025]
OVERALL PLAN FOR ACHIEVING AN ACCEPTABLE REVERSE-PHASE HPLC SEPARATION5
Determine if the sample is regular or special (Table 1): For regular samples, proceed as described below.
1. Choose separation conditions for the first run.
2. Carry out the first run and classify the sample.
a) For isocratic methods, proceed as in Table 3.
b) For early eluting samples, increase retention by (1) changing pH, (2) adding an ion-pair reagent, (3) changing the column (polystyrene or graphite), or (4) changing to normal phase conditions.
c) For late eluting samples, use (1) Non aqueous reverse phase (NARP) or (2) normal phase conditions.
3. For isocratic methods, use the initial gradient run to estimate the best value of % B for the second (isocratic) run (Table 2).
4. Evaluate the quality of bands in the second run (plate number, band width, band shape): Bands that are too wide or asymmetric indicate that initial separation conditions (column, pH, additives, etc.) must be changed; if the second run is OK, all run including the second run should be in duplicate to ensure column equilibrate and repeatable retention times.
5 a.For isocratic methods, proceeds as described in Table 2: Vary % acetonitrile to improve band spacing and resolution: if required, change from acetonitrile to methanol and optimize % methanol for band spacing and resolution: if required, bland acetonitrile and methanol and optimize ternary-solvent mobile phase composition.
b. For isocratic methods, as an alternative to step 5a (especially for an ionic samples), vary % acetonitrile and temperature to achieve 0.5 <k<2 (k is relative retention), and vary band spacing: select conditions for best resolution of sample.
6. For isocratic methods, if adequate separation is not achieved in step 5a or b; vary other condition according to the priorities of Table 4.
7. For gradient methods, optimize band spacing and resolution by varying gradient steepness and temperature. If satisfactory band spacing and resolution are not achieved, vary solvent type in the same way as for isocratic separation. If satisfactory separation is not achieved, change conditions as in Table 5.
8. For gradient methods, finalize the gradient conditions to achieve improved resolution or shorter run time.
9. For other isocratic and gradient methods, consider a change in column condition (column length, flow rate, particle size) for an increase in resolution and decrease in run time.
Once a satisfactory separation is achieved, further changes in conditions are unnecessary. In some case, no experiments beyond step 6 will be required.
NOW YOU CAN ALSO PUBLISH YOUR ARTICLE ONLINE.
SUBMIT YOUR ARTICLE/PROJECT AT articles@pharmatutor.org
Subscribe to PharmaTutor Alerts by Email
FIND OUT MORE ARTICLES AT OUR DATABASE
Table 1: Special samples
|
Sample type |
|
Inorganic ions Enantiomers Biomolecules Synthetic polymers Carbohydrates Isomers |
Table 2:Initial conditions for reversed phase HPLC development
|
Separation variables |
Preferred initial choice |
|
Column packing |
C8 or C18: less acidic silica: if temperature >500C is planned, more stable, satirically protected packing are preferred. |
|
Column configuration |
15 X 0.46-cm column, 5-mm particles. |
|
Flow rate |
2.0 ml/min. |
|
Mobile phase |
Acetonitrile-water (neutral samples) or acetonitrile-buffer (ionic sample): buffer is 25-50 mM potassium phosphate at pH 2-3 (lower pH preferable if column is stable). For the initial experiment, a 5-10% B gradient in 60 min is recommended. |
|
Temperature |
35-400C |
|
Sample size |
<50mL; 50-100mg. |
Table 3: Systemic approach to HPLC method development for regular sample and isocratic separation
|
Experiments |
Questions |
|
Run 1 See Table 2 for conditions; 5 to 100% acetonitrile gradient in 60 min |
|
|
Run 2 % acetonitrile selected from run 1 |
|
|
Run 3 % acetonitrile increased by 10 vol % |
|
|
Run 3a Best % ACN from run 2 and 3 |
|
|
Run 4 Run 2 and 3 used to estimate best % methanol |
|
|
Run 5
% Methanol increased by 10 vol % |
|
|
Run 5a Best % methanol from runs 4 and 5 |
|
|
Runs 6 and 7 Blend mobile phases (1:1) from runs 2 and 4 plus 3 and 5 |
|
|
Run 7a Optimum blend of water, methanol, and acetonitrile |
|
Table 4: Additional variable for changing selectivity and separation when the approach of Table 3 has been unsuccessful
|
Variablesfor Neutral samples |
Variablesfor Ionic samples |
|
Column type; cyno or phenyl column |
Temperature |
|
Temperature |
pH |
|
Trihydrofuran as solvent |
Column type; cyno or phenyl column |
|
Different C18 column |
Trihydrofuran as solvent |
|
Buffer type or concentration; amine modifiers |
Variables arranged in order of decreasing promise for reversed-phase HPLC
Table 5: Method development for the RP separation of the ionic samples
|
Run 1 |
Initial gradient run: 5- 100% methanol, phosphate buffer, pH 2.5, 15 X 0.46 cm less acidic C8 or C18 column at 2 ml/min flow rate. |
|
Run 2 |
Estimate the best possible % B for isocratic separation. Vary pH, % B, add ion pair reagent to obtain 0.5 <k <20. |
|
Run 3 |
Adjust % B for k-range and band spacing. |
|
Run 4 |
If an adequate separation is not achieved in run 3 change to the acetonitrile as solvent and % B as needed for good separation. |
|
Run 6 and 7 |
Further changes in band spacing are possible by changing column type, temperature, or (less frequently) buffer concentration. |
|
Run 8 |
When band space has been optimized, consider a change in column length, flow rate or partial size to improve separation further. |
Nature of sample
The chemical composition of the sample can provide valuable clues for the best choice of an HPLC separation. Depending on the use of this sample information, two somewhat different approaches to HPLC method development are possible.
1. RP-HPLC
2. Normal phase HPLC
The information concerning sample composition and properties are as follows:
· Number of compound present
· Chemical structure of compound
· Molecular weigh of compound
· pKa values of compound
· UV spectra of compound
· Concentration range of compound in sample of interest
· Sample solubility
Improving the separation
Separation of resolution is a primary requirement in quantitative HPLC analysis. Usually, for sample containing five or fewer components, baseline resolution (Rs > 1.5) can be obtained easily for the bands of interest.
The value of resolution = 2 or greater should be the goal during method development for simple mixture. Such resolution improves assay precision and greater method ruggedness. Sample containing 10 or more components will be more difficult to separate.
Table 6: Separation goal in HPLC method development
|
Goal |
Comment |
|
Resolution |
Precise and rugged quantitative analysis require that R, be greater than 1.5 |
|
Separation time |
<5-10 min is desirable for routine procedure |
|
Quantitation |
≤2% (RSD) for assay; ≤5% for less demanding analyses; ≤ 15% for trace analyses |
|
Pressure |
≤150 bar is desirable, ≤200 bar is usually essential (new column assumed) |
|
Peak height |
Narrow peaks are desirable for large signal/noise ratios |
|
Solvent consumption |
Minimum mobile phase use per run is desirable |
NOW YOU CAN ALSO PUBLISH YOUR ARTICLE ONLINE.
SUBMIT YOUR ARTICLE/PROJECT AT articles@pharmatutor.org
Subscribe to PharmaTutor Alerts by Email
FIND OUT MORE ARTICLES AT OUR DATABASE
Multi-Component Quantitation Mode
The multi-component quantitation mode is the mode in which the concentration of each constituent component is determined by using the absorption spectrum of the mixed sample with pure standards or standards made up of multiple constituent components.
- Mixed sample with up to 8 constituent components can be quantitated.
- In addition to pure sample of each constituent component as the standard samples, a mixed sample in which the concentration of each constituent component is known may also be used.
The effect of interference among the various constituent components can be minimized by using a mixed sample as the standard sample.
- The standard data can be saved with the measurement parameter in the memory. In addition, a spectrum saved in memory can be used as the standard sample or unknown sample data. However, unlike other parameter files, these can only be saved one at a time.
- The measurement wavelength can be set at uniform intervals or randomly set. You can freely select the measurement wavelengths to improve measurement accuracy
- If a sample whose absorbance is virtually zero, or a sample with a closely absorption spectrum shape is used as the standard sample, isolation quantitation calculation may not be able to performed or accurate value may not be found.
- If a mixed sample with 4 or more constituent components is used as the standard sample, it is highly probable that isolation quantitation calculation will not be able to perform.
Operation of Multi-Component Quantitation Mode
Select and load the parameters.
- Select the scanning range wavelength, recording range, scan speed, display mode, no. of component, standard type, no. of standard, measuring wavelengths and standard data as required.
- Selecting measuring wavelengths: Select the measuring wavelength. First enter the longer wavelength and then lower wavelengths.
- Measurement standard data: enter the standard concentration, first which has higher wavelength and then for the lower wavelength.
- Correct the baseline via baseline correction.
- Define the standards by placing the standard, which has the longer wavelength, and start to measure the spectrum. It will show “*” when measuring or defining the standard will be completed. Press enter to select next standard data to define. Than place the standard of lower wavelength and than start measuring the spectrum. It will show “*” when measuring or defining the standard will be completed. After completing defining the standard press key calculate.
- Now the standard is defined and it ready to calculate the mixed sample.
- Place the individual standard and start the measurement, it will show the individual standard concentration. Concentration will be displayed automatically on the screen.
- Place the mixed standard and start the measurement, it will show the mixed standard concentration.
- Place the mixed sample and start the measurement, it will show the mixed sample concentration.
VALIDATION PARAMETERS8
The main objective of validation of an analytical procedure is to demonstrate that the procedure is suitable for its intended purpose. Analytical procedures for biological and biotechnological products in some cases may be different. Well-characterized reference materials, with documented purity, should be used throughout the validation study. The degree of purity necessary depends on the intended use.
Specificity
An investigation of specificity should be conducted during the validation of identification tests, the determination of impurities, and the assay. The procedures used to demonstrate specificity will depend on the intended objective of the analytical procedure. It is not always possible to demonstrate that an analytical procedure is specific for a particular analyte (complete discrimination). In this case, a combination of two or more analytical procedures is recommended to achieve the necessary level of discrimination.
Linearity
A linear relationship should be evaluated across the range of the analytical procedure. Linearity should be evaluated by visual inspection of a plot of signals as a function of analyte concentration or content. If there is a linear relationship, test results should be evaluated by appropriate statistical methods, for example, by calculation of a regression line by the method of least squares. Some analytical procedures, such as immunoassays, do not demonstrate linearity after any transformation. In this case, the analytical response should be described by an appropriate function of the concentration (amount) of an analyte in a sample. For the establishment of linearity, a minimum of five concentrations is recommended.
Range
The specified range is normally derived from linearity studies and depends on the intended application of the procedure. It is established by confirming that the analytical procedure provides an acceptable degree of linearity, accuracy, and precision when applied to samples containing amounts of analyte within or at the extremes of the specified range of the analytical procedure.
Accuracy (Percentage recovery)
The accuracy of the analytical method is closeness of the test result obtained by that method to the true value. Accuracy may often be expressed as percentage recovery by the assay of known, added amounts of analyte. Accuracy is a measure of the exactness of the analytical method. Accuracy should be established across the specified range of the analytical procedure. Accuracy should be assessed using a minimum of 9 determinations over a minimum of 3 concentration levels covering the specified range (e.g., 3 concentrations/ 3 replicates each of the total analytical procedure). Accuracy should be reported as percent recovery by the assay of known added amount of analyte in the sample.
Precision
Validation of tests for assay and for quantitative determination of impurities includes an investigation of precision.
Repeatability
Repeatability should be assessed using:
a) A minimum of 9 determinations covering the specified range for the procedure (e.g., 3 concentrations/ 3 replicates each); or
b) A minimum of 6 determinations at 100 percent of the test concentration.
Intermediate Precision
The extent to which intermediate precision should be established depends on the circumstances under which the procedure is intended to be used. The applicant should establish the effects of random events on the precision of the analytical procedure. Typical variations to be studied include days, analysts, equipment, etc. It is not necessary to study these effects individually.
Reproducibility
Reproducibility is assessed by means of an inter-laboratory trial. Reproducibility should be considered in case of the standardization of an analytical procedure, for instance, for inclusion of procedures in pharmacopoeias. These data are not part of the marketing authorization dossier.
Limit of Detection (LOD)
Based on visual evaluation
The detection limit is determined by the analysis of samples with known concentrations of analyte and by establishing the minimum level at which the analyte can be reliably detected.
Based on signal-to-noise
This approach can only be applied to analytical procedures that exhibit baseline noise. Determination of the signal-to-noise ratio is performed by comparing measured signals from samples with known low concentrations of analyte with those of blank samples and establishing the minimum concentration at which the analyte can be reliably detected. A signal-to-noise ratio between 3:1 or 2:1 is generally considered acceptable for estimating the detection limit.
Based on the standard deviation of the response and the slope
The limit of detection can be expressed as:
LOD= 3.3(SD/S)
Where, SD = Standard deviation of the response
S = Slope of the calibration curve
Limit of Quantitation (LOQ)
Based on visual evaluation
Visual evaluation may be used for non-instrumental methods, but may also be used with instrumental methods. The limit of quantitation is generally determined by the analysis of samples with known concentrations of analyte and by establishing the minimum level at which the analyte can be quantified with acceptable accuracy and precision.
Based on signal-to-noise
This approach can only be applied to analytical procedures that exhibit baseline noise. Determination of the signal-to-noise ratio is performed by comparing measured signals from samples with known low concentrations of analyte with those of blank samples and by establishing the minimum concentration at which the analyte can be reliably quantified. A typical signal-to-noise ratio is 10:1.
Based on the standard deviation of the response and the slope
The limit of quantitation may be expressed as:
LOQ = 10(SD/S)
Where, S.D = Standard deviation of response
S = Slope of the calibration curve
Robustness
It should show the reliability of an analysis with respect to deliberate variations in method parameters. One consequence of the evaluation of robustness should be that a series of system suitability parameters (e.g., resolution test) is established to ensure that the validity of the analytical procedure is maintained whenever used.
Examples of typical variations are:
· Stability of analytical solutions
· Mobile phase composition
· Extraction time
· Influence of variations of pH
· Temperature etc.
System suitability testing
System suitability testing is an integral part of many analytical procedures. The tests are based on the concept that the equipment, electronics, analytical operations, and samples to be analyzed constitute an integral system that can be evaluated as such. System suitability test parameters to be established for a particular procedure depend on the type of procedure being validated.
REFERENCES
1. Sharma B.K. Instrumental Methods of Chemical Analysis, 18th Edition, 1999. Goel Publishing House, Meerut. 1-6.
2. Jeffrey, et. al., Introduction: Vogel’s Textbook of Quantitative Chemical Analysis, 5th Edition, 1997, ELBS, Longman, 3-8.
3. Skoog D.A. Holler F.J., Nieman D.A.; Introduction to UV Spectroscopy in, Principle of Instrumental Analysis, 5th ed., Thomson book/cole, 2004, 156.
4. Willard, Merrit, Dean and Settle; H.P.L.C. Methods and Applications in; Instrumental methods of Analysis; 7th ed., New Delhi: C.B.S. Publishers and Distributors, 2003, 614.
5. Snynder LR, Kirklend J J, Practical H.P.L.C. method development, 2nd ed., John Wiley and Sons, Inc: 2000; 2(1); 38-42.
6. British Pharmacopoeia, Vol-1, 4th ed., Controller of Her Majesty,s Stationary Office, London, 2004; 65, 356.
7. Robert A. Nash, Alfred H. Wachter, Pharmaceutical process validation, Marcel Dekker, Inc., 2003, 507-22
8. Text on Validation of Analytical Procedures Q2A in; I.C.H. Harmonised Tripartite Guidelines; Oct. 1994.
NOW YOU CAN ALSO PUBLISH YOUR ARTICLE ONLINE.
SUBMIT YOUR ARTICLE/PROJECT AT articles@pharmatutor.org
Subscribe to PharmaTutor Alerts by Email
FIND OUT MORE ARTICLES AT OUR DATABASE


