Repurposing FDA-approved drugs may help combat COVID-19
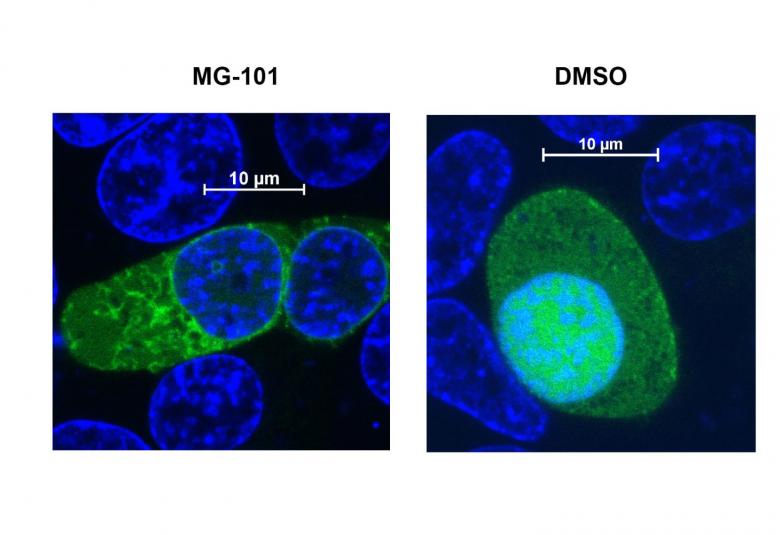
Several FDA-approved drugs including for type 2 diabetes, hepatitis C and HIV significantly reduce the ability of the Delta variant of SARS-CoV-2 to replicate in human cells, according to new research led by scientists at Penn State. Specifically, the team found that these drugs inhibit certain viral enzymes, called proteases, that are essential for SARS-CoV-2 replication in infected human cells.