

About Authors:
Megana.H.S*, A.Satish Kumar Shetty, Anil Kumar S.M
*Department of Pharmaceutical Analysis,
National College of Pharmacy, Balraj Urs road,
Shimoga-577201,
Karnataka, India.
megana.leo@gmail.com
ABSTRACT
A novel, accurate, precise, sensitive, economic and rapid spectrophotometric methods has been developed and validated for simultaneous estimation of Triamterene and Benzthiazide in bulk and pharmaceutical dosage form. Triamterene and Benzthiazide showed absorption maxima at 363 nm and 283 nm in ethanol, which is used as solvent. In the present study, Area Under Curve method (Method A) developed, employedthe measurement of area at selected analytical wavelength ranges. Two analytical wavelength ranges selected were 358nm to 368nm nm (lmax of Triamterene is 363nm) and 278nm to 288nm (lmax of Benzthiazide is 283nm) for the estimation of Triamterene and Benzthiazide respectively. Ratio derivative method (Method B) employed the measurement of amplitudes of Triamterene and Benzthiazide at their respective selected wavelengths. Two wavelengths selected were 359.2 nm and 300.4 nmfor the estimation of Triamterene and Benzthiazide respectivelybased upon divisor method. Linearity was observed in the concentration range of 6-30 μg/ml and 3-15 μg/ml for Triamterene and Benzthiazide respectively. The recovery studies ascertained the accuracy of the proposed method and the results were validated as per ICH guidelines.
[adsense:336x280:8701650588]
Reference Id: PHARMATUTOR-ART-1274
1. INTRODUCTION:
Triamterene is a potassium-sparing diuretic (water pill) is used to treat fluid retention (edema) in people with congestive heart failure, cirrhosis of the liver, or a kidney condition called nephrotic syndrome. Triamterene is also used to treat edema caused by having too much aldosterone in body1.
Triamterene is chemically 2,4,7 – triamino, 6-phenylpteridine with a molecular formula C12H11N7 and molecular weight of 253.27 gm/mol. It is an official drug in British Pharmacopoeia2.
Triamterene shows hyperkalemia as its major side effect. So, in order to counteract this effect it is used in combination with a Thiazide diuretic which counteracts the side effect of triamterene by its hypolkalemic effect3,4.
Benzthiazide belong to thiazide diuretics, widely used in treatment of hypertension and edema associated with mild to moderate congestive heart failure. It increases the rate of urine excretion by the kidneys through decreased tubular reabsorption of sodium and chloride ions and by increasing osmotic transport of water to the renal tubules, which in turn lowers cardiac output and blood pressure. On prolonged thiazide treatment plasma volume and ECF return to normal, but their hypotensive effect continues. This is probably due to reduced sensitivity of the vascular bed to the circulating catecholamine and angiotensin5,6.
Benzthiazide is chemically 6-chloro-3- [ ( phenylmethyl) thio ]methyl ]- 2H- 1,2,4-benzthiadiazine-7-sulfonamide-1,1 dioxide with a molecular formula C15H14ClN3O4S3and molecular weight of 431.94 gm/mol. It is an official drug in British Pharmacopoeia7.
Combination of Triamterene and Benzthiazide are used in treatment of edema and hypertension8.
2. OBJECTIVE:
On the literature survey it was found that Triamterene and Benzthiazide were estimated independently and in combination with other drugs by several Bioanalytical, HPLC and Spectrometric methods. But no method has been found for simultaneous estimation of Triamterene and Benzthiazide even though this multi- ingredient’s formulation is available in market from past 50 years. In the view of the need in the industry for routine analysis of Triamterene and Benzthiazide in bulk and formulation, attempts are being made to develop simple and accurate analytical methods for simultaneous estimation of Triamterene and Benzthiazide and extend it for their determination in formulation.
[adsense:468x15:2204050025]
3. MATERIALS AND METHODS:
Instrument used:
For both the methods, Shimadzu model 1700 double beam UV-VIS spectrophotometer with spectral bandwidth of 1.8nm, wavelength accuracy of 2nm and a pair of 1 cm matched quartz cells of 10 mm optical path length was used as an instrument for spectral measurements.
Samples procured:
An analytically pure sample of Triamterene and Benzthiazide was procured as gift sample from Remedix Pharma Pvt Ltd, Bangalore, India. Tablet formulation conataining Triamterene (50 mg) and Benzthiazide (25 mg), DYTIDE was brought form local pharmacy.
Solvent Used: Ethanol AR grade is used as solvent.
Preparation of standard stock solution:
100 mg each of Triamterene and Benzthiazide were weighed separately and transferred into two different 100 ml volumetric flasks. Both the drugs were dissolved in 25 ml of ethanol by ultrasonication and then volume was made upto the mark with ethanol to obtain final concentration of 1000 µg/ml of each component (stock ‘A’ solution). From the above stock ‘A’ of each solution, 5 ml of aliquot was pipetted out in a 50 ml volumetric flask and the volume was made upto the mark with ethanol to obtain the final concentration of 100 µg/ml of each component (stock ‘B’ solution).
Selection of analytical wavelength
Area Under Curve method9-18 :
AUC method involves the calculation of integrated value of absorbance with respect to wavelength. Area calculation processing item calculates the area of bounded by the curve and horizontal axis. Here horizontal axis represents baseline.
Following equations were used for calculations.
The total area under the curve of a mixture at a particular wavelength range is equal to the sum of area under curve of the individual components at same wavelength range. The area under curve of the mixture containing component T and B can be given as follows:
AUCM λ1- λ2 = AUC Tλ1- λ2 + AUC Bλ1- λ2 (1)
AUCM λ3- λ4 = AUC Tλ3- λ4 + AUC Bλ3- λ4 (2)
Considering pathlength ‘b’ the above equation can be written as
AUCM λ1- λ2 = X Tλ1- λ2 b CT + X Bλ1- λ2 b CB (3)
AUCM λ3- λ4 = X Tλ3- λ4 b CT + X Bλ3- λ4 b CB (4)
Determination of ‘X’ values:
AUC of component between selected wavelength ranges
X= ---------------------------------------------------------
Concentration of that component in gm/lit
Concentration of T and B in mixture can be calculated by rearranging equation (3) and (4) and substituting back CT and CB respectively in equation (3) and (4)
Rearranged equations for calculating CT and CB ;
AUCM λ1- λ2 - X Bλ1- λ2 b CB
CT = ---------------------------------- from equation (3)
X Tλ1- λ2 b
AUCM λ3- λ4 - X Tλ3- λ4 b CT
CB = ------------------------------------ from equation (4)
X Bλ3- λ4 b
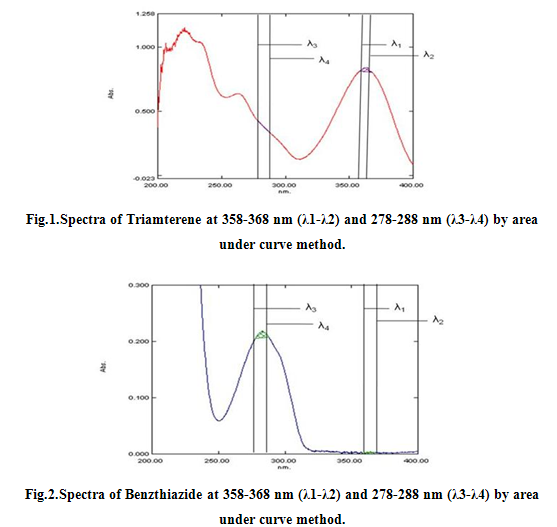
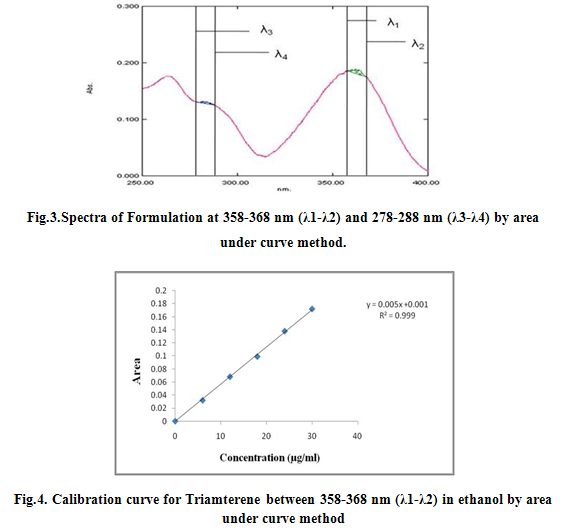
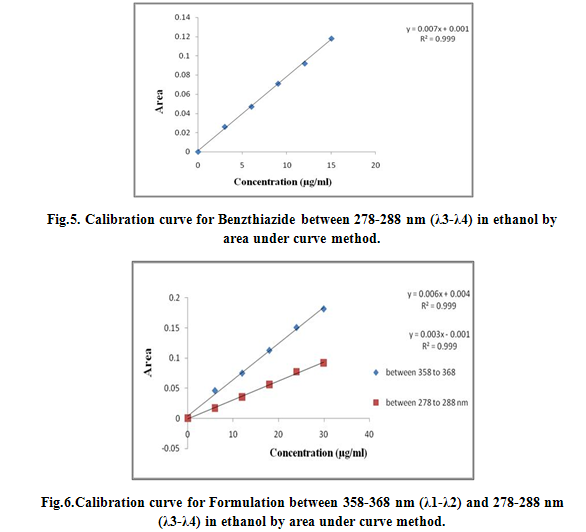
For Area under Curve method, the sampling wavelength ranges selected for estimation of Triamterene and Benzthiazide are 358-368nm (λ1-λ2) and 278-288 nm (λ3-λ4) respectively. Sample solutions were prepared (6-30 μg/ml) and their area under the curve was measured at the selected wavelength ranges. All the peak areas were recorded and spcetra were reported as Fig 1, 2 and 3 and were calibrated as Fig 4, 5 and 6.
Where,
λ1- λ2= 358 to 368 nm of Triamterene
λ3- λ4= 278 to 288 nm of Benzthiazide
T= Triamterene
B= Benzthiazide
M= Mixture
AUCM λ1- λ2 = area under curve of mixture at 358 to 368 nm
AUCM λ3- λ4 = area under curve of mixture at 278 to 288 nm
AUC Tλ1- λ2 = area under curve of Triamterene at 358 to 368 nm
AUC Bλ1- λ2 = area under curve of Benzthiazide at 358 to 368 nm
AUC Tλ3- λ4 = area under curve of Triamterene at 278 to 288 nm
AUC Bλ3- λ4 = area under curve of Benzthiazide at 278 to 288 nm
Ratio derivative method19-23:
The Ratio derivative method involved dividing the spectrum of mixture by the standardized spectra of each of the analyte and deriving the ratio to obtain spectrum that is dependent of concentration of analyte used as a divisor. The zero order spectra of one component is divided by each concentration spectra of other component and vive versa. The concentration and wavelength at which the linearity (which can be seen by plotting a calibration graph of concentration v/s amplitude of divided spectra’s) excellent will be selected for determination of concentration in sample, using the formula;
Cx = derivative amplitude at x drug at its selected wavelength – intercept
Slope of calibration curve
Cy = derivative amplitude at y drug at its selected wavelength – intercept
Slope of calibration curve
Where Cxisconcentration of X drug
Cy is concentration of Y drug
Slope and Intercept are found through calibration curves.
For the simultaneous determination using the ratio derivative method, suitable dilutions of Triamterene (6-30 μg/ml) and Benzthiazide (3-15 μg/ml) of the standard stock solutions (100 μg/ml) of both, prepared separately were scanned in the range of 200-400 nm.
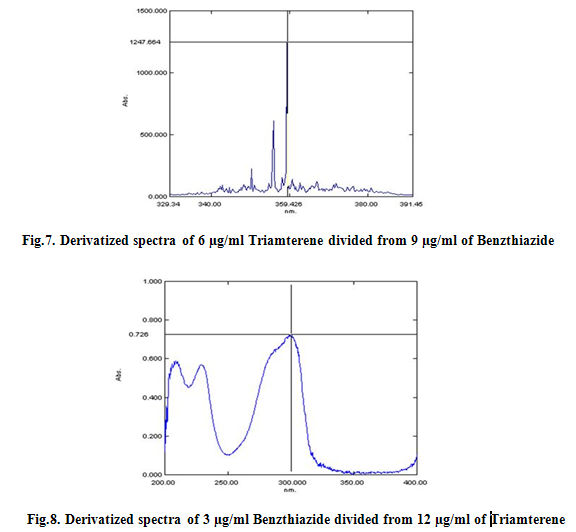
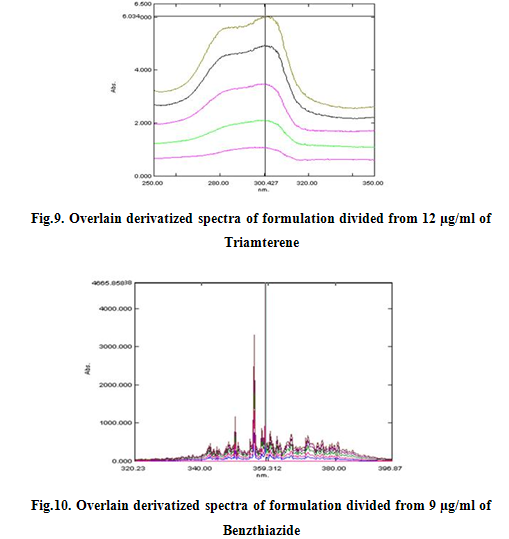
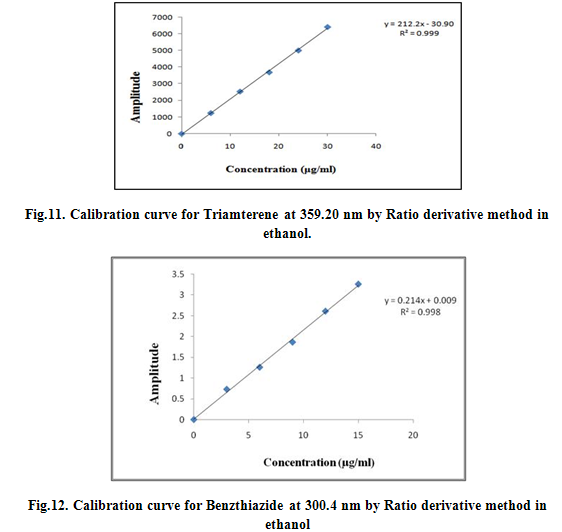
The first derivative ratio spectra of different Triamterene standards at increasing concentrations in ethanol was obtained by dividing each with the stored spectrum of the standard solution of 9 μg/ml of Benzthiazide by a computer aid as divisor spectra. These ratio spectra are shown in Fig. Two minima (357 nm and 353 nm) and three maxima (359.2 nm, 355.8 nm and 350.2nm) exist and we found that all the wavelengths were suitable for the determination of Triamterene in sample, but good linearity was obtained at 359.2 nm. The wavelength of 359.2 nm was selected for the determination of Triamterene in the assay of synthetic mixtures and commercial formulations. All the peak amplitude values were recorded and calibrated.
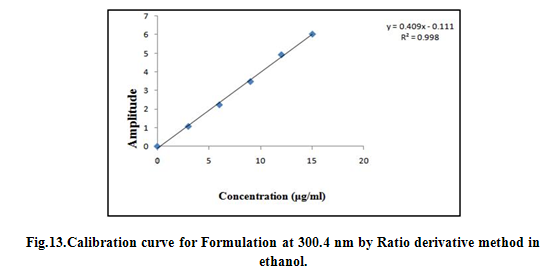
The first derivative ratio spectra of different Benzthiazide standards at increasing concentrations in ethanol was obtained by dividing each with the stored spectrum of the standard solution of 12 μg/ml of Triamterene by a computer aid as divisor spectra. These ratio spectra are shown in Fig. Two minima (219 nm and 249.6 nm) and three maxima (300.4 nm, 299.6 nm and 209.8 nm) exist and we found that all the wavelengths were suitable for the determination of Benzthiazide in sample, but good linearity was obtained at 300.4 nm. The wavelength of 300.4 nm was selected for the determination of Benzthiazide in the assay of synthetic mixtures and commercial formulations. All the peak amplitude values were recorded and spcetra were reported as Fig 7, 8, 9 and 10 and were calibrated as Fig 11, 12, and 13.
NOW YOU CAN ALSO PUBLISH YOUR ARTICLE ONLINE.
SUBMIT YOUR ARTICLE/PROJECT AT articles@pharmatutor.org
Subscribe to PharmaTutor Alerts by Email
FIND OUT MORE ARTICLES AT OUR DATABASE
Validation of proposed methods24,25:
Determination of accuracy (recovery study):Accuracy is the closeness of the test results obtained by the method to the true value. Recovery studies were carried out by addition of standard drug to the sample at 3 different concentration levels i,e 80%, 100% and 120%, taking into consideration percentage purity of added bulk drug samples. Table 2, 3 for AUC and Table 10, 11 for ratio derivative method.
Determination of precision (Inter-day and Intra-day):The precision of an analytical method is the degree of agreement among individual test results when the method is applied repeatedly to multiple samplings of homogenous samples. It provides an indication of random error results and was expressed as % relative standard deviation.(%RSD).
Inter-day precisioninvolves analysis of replicates by the analyst using the same equipment and method and conducting the precision study over short period of time while
Intra-day precisioninvolves study at different days, different laboratories, and different batch of reagent, different analysts, and different equipments. Table 5 and Table 12.
Determination of Limit of Detection (LOD) and Limit of Quatitation (LOQ):Limit of detection is determined by the analysis of samples with known concentrations of analyte and by establishing the minimum level at which the analyte can be reliably detected. The detection limit (LOD) and quantitation limit (LOQ) may be expressed as:
L.O.D. = 3.3*(SD/S)
L.O.Q. = 10*(SD/S)
Where, SD = Standard deviation of the response
S = Slope of the calibration curve
The slope S may be estimated from the calibration curve of the analyte. Table 1 and 9.
Determination of sandell’s sensitivity:Sensitivity of the method for both drugs was individually determined by calculating Sandell’s sensitivity (μg.cm-2/0.001 Abs unit), which can be defined as the smallest weight of the substance that can be detected in column of unit cross section.Table 1 and 9
This can be calculated using following formulae;
Sandell’s sensitivity = Mol wt / Molar absorptivity
Preparation of sample stock solution using formulation:
From the powder of twenty tablets, a quantity equivalent to 100mg of Triamterene was weighed accurately and transferred to a flask containing 50ml of ethanol, ultrasonicated for 15 mins, solution was filtered through whatmann filter paper no.41 into a 100ml volumetric flask, volume was made upto mark with ethanol to get 1000 µg/ml (stock I). Aliquots were further prepared by diluting stock II (100 µg/ml) in ethanol to get a concentration of 6-30 µg/ml. The resulting solution was analyzed by proposed method.
4. RESULTS AND DISCUSSION:
Spectral characterisctics are reported in Table 1 and table 9.
NOW YOU CAN ALSO PUBLISH YOUR ARTICLE ONLINE.
SUBMIT YOUR ARTICLE/PROJECT AT articles@pharmatutor.org
Subscribe to PharmaTutor Alerts by Email
FIND OUT MORE ARTICLES AT OUR DATABASE
Table.1. Spectral characteristics of Triamterene, Benzthiazide and formulation between 358-368 nm (λ1-λ2) and 278-288 nm (λ3-λ4) by area under curve method.
|
Parameter |
Triamterene between 358 to 368nm |
Benzthiazide between 278 to 288 nm |
Formulation between 358 to 368nm |
Formulation between 278 to 288 nm |
|
Linear Range (µg/ml) |
6-30 |
3-15 |
6-30 |
6-30 |
|
Slope |
0.005x |
0.007x |
0.006x |
-0.003x |
|
Intercept |
0.001 |
0.001 |
0.004 |
0.001 |
|
Regression co-efficient |
0.999 |
0.999 |
0.999 |
0.999 |
|
Standard deviation |
0.000501 |
0.000833 |
0.000892 |
0.000685 |
|
Sandell’s sensitivity |
0.1786 |
0.1252 |
- |
- |
|
Limit of Detection (µg/ml) |
0.33 |
0.39 |
0.49 |
0.75 |
|
Limit of Quantification (µg/ml) |
1.002 |
1.19 |
1.486 |
2.28 |
Table.2. Determination of ‘X’ value of Triamterene, Benzthiazide and Formulation between 358-368 nm (λ1-λ2) and 278-288 nm (λ3-λ4) respectively at 6 μg/ml
|
Components |
‘X’ value between 358-368 nm |
‘X’ value between 238-248 nm |
|
Benzthiazide |
66.66 |
866.66 |
|
Triamterene |
533.3 |
166.66 |
Table.3. Determination of Accuracy of Triamterene and Benzthiazide.
|
Level of % recovery |
Amount of formulation (mg/tab) |
Amount of standard drug added (mg) |
Total amount recovered (mg) |
% Recovery |
||||
|
TRM |
BNZ |
TRM |
BNZ |
TRM |
BNZ |
TRM |
BNZ |
|
|
80% |
50 |
25 |
40 |
20 |
90.36 |
45.63 |
99.6 |
98.6 |
|
50 |
25 |
40 |
20 |
90.63 |
44.95 |
99.3 |
100.1 |
|
|
50 |
25 |
40 |
20 |
91.18 |
45.87 |
98.7 |
98.1 |
|
|
100% |
50 |
25 |
50 |
25 |
99.8 |
49.95 |
100.2 |
100.1 |
|
50 |
25 |
50 |
25 |
99.9 |
49.8 |
100.1 |
100.4 |
|
|
50 |
25 |
50 |
25 |
99.2 |
49.7 |
100.8 |
100.6 |
|
|
120% |
50 |
25 |
60 |
30 |
111.33 |
55.16 |
98.8 |
99.7 |
|
50 |
25 |
60 |
30 |
110.44 |
55.11 |
99.6 |
99.8 |
|
|
50 |
25 |
60 |
30 |
109.67 |
55.3 |
100.3 |
99.45 |
|
Table.4. Statistical validation Data for Accuracy.
|
Components |
Mean* (%) |
Standard Deviation* |
% Relative standard deviation* |
Standard Error* |
|
TRM |
99.71111 |
0.529136 |
0.530995 |
0.259108 |
|
BNZ |
99.65 |
0.490924 |
0.494569 |
0.200459 |
*n = 3
Table.5. Statistical validation Data for Intra-day Precision.
|
Components |
Mean* |
Standard Deviation* |
% Relative standard deviation* |
Standard Error* |
|
TRM |
0.1016
|
0.000501
|
0.493143
|
0.000205
|
|
BNZ |
0.070567 |
0.000833 |
1.179952 |
0.000341
|
|
FORM between 358-368 nm (λ1-λ2) |
0.1138 |
0.000892 |
0.783859 |
0.000365587 |
|
FORM between 278-288 nm (λ3-λ4) |
0.055593 |
0.000677 |
1.217594 |
0.000276399 |
*n = 6
Table.6. Determination and statistical validation data for Inter-day Precision of Triamterene, Benzthiazide and Formulation between 358-368 nm (λ1-λ2) and between 278-288 nm (λ3-λ4)
|
Components |


