About Authors:
Dr. A. K. Pathak, Parul Sengar, Kamlesh Kumar*
Department of Pharmacy, Barkatullah University
Bhopal, M. P.
Abstract
A Quantitative Structure Activity Relationship study on a Series of 40 molecules of (4-Quinolylhydrazone compounds) with anti-tubercular activity analogues was made using combination of various physicochemical descriptors (Thermodynamic, electronic and spatial). Several statistical expressions for 2D QSAR & 3D QSAR were developed using stepwise partial least square (PLS) regression analysis and K-Nearest neighboring molecular field analysis (K-NNMFA) respectively. The studies on 2D-QSAR, suggested the four descriptors T_C_C_2, T_C_N_4, Surface area excluding P & S, SsCH3E-index, and H donor count were common and highly contributed the activity. 2DQSAR model developed using partial least square regression approach. Negative logarithmic value of (MIC) was taken as dependent variable and selected discriptors were taken as independent varable. The analysis resulted in the following 2D-equation suggest that, MIC50 = [+0.1587 T_C_C_2- 0.0593 SsCH3E-index- 0.1395 T_C_N_4+ 0.3888 H-Donor Count -3.1556], n =26; Degree of freedom = 22; r2 = 0.75; q2 = 0.67; F test = 22.63; r2 se = 0.20 ; q2 se = 0.23; pred_r2 = 0.46 ; pred_r2 se = 0.24, a H-donor group at Ar, is important for guiding the design of a new molecule. 3DQSAR model developed using K-nearest neighbour method (training set =33 and test set = 7). The best model derived by the method have q2 = 0.51, q2_se = 0.25, Predr2 = 0.71, pred_r2se = 0.16, n=33, k Nearest Neighbor is 2, Degree of freedom =28. The steric and electrostatic descriptors at the grid points, E_916 (0.1865, 0.3006); S_591 (-0.2851, -0.2580); S_1027 (-0.3273, -0.3090); S926 (30.000, 30.000) plays important role for design of new molecule. 3DQSAR analysis of series of 4-Quinolylhydrazone compounds informed that electropositive and less bulky group increases the biological activity.
[adsense:336x280:8701650588]
Reference Id: PHARMATUTOR-ART-1170
Introduction
Tuberculosis (TB) is one of the most prevalent infectious Diseases, about 2 billion people, equal to one-third of the world’s total population, are infected with Mycobacterium tuberculosis (MTB), the microbes that cause tuberculosis.[1] Tuberculosis is a leading killer among HIV-infected people with weakened immune systems; about 200,000 people living with HIV/AIDS die from TB every year. Multidrug-resistant TB (MDR-TB) is a form of TB that does not respond to the standard treatments using first-line drugs. [2]
The quinoline skeleton is often used for the design of many synthetic compounds with diverse pharmacological profile like antifungal, antitumor, antimycobacterial, antimalarial, Antihistaminic, antiacetylcholine, antioxidant, antihypertensive (angiotensin II receptor antagonists), antileishmanial, antidyslipidemic, antioxidative, analgesic, anti-inflammatory, and anti-HIV activity [3-12]. The present work focuses on the QSAR analysis on some quinolyl hydrazones derivatives for the development of new quinolyl compounds for the potent antimycobacterial activity (TB). In the present study, 2D-QSAR, 3D-QSAR analysis of some novel 4-Quinolylhydrazone compounds with anti-tubercular activity was performed by using Partial least square regression (PLS) and k-nearest neighbour method (KNN) approach. A data set of 40 molecules was taken from Sandra Gemma et al. in Bioorganic & Medicinal Chemistry Journal 2009 available online at www.sciencedirect.com.[13] and MIC value of molecules were converted to negative logarithmic values (MIC) by using software VLIFE MDS 3.5 [14].
[adsense:468x15:2204050025]
Materials and Methods
The dataset consist of structurally diverse compounds reported for MTB H37RV inhibitory activities. The selected series comprises of forty (40) 4-Quinolylhydrazone analogues reported by Sandra Gemma et al. [13] (Table 1).The Anti-tubercular activity of compounds in the series is reported as MIC values where MIC refers to minimum concentration required to inhibit 50% of Antimicrobial activity. The compounds in the selected series were randomly divided into two sets with one set as a training set in developing regression models and the remaining as validation set (Test set) in the prediction of biological activity.
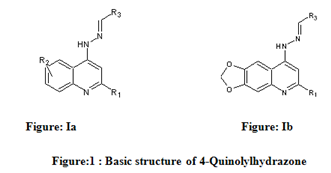
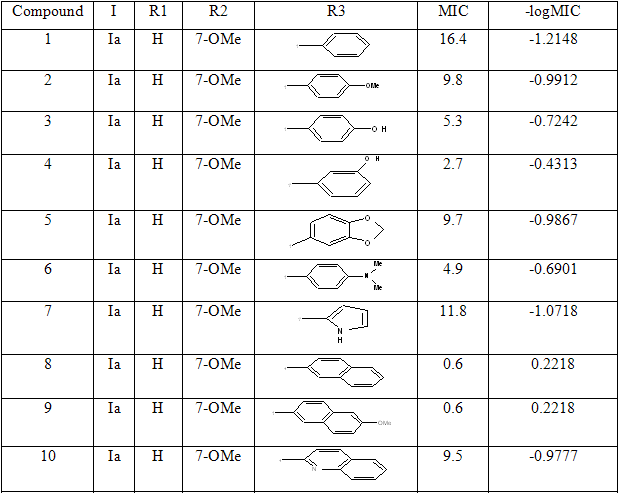
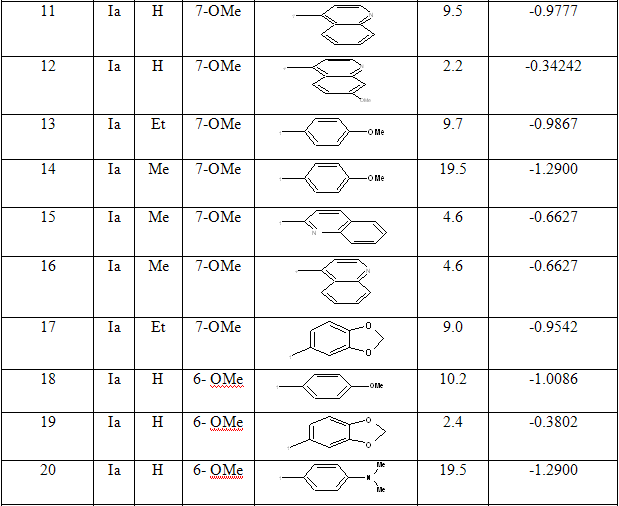
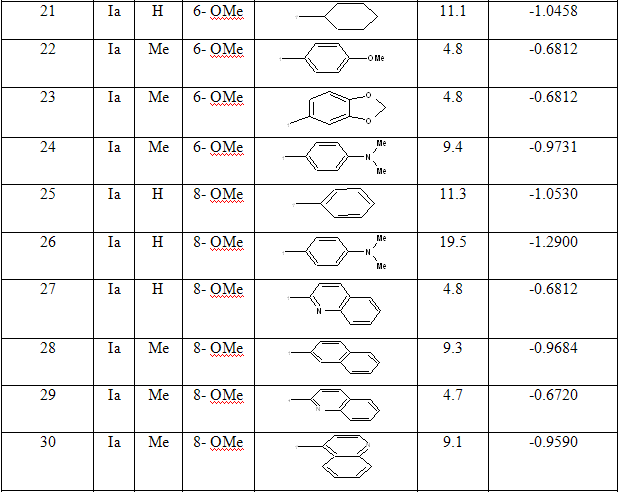
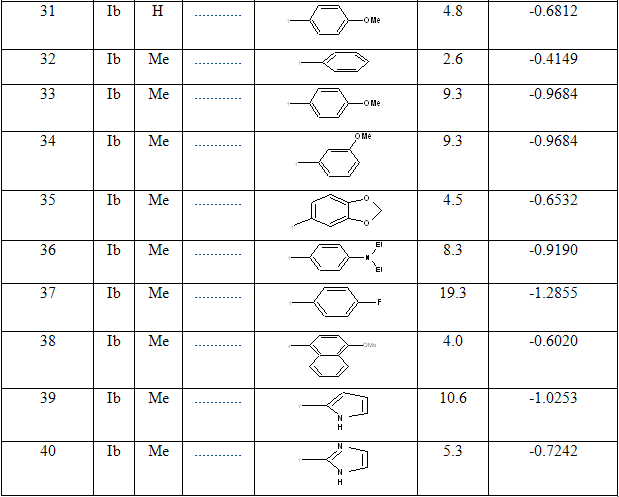
Table 1: Biological activity data and structures of the compounds in the series
NOW YOU CAN ALSO PUBLISH YOUR ARTICLE ONLINE.
SUBMIT YOUR ARTICLE/PROJECT AT articles@pharmatutor.org
Subscribe to Pharmatutor Alerts by Email
FIND OUT MORE ARTICLES AT OUR DATABASE
2D-QSAR Methodology
The molecular structures of the compounds in selected series were sketched using V-life MDS 3.5 of V-Life sciences molecular modeling software. The sketched structures were then transferred to three dimensional structures (3D). The geometries of generated 3D structures were optimized using MFF94 force field as implemented in the V-Life MDS3.5. The gradient norm 0.001 kcal/Å was used to calculate electronic, geometric and energetic parameters for the isolated molecules. The optimized geometries of the molecules were used to compute the necessary quantum chemical descriptors available in the V-Life MDS 3.5. Further, calculated some selected molecular descriptors available in the software V-Life MDS3.0 Variable-selection for the QSAR modeling was carried out by stepwise partial least square regression method (PLS) using statistical program of V-Life MDS 3.5. The program employs a stepwise technique, i.e., only one parameter at a time was added to a model and always in the order of most significant to least significant in terms of F-test values. Statistical parameters were calculated subsequently for each step in the process, so the significance of the added parameter could be verified. The goodness of the correlation is tested by the regression coefficient (r2), the F-test and the standard error of estimate (SEE). The correlation coefficient values closer to 1.0 represent the better fit of the model. The F-test reflects the ratio of the variance explained by the model and the variance due to the error in the model (i.e., the variance not explained by the model). High values of the F-test indicate that the model is statistically significant. Finally, the derived QSAR models were used for the prediction of the activity values of the compounds in the test set and the external validation parameter, predictive r2 (r2pred) was calculated for evaluating the predictive capacity of the model. A value of r2_ pred. greater than 0.5 indicates the good predictive capacity of the QSAR model. For the 2D QSAR study various 2D descriptors were calculated by inserting the data of optimized compounds and the biological activity in 2D QSAR worksheet. Various types of physicochemical descriptors have been calculated which are shown in the data sheet table 2.
Table 2: Data sheet of calculated descriptors
|
Compound |
-logMIC |
H-Donor Count |
SsCH3E-index
|
|
KK01.mol2 |
-1.2148 |
1 |
1.646251
|
|
KK02.mol2 |
-0.9912 |
1 |
3.288304
|
|
KK03.mol2 |
-0.7242 |
2 |
1.630174
|
|
KK04.mol2 |
-0.4313 |
2 |
1.627815
|
|
KK05.mol2 |
-0.9867 |
1 |
1.637827
|
|
KK07.mol2 |
-1.0718 |
1 |
1.642779
|
|
KK08.mol2 |
0.2218 |
1 |
1.649924
|
|
KK09.mol2 |
0.2218 |
1 |
3.319397
|
|
KK11.mol2 |
-0.9777 |
1 |
1.645436
|
|
KK12.mol2 |
-0.3424 |
1 |
3.284929
|
|
KK13.mol2 |
-0.9867 |
1 |
3.610764
|
|
KK14.mol2 |
-1.2900 |
1 |
5.253059
|
|
KK15.mol2 |
-0.6627 |
1 |
3.606825
|
|
KK16.mol2 |
-0.6627 |
1 |
3.614723
|
|
KK17.mol2 |
-0.9542 |
1 |
3.921848
|
|
KK18.mol2 |
-1.0086 |
1 |
3.291608
|
|
KK19.mol2 |
-0.3802 |
1 |
1.641294
|
|
KK20.mol2 |
-1.2900 |
1 |
5.695565
|
|
KK21.mol2 |
-1.0458 |
1 |
1.672486
|
|
KK23.mol2 |
-0.6812 |
1 |
3.601268
|
|
KK24.mol2 |
-0.9731 |
1 |
7.676175
|
|
KK25.mol2 |
-1.0530 |
1 |
1.642967
|
|
KK26.mol2 |
-1.2900 |
1 |
5.687547
|
|
KK27.mol2 |
-0.6812 |
1 |
1.63899
|
|
KK28.mol2 |
-0.9684 |
1 |
3.621064
|
|
KK29.mol2 |
-0.6720 |
1 |
3.598311
|
|
KK30.mol2 |
-0.9590 |
1 |
3.606882
|
|
KK31.mol2 |
-0.6812 |
1 |
1.64356
|
|
KK32.mol2 |
-0.4149 |
1 |
1.954478
|
|
KK33.mol2 |
-0.9684 |
1 |
3.59269
|
|
KK34.mol2 |
-0.9684 |
1 |
3.588887
|
|
KK35.mol2 |
-0.6532 |
1 |
1.941225
|
|
KK36.mol2 |
-0.9190 |
1 |
6.289273
|
|
KK37.mol2 |
-1.2855 |
1 |
1.915566
|
|
KK39.mol2 |
-1.0253 |
2 |
1.948305
|
|
KK40.mol2 |
-0.7242 |
2 |
1.935959
|
|
T_C_C_2
|
T_C_N_4
|
3cluster count |
Polar surface area excluding P& S |
|
20
|
10
|
5 |
45.98 |
|
21
|
10
|
6 |
55.21 |
|
20
|
10
|
6 |
66.21 |
|
20
|
10
|
6 |
66.21 |
|
22
|
10
|
7 |
64.44 |
|
16
|
9
|
5 |
61.77 |
|
28
|
10
|
7 |
45.98 |
|
29
|
10
|
8 |
55.21 |
|
25 |
13 |
7 |
58.34 |
|
26 |
13 |
8 |
67.57 |
|
21
|
10
|
6 |
55.21 |
|
22
|
11
|
7 |
55.21 |
|
25
|
11
|
8 |
58.34 |
|
26
|
14
|
8 |
58.34 |
|
23
|
11
|
8 |
64.44 |
|
21
|
10
|
6 |
55.21 |
|
22
|
10
|
7 |
64.44 |
|
23
|
11
|
7 |
49.22 |
|
20
|
10
|
5 |
45.98 |
|
23
|
11
|
8 |
64.44 |
|
24
|
12
|
8 |
49.22 |
|
20
|
11
|
5 |
45.98 |
|
23
|
12
|
7 |
49.22 |
|
24
|
11
|
7 |
58.34 |
|
29 |
13 |
8 |
45.98 |
|
25
|
12
|
8 |
58.34 |
|
26
|
15
|
8 |
58.34 |
|
22
|
10
|
7 |
64.44 |
|
22
|
11
|
7 |
55.21 |
|
23
|
11
|
8 |
64.44 |
|
23
|
11
|
8 |
64.44 |
|
24
|
11
|
9 |
73.67 |
|
25
|
12
|
9 |
58.45 |
|
22
|
11
|
8 |
55.21 |
|
18
|
10
|
7 |
71 |
|
16
|
9
|
7 |
83.36 |
The best model generated after 2D QSAR study on the basis of all above mentioned parameters is given below:
Table 3: Statistical and validation parameters of five different Models
|
Model no. |
N |
Degree of freedom |
r2 |
q2 |
F- test |
r2_se |
q2_se |
pred_r2 |
pred_r2se |
|
Model1 |
28 |
22 |
0.75 |
0.67 |
22.63 |
0.20 |
0.23 |
0.46 |
0.24 |
|
Model2 |
29 |
23 |
0.70 |
0.57 |
17.92 |
0.22 |
0.26 |
0.45 |
0.24 |
|
Model3 |
28 |
21 |
0.75 |
0.67 |
23.74 |
0.19 |
0.22 |
0.44 |
0.26 |
|
Model4 |
24 |
19 |
0.70 |
0.58 |
18.65 |
0.21 |
0.26 |
0.40 |
0.25 |
|
Model5 |
28 |
22 |
0.70 |
0.58 |
19.16 |
0.21 |
0.26 |
0.39 |
0.26 |
NOW YOU CAN ALSO PUBLISH YOUR ARTICLE ONLINE.
SUBMIT YOUR ARTICLE/PROJECT AT articles@pharmatutor.org
Subscribe to Pharmatutor Alerts by Email
FIND OUT MORE ARTICLES AT OUR DATABASE
3D QSAR Study
3D QSAR studies also done by using VLife MDS software on a series of 4-Quinolylhydrazone reported by Sandra Gemmaet al.in Journal Bioorganic & Medicinal Chemistry 2009 available online at sciencedirect.com. The biological activity data given as in MIC values. The biological activity value [MIC (µM)] reported in literature are converted to -log scale and subsequently used as the dependent variable for the QSAR analysis. Molecules were sketched using the VLife MDS software and it converted into 3-D.
3D QSAR leads to identification of various local interacting molecular features responsible for activity variation and hence aid in design of novel potential molecules. In addition, it provides a mathematical model, which can be used to quantitatively predict the activity of newly designed molecules. A set of aligned molecules with known biological response forms the basis to perform 3D-QSAR studies.
Ø In present study firstly conformers were generated for each molecule by Monte Carlo method and then the molecules were aligned. The conformer who had the least energy was selected for each molecule and then used for alignment.
Ø All the selected conformers were aligned on a selected template having the common lead structure among all the compounds by following the template based alignment process rules.
Ø After alignment, the aligned set of molecules were kept in a grid to calculate interaction energy fields descriptors such as electrostatic, steric and hydrophobic to be correlated with the biological response. It allowed setting the grid size/interval and both fields interaction energy cut-off.
Ø Then preliminary data analysis was done. It offered preliminary investigation of data by providing uni-column statistics, cross-correlation matrix and graphs. After that invariable columns were removed to reduce the data.
Ø For data pre-processing various scaling methods such as no-scaling, mean-centring and auto-scaling were provided. Among these methods mainly auto-scaling method was used.
Ø For model validation the dataset is required to be divided into training set (for building the QSAR model) and test set (for examining its predictive ability). For data selection biological activity was taken as dependent variable and rest of the descriptors were taken as independent variable. For model validation different ways were used to create training and test set such as manual, random and sphere exclusion algorithm. To select optimal subset of descriptors from available pool of descriptors various variable selection procedures like stepwise, simulated annealing, genetic algorithm etc. were used.
Ø Model Building method offered a variety of methods ranging from linear like MLR, PCR, PLSR to non-linear like neural networks, k-nearest neighbour. It displayed the resulting model descriptors along with its corresponding statistical parameters and contribution/fitness plot in a separated window. Mainly k-nearest neighbour method was used throughout the complete QSAR study for 3D QSAR work. Models were validated by both internal (cross-validation, q2) and external validation (predicted_r2). Resultsshowed the contributing grid points in the model and their distribution around set of aligned molecules. It allowed to save/retrieve the developed model, which can be used to predict activity of new designed molecule. It offers to use developed model in association with combinatorial library generation utility as a means of virtual screening.
The best model generated after 3D QSAR study on the basis of all above mentioned parameters is given below:
k nearest neighbour = 2; n = 33; degree of freedom =28 ; q2 = 0.5114 , q2_se = 0.2524 , Predr2 = 0.7182 , pred_r2se = 0.1667
E_916 (0.1865, 0.3006); S_591 (-0.2851, -0.2580); S_1027 (-0.3273, -0.3090); S_926 (30.000, 30.000)
RESULT AND DISCUSION
2D-QSAR STUDIES OF H37RV (MTB) INHIBITORS
In search of new and potent H37RV (MTB) inhibitors, QSAR analysis on a series of 4-Quinolylhydrazone was performed by using VLife software. Various physiochemical parameters were calculated for datasheet and after removing the invariable descriptors, 228 descriptors were used in model building. The physiochemical descriptors and inhibitory activity was taken as independent and dependent variables respectively. Correlations were established between the biological activity and calculated molecular physiochemical descriptors through partial least square (PLS) (Stepwise forward-backward).
Amongthe generated QSAR models; five models were selected on the basis of various statistical parameters such as square correlation co-efficient (r2) which is relative measure of quality of fit.Fischer’s value (F test)which represents F-ratio between the variance of calculated and observed activity, standard error (r2_se) representing absolute measure of quality of fit, and cross-validated square correlation co-efficient (q2), standard error of cross-validated square correlation co-efficient (q2_se), predicted squared regression (pred_r2)and standard error of predicted squared regression (pred_r2se)to estimate the predictive potential of the models respectively.
QSAR model generated for different inhibitory activity data were as follows:
Model 1:-n =26; Degree of freedom = 22; r2 = 0.75 ; q2 = 0.67 ; F test = 22.63 ; r2 se = 0.20 ; q2 se = 0.23; pred_r2 = 0.46 ; pred_r2 se = 0.24
MIC50 = + 0.1587 T_C_C_2- 0.0593 SsCH3E-index- 0.1395 T_C_N_4+ 0.3888 H-Donor Count -3.1556
Uni-Column Statistics: Training set
Column Name Average Max Min StdDev Sum
MIC 50 -0.7788 0.2218 -1.2900 0.3809 -21.0265
Uni-Column Statistics: Test set
Column Name Average Max Min StdDev Sum
MIC 50 -0.9409 -0.4313 -1.2900 0.2573 -8.4684
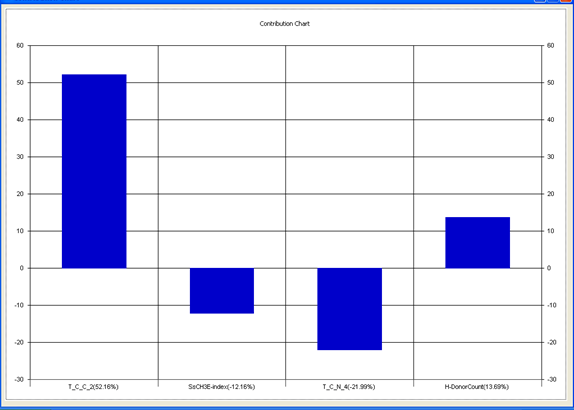
Model-1 has good correlation between biological activity and parameters as r2=0.75 and 75% variance in inhibitory activity. The low standard error of r2_se=0.20 demonstrates accuracy of the model. F value shows the 99.9% statistical significance of the regression model. Validation parameters high Pred_r2=0.46, cross validated q2=0.67 and low Pred_r2se=0.24 and q2_se=0.23 reflects the very good predictive power of the model. In this model four descriptors T_C_C_2, SsCH3E-index, T_C_N_4, and H-Donor Count were highly correlated to biological activity. The good agreement between experimental and predicted value of the test set compounds.
T_C_C_2 This is the count of number of carbon atoms (single, double or triple bond ) separated from any other carbon atoms (single, double or triple bond ) by two bonds in a molecule. It is positively correlated with biological activity.
SsCH3 E-index is electro topological state indices for the total no of –CH3 group connected with single bonds. It is negatively correlated with biological activity.
T_C_N_4 This is the count of number of Nitrogen atoms separated from any Nitrogen atom by 4 bonds in a molecule. It shows negative correlation with biological activity.
H-Donor CountThis is the count of number of number of H-bond donor atoms. It shows possitive correlation with biological activity.
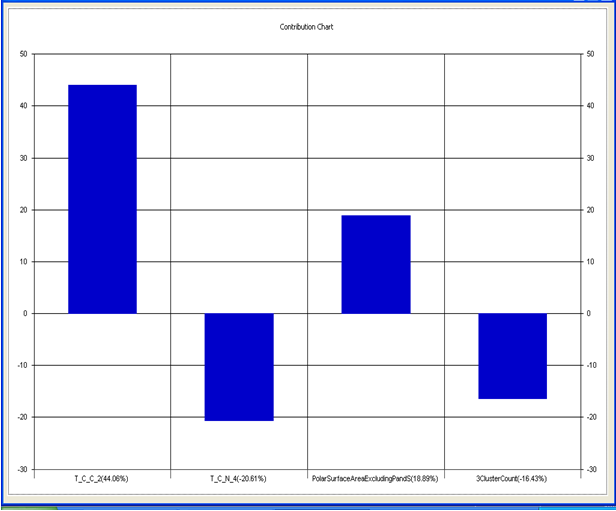
Chart 1: Contribution chart for model-1
Graph 1:Fitness Plot between the experimental [-Log MIC (µM)] and Predicted Activities Log MIC (µM)] for model-1 [Training Set (red spots) and test set (blue spots)
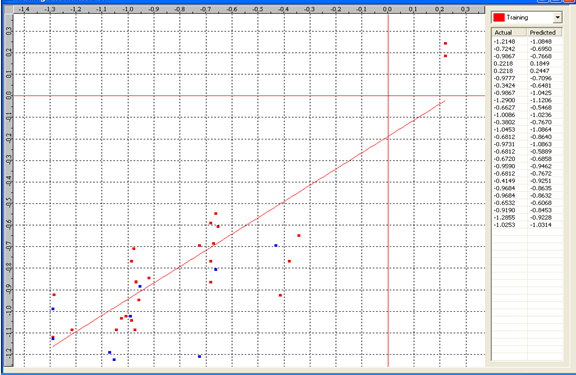
Table 4: Correlation matrix of different parameters in model-1
|
H-DonorCount |
SsCH3E-index |
T_C_C_2 |
T_C_N_4 |
Score |
|
|
H-DonorCount |
1 |
-0.33744 |
-0.6332 |
-0.42844 |
4 |
|
SsCH3E-index |
-0.33744 |
1 |
0.340002 |
0.412811 |
4 |
|
T_C_C_2 |
-0.6332 |
0.340002 |
1 |
0.639349 |
4 |
|
T_C_N_4 |
-0.42844 |
0.412811 |
0.639349 |
1 |
4 |
NOW YOU CAN ALSO PUBLISH YOUR ARTICLE ONLINE.
SUBMIT YOUR ARTICLE/PROJECT AT articles@pharmatutor.org
Subscribe to Pharmatutor Alerts by Email
FIND OUT MORE ARTICLES AT OUR DATABASE
Model 2:-n =27; Degree of freedom =23; r2 = 0.70; q2 = 0.57; F test = 17.92; r2 se = 0.22 ; q2 se = 0.26; pred_r2 = 0.45 ; pred_r2 se = 0.24
MIC50 = + 0.1657 T_C_C_2 - 0.1719 T_C_N_4 + 0.0259 Polar surface area excluding P & S - 0.1617 3 Cluster Count-3.0856
Uni-Column Statistics: Training set
Column Name Average Max Min StdDev Sum
MIC 50 -0.7792 0.2218 -1.2900 0.3812 -21.0387
Uni-Column Statistics: Test set
Column Name Average Max Min StdDev Sum
MIC 50 -0.9396 -0.4313 -1.2900 0.2868 -8.4562
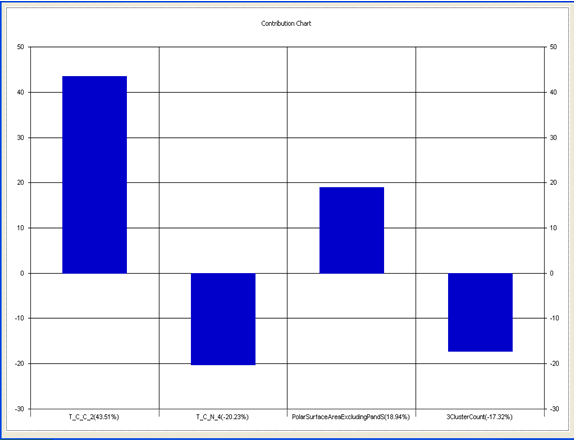
Model-2 has good correlation between biological activity and parameters as r2=0.70 and 70% variance in inhibitory activity. The low standard error of r2_se=0.22 demonstrates accuracy of the model. F value shows the 99.9% statistical significance of the regression model. Validation parameters high Pred_r2=0.45, cross validated q2=0.57 and low Pred_r2se=0.24 and q2_se=0.26 reflects the very good predictive power of the model. In this model four descriptors T_C_C_2 , Polar surface area excluding P & S, T_C_N_4 , and 3 Cluster Count were highly correlated to biological activity. The good agreement between experimental and predicted value of the test set compounds.
T_C_C_2 This is the count of number of carbon atoms (single, double or triple bond) separated from any other carbon atoms (single, double or triple bond) by two bonds in a molecule. It is positively correlated with biological activity.
Polar surface area excluding P & S is the total polar surface area excluding P & S. It is positively correlated with biological activity.
T_C_N_4 This is the count of number of Nitrogen atoms separated from any Nitrogen atom by 4 bonds in a molecule. It shows negative correlation with biological activity.
3 Cluster CountThis is the total number of fragment of third order cluster in a molecule. It shows negative correlation with biological activity.
Chart 5.2: Contribution chart for model-2
Graph 2:Fitness Plot between the experimental [-Log MIC (µM)] and Predicted Activities Log MIC (µM)] for model-2 [Training Set (red spots) and test set (blue spots)]
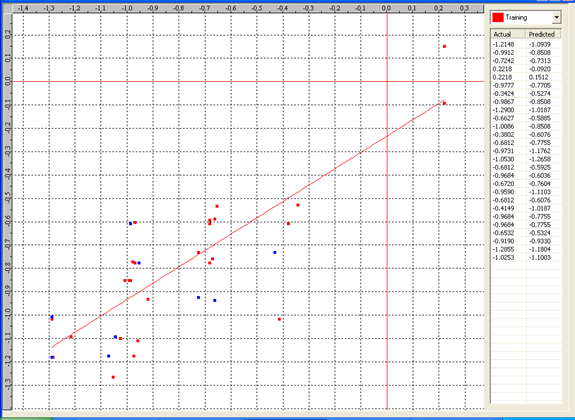
Table 5: Correlation matrix of different parameters in model-2
|
3ClusterCount |
Polar Surface Area Excluding P and S |
T_C_C_2 |
T_C_N_4 |
Score |
|
|
3ClusterCount |
1 |
0.293994 |
0.652216 |
0.531929 |
4 |
|
PolarSurfaceArea ExcludingPandS |
0.293994 |
1 |
-0.33318 |
-0.19601 |
4 |
|
T_C_C_2 |
0.652216 |
-0.33318 |
1 |
0.639349 |
4 |
|
T_C_N_4 |
0.531929 |
-0.19601 |
0.639349 |
1 |
4 |
Model 3:-n = 27; Degree of freedom = 23; r2 = 0.75 ; q2 = 0.67 ; F test = 23.74 ; r2 se = 0.19 ; q2 se = 0.22; pred_r2 = 0.44 ; pred_r2 se = 0.26
MIC50 = + 0.1591 T_C_C_2 - 0.0604 SsCH3E-index - 0.1390 T_C_N_4 + 0.3927 H-Donor Count-3.1720
Uni-Column Statistics: Training set
Column Name Average Max Min StdDev Sum
MIC 50 -0.7850 0.2218 -1.2900 0.3753 -21.9807
Uni-Column Statistics: Test set
Column Name Average Max Min StdDev Sum
MIC 50 -0.9393 -0.4313 -1.2900 0.3071 -7.5142
Model-3 has good correlation between biological activity and parameters as r2=0.75 and 75% variance in inhibitory activity. The low standard error of r2_se=0.19 demonstrates accuracy of the model. F value shows the 99.9% statistical significance of the regression model. Validation parameters high Pred_r2=0.44, cross validated q2=0.67 and low Pred_r2se=0.26 and q2_se=0.22 reflects the very good predictive power of the model. In this model four descriptors T_C_C_2 , SsCH3E-index , T_C_N_4 , and H-Donor Count were highly correlated to biological activity. The good agreement between experimental and predicted value of the test set compounds.
T_C_C_2 This is the count of number of carbon atoms (single, double or triple bond ) separated from any other carbon atoms (single, double or triple bond ) by two bonds in a molecule. It is positively correlated with biological activity.
SsCH3 E-index is electro topological state indices for the total no of –CH3 group connected with single bonds. It is negatively correlated with biological activity.
T_C_N_4 This is the count of number of Nitrogen atoms separated from any Nitrogen atom by 4 bonds in a molecule. It shows negative correlation with biological activity.
H-Donor CountThis is the count of number of number of H-bond donor atoms. It shows possitive correlation with biological activity
Chart 3: Contribution chart for model-3

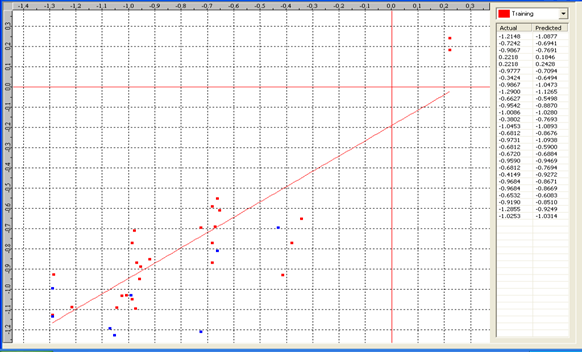
Table 6: Correlation matrix of different parameters in model-3
|
|
T_C_C_2 |
T_C_N_4 |
SsCH3E-index |
H-DonorCount |
Score |
|
|
T_C_C_2 |
|
1 |
0.639349 |
0.340002 |
-0.6332 |
4 |
|
T_C_N_4 |
|
0.639349 |
1 |
0.412811 |
-0.42844 |
4 |
|
SsCH3E-index |
|
0.340002 |
0.412811 |
1 |
-0.33744 |
4 |
|
H-DonorCount |
|
-0.6332 |
-0.42844 |
-0.33744 |
1 |
4 |
NOW YOU CAN ALSO PUBLISH YOUR ARTICLE ONLINE.
SUBMIT YOUR ARTICLE/PROJECT AT articles@pharmatutor.org
Subscribe to Pharmatutor Alerts by Email
FIND OUT MORE ARTICLES AT OUR DATABASE
Model 4:-n =27; Degree of freedom =23 ; r2 = 0.70 ; q2 = 0.58 ; F test = 18.65 ; r2 se = 0.21 ; q2 se = 0.26; pred_r2 = 0.40 ; pred_r2 se = 0.25
MIC50 = +0.1658 T_C_C_2 - 0.1737 T_C_N_4 + 0.0255 Polar surface area excluding P & S- 0.1696 3 Cluster Count-2.9828
Uni-Column Statistics: Training set
Column Name Average Max Min StdDev Sum
MIC 50 -0.7812 0.2218 -1.2900 0.3825 -21.0928
Uni-Column Statistics: Test set
Column Name Average Max Min StdDev Sum
MIC 50 -0.9336 -0.4313 -1.2900 0.2849 -8.4021
Model-4 has good correlation between biological activity and parameters as r2=0.70 and 70% variance in inhibitory activity. The low standard error of r2_se=0.21 demonstrates accuracy of the model. F value shows the 99.9% statistical significance of the regression model. Validation parameters high Pred_r2=0.40, cross validated q2=0.58 and low Pred_r2se=0.25 and q2_se=0.26 reflects the very good predictive power of the model. In this model four descriptors T_C_C_2 , Polar surface area excluding P & S, T_C_N_4 , and 3 Cluster Count were highly correlated to biological activity. The good agreement between experimental andbpredicted value of the test set compounds.
T_C_C_2 This is the count of number of carbon atoms (single, double or triple bond) separated from any other carbon atoms (single, double or triple bond) by two bonds in a molecule. It is positively correlated with biological activity.
Polar surface area excluding P & S is the total polar surface area excluding P & S. It is positively correlated with biological activity.
T_C_N_4 This is the count of number of Nitrogen atoms separated from any Nitrogen atom by 4 bonds in a molecule. It shows negative correlation with biological activity.
3 Cluster CountThis is the total number of fragment of third order cluster in a molecule. It shows negative correlation with biological activity.
Chart 4: Contribution chart for model-4
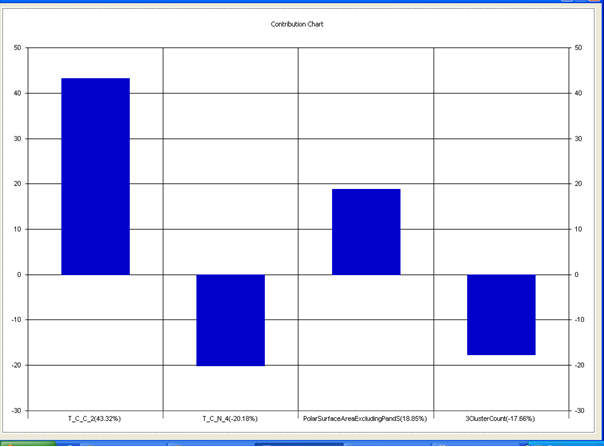
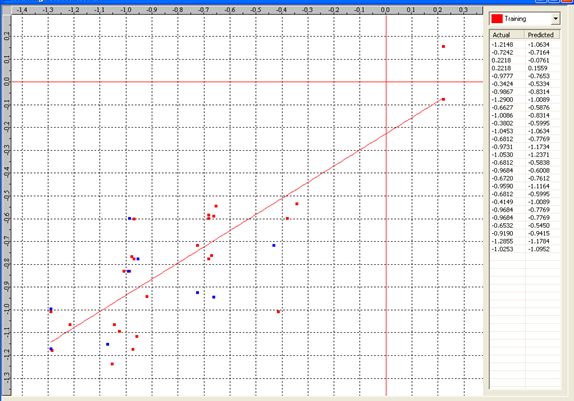
Table 7: Correlation matrix of different parameters in model-4
|
|
T_C_C_2 |
T_C_N_4 |
3ClusterCount |
PolarSurfaceArea ExcludingPandS |
Score |
|
|
T_C_C_2 |
|
1 |
0.639349 |
0.652216 |
-0.33318 |
4 |
|
T_C_N_4 |
|
0.639349 |
1 |
0.531929 |
-0.19601 |
4 |
|
3ClusterCount |
|
0.652216 |
0.531929 |
1 |
0.293994 |
4 |
|
PolarSurfaceArea ExcludingPandS |
|
-0.33318 |
-0.19601 |
0.293994 |
1 |
4 |
Model 5:-n = 28; Degree of freedom = 24; r2 = 0.70; q2 = 0.58; F test = 19.16; r2 se = 0.21 ; q2 se = 0.25; pred_r2 = 0.39 ; pred_r2 se = 0.26
MIC50 = + 0.1652 T_C_C_2 - 0.1724 T_C_N_4 + 0.0257 Polar surface area excluding P & S- 0.1635 3Cluster Count-3.0426
Uni-Column Statistics: Training set
Column Name Average Max Min StdDev Sum
MIC 50 -0.7887 0.2218 -1.2900 0.3775 -22.0840
Uni-Column Statistics: Test set
Column Name Average Max Min StdDev Sum
MIC 50 -0.9264 -0.4313 -1.2900 0.3037 -7.4109
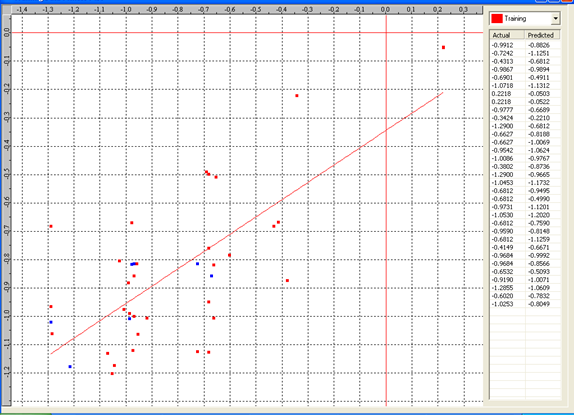
Model-5 has good correlation between biological activity and parameters as r2=0.70 and 70% variance in inhibitory activity. The low standard error of r2_se=0.21 demonstrates accuracy of the model. F value shows the 99.9% statistical significance of the regression model. Validation parameters high Pred_r2=0.39, cross validated q2=0.58 and low Pred_r2se=0.26 and q2_se=0.25 reflects the very good predictive power of the model. In this model four descriptors T_C_C_2, Polar surface area excluding P & S, T_C_N_4 , and 3 Cluster Count were highly correlated to biological activity. The good agreement between experimental andbpredicted value of the test set compounds.
T_C_C_2 This is the count of number of carbon atoms (single, double or triple bond) separated from any other carbon atoms (single, double or triple bond) by two bonds in a molecule. It is positively correlated with biological activity.
Polar surface area excluding P & S is the total polar surface area excluding P & S. It is positively correlated with biological activity.
T_C_N_4 This is the count of number of Nitrogen atoms separated from any Nitrogen atom by 4 bonds in a molecule. It shows negative correlation with biological activity.
3 Cluster CountThis is the total number of fragment of third order cluster in a molecule. It shows negative correlation with biological activity.
Chart 5: Contribution chart for model-5
Graph 5:Fitness Plot between the experimental [-Log MIC (µM)] and Predicted Activities Log MIC (µM)] for model-5 [Training Set (red spots) and test set (blue spots)]
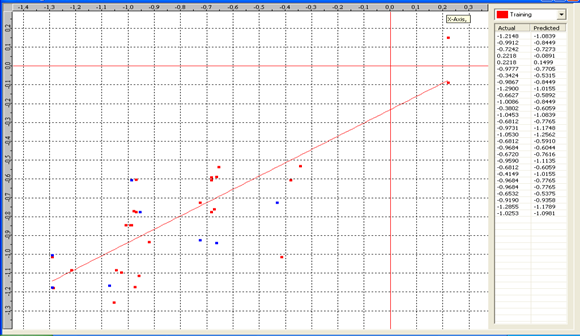
Table 8: Correlation matrix of different parameters in model-5
|
T_C_C_2 |
T_C_N_4 |
3ClusterCount |
PolarSurfaceArea ExcludingPandS |
Score |
|
|
T_C_C_2 |
1 |
0.639349 |
0.652216 |
-0.33318 |
4 |
|
T_C_N_4 |
0.639349 |
1 |
0.531929 |
-0.19601 |
4 |
|
3ClusterCount |
0.652216 |
0.531929 |
1 |
0.293994 |
4 |
|
PolarSurfaceArea ExcludingPandS |
-0.33318 |
-0.19601 |
0.293994 |
1 |
4 |
Z score value of different models
Table 9: Z score value of five different models
|
Dep Variable
|
ZScore R^2 |
ZScore Q^2 |
Best Rand R^2 |
Best Rand Q^2 |
Alpha Rand R^2 |
Alpha Rand Q^2 |
Z Score Pred R^2 |
best Rand Pred R^2 |
alpha Rand Pred R^2 |
|
Model-1 |
6.45373 |
5.79275 |
0.37075 |
0.01205 |
0.0000 |
0.0000 |
1.85882 |
0.37483 |
0.05000 |
|
Model-2 |
5.86697 |
5.41870 |
0.54992 |
0.29775 |
0.0000 |
0.0000 |
1.73060 |
0.66480 |
0.05000 |
|
Model-3 |
6.51768 |
4.70427 |
0.47172 |
0.253199 |
0.0000 |
0.00003 |
1.80682 |
0.70619 |
0.05000 |
|
Model-4 |
5.62691 |
4.96542 |
0.50596 |
0.35596 |
0.0000 |
0.00001 |
1.65438 |
0.52916 |
0.05000 |
|
Model-5 |
6.01945 |
5.53777 |
0.58390 |
0.33169 |
0.0000 |
0.0000 |
1.53078 |
0.62374 |
0.10000 |
Comparison of different models
The developed models were analyzed to find common properties of the H37RV (MTB) inhibitors, their positive or negative contribution in activity and check the predictivity of the model for new compounds of the same series before synthesis. Different parameters selected for different models are given in Table 10
Table 10: Different parameters selected for regression equation for different models
|
Model |
Parameter-1 |
Parameter-2 |
Parameter-3 |
Parameter-4 |
|
Model1 |
T_C_C_2 (+0.1587) |
SsCH3E-index (-0.0593) |
T_C_N_4 (- 0.1395 ) |
H-Donor Count (+ 0.3888) |
|
Model2 |
T_C_C_2 (+0.1657) |
Polar surface area excluding P & S (+0.0259) |
T_C_N_4 (- 0.1719 ) |
3 Cluster Count (- 0.1617) |
|
Model3 |
T_C_C_2 (+0.1591 ) |
SsCH3E-index (-0.0604) |
T_C_N_4 (- 0.1390) |
H-Donor Count (+ 0.3927) |
|
Model4 |
T_C_C_2 (+0.1658) |
Polar surface area excluding P & S (+0.0255) |
T_C_N_4 (- 0.1737) |
3 Cluster Count (- 0.1696) |
|
Model5 |
T_C_C_2 (+ 0.1652 ) |
Polar surface area excluding P & S (+ 0.0257) |
T_C_N_4 (- 0.1724) |
3 Cluster Count (- 0.1635) |
In this sequence, T_C_C_2 is a physico-chemical parameter common in five models. This parameter show positive contribution in five models. It is desirable properties of H37RV (MTB) inhibitors. One another interesting feature of H37RV (MTB) inhibitors is number of the Polar surface area excluding P & S present in compound which is common parameter in three models and it is positively contributing to H37RV (MTB) inhibitory activity so it is desirable properties of H37RV (MTB) inhibitors. H-Donor Count present in compound which is common parameter in two models out of five models. This parameter show positive contribution in five models.3 Cluster Count present in compound which is common parameter in three models out of five models. This parameter show negative contribution in five models. T_C_N_4 present in compound which is common parameter in five models. This parameter show negative contribution so decreasing the number of Nitrogen atoms separated from any Nitrogen atom by 4 bonds in a molecule is desirable properties of H37RV (MTB) inhibitors.
From comparison of different statistical parameters and validation parameters of the model-1, model-2, model-3 and model-4 mention in table no-5.8, find a result that model-1 is the significant model. it has good correlation between biological activity and parameters as r2=0.75 and 75% variance in inhibitory activity. The low standard error of r2_se=0.20 demonstrates accuracy of the model. F value shows the 99.9% statistical significance of the regression model. Validation parameters high Pred_r2=0.46, cross validated q2=0.67 and low Pred_r2se=0.24 and q2_se=0.23. Model -2, Model-3, Model-4 and model-5 also have good predictivity.
Actual and predicted activity with residual of best 2D model
Table11: Actual and predicted activities [MIC(µM)] with residual values for the 27 training set compounds of best 2D model
|
Compound No. |
Actual (-Log MIC) |
Predicted (-Log MIC) |
Residual(-Log MIC) |
|
01 |
-1.2848 |
-1.08479 |
-0.20001 |
|
03 |
-0.7242 |
-0.69502 |
-0.02918 |
|
05 |
-0.9867 |
-0.76680 |
-0.2199 |
|
08 |
0.2218 |
0.18496 |
0.03684 |
|
09 |
0.2218 |
0.24476 |
-0.02296 |
|
11 |
-0.9777 |
-0.70963 |
-0.26807 |
|
12 |
-0.3424 |
-0.64805 |
0.30565 |
|
13 |
-0.9867 |
-1.04248 |
0.05578 |
|
14 |
-1.2900 |
-1.12060 |
-0.1694 |
|
15 |
-0.6627 |
-0.54680 |
-0.1159 |
|
18 |
-1.0086 |
-1.02356 |
0.01496 |
|
19 |
-0.3802 |
-0.76700 |
0.3868 |
|
21 |
-1.0453 |
-1.08634 |
0.04104 |
|
23 |
-0.6812 |
-0.86396 |
0.18276 |
|
24 |
-0.9731 |
-1.08626 |
0.11316 |
|
27 |
-0.6812 |
-0.58891 |
-0.09229 |
|
28 |
-0.9684 |
-0.19173 |
-0.77667 |
|
29 |
-0.6720 |
-0.68583 |
0.01383 |
|
30 |
-0.9590 |
-0.94621 |
-0.01279 |
|
31 |
-0.6812 |
-0.76714 |
0.08594 |
|
32 |
-0.4149 |
-0.9251 |
1.34 |
|
33 |
-0.9684 |
-0.86345 |
-0.10495 |
|
34 |
-0.9684 |
-0.86323 |
-0.10517 |
|
35 |
-0.6532 |
-0.60683 |
-0.04637 |
|
36 |
-0.9190 |
-0.84532 |
-0.07368 |
|
37 |
-1.2855 |
-0.9228 |
-0.3627 |
|
39 |
-1.0253 |
-1.03136 |
0.00606 |
Table12: Actual and predicted activities [MIC(µM)] with residual values for the 09 test set compounds of best 2D model
|
Compound No. |
Actual (-Log MIC) |
Predicted (-Log MIC) |
Residual(-Log MIC) |
|
02 |
-0.9912 |
-1.02336 |
0.03216 |
|
04 |
-0.4313 |
-0.69488 |
0.26358 |
|
07 |
-1.0718 |
-1.19121 |
0.11941 |
|
16 |
-0.6627 |
-0.80714 |
0.14444 |
|
17 |
-0.9542 |
-0.88296 |
-0.07124 |
|
20 |
-1.2900 |
-0.98808 |
-0.30192 |
|
25 |
-1.0530 |
-1.22413 |
0.17113 |
|
26 |
-1.2900 |
-1.12715 |
-0.16285 |
|
40 |
-0.7242 |
-1.20858 |
0.48438 |
3D-QSAR STUDIES OF H37RV (MTB) INHIBITORS
3D-QSAR analysis on a series of 4-quinolylhydrazones was performed by using VLife software. Various Electrostatic, steric and hydrophobic descriptor were calculated for datasheet and after removing the invariable descriptors, 3917 descriptors were used in model building. The 3D worksheet has generated by keeping set dielectric constant 1.0, set charge type Gasteiger-Marsili, probe atom-C, charge 1.0, cut off electrostatic 10.0 kcal/mol and steric 30.0 kcal/mol. The descriptors and inhibitory activity was taken as independent and dependent variables respectively. Correlations were established between the biological activity and calculated descriptors through k-nearest neighbor method (KNN) (Stepwise forward-backward).
cross-validated square correlation co-efficient (q2), standard error of cross-validated square correlation co-efficient(q2_se), predicted squared regression (pred_r2) and standard error of predicted squared regression (pred_r2se)to estimate the predictive potential of the models respectively.
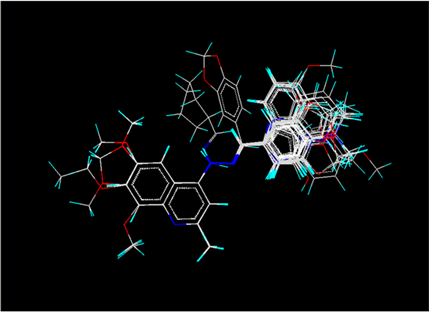
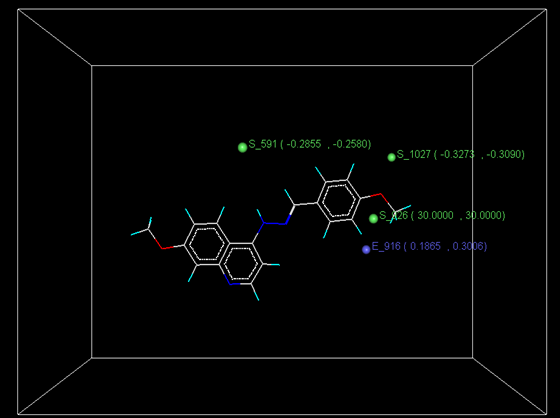
The kNN-MFA models provide direction for the design of new molecules in a rather convenient way. KNN-MFA models show the grid which show the point contribute SW kNN-MFA. The range of property values for the chosen points may aid in the design of new potent molecules. The range is based on the variation of the field values at the chosen points using the most active molecule and its nearest neighbour set. The distribution point in the SW kNN-MFA suggested that the substitution of electropositive group at the 3rd position of benzene ring favours anti-tubercular activity. It also suggested that in potent compound to decrease bulkiness around 5th position and increase electrostatic potential at 3rd position of naphthalene ring favours anti-tubercular activity. The location and field values of this point can be used for the design of novel and better molecules.
Model:
k nearest neighbour = 2; n = 33; degree of freedom =28 ; q2 = 0.5114 , q2_se = 0.2524 , Predr2 = 0.7182 , pred_r2se = 0.1667
E_916 (0.1865, 0.3006); S_591 (-0.2851, -0.2580); S_1027 (-0.3273, -0.3090); S926 (30.000 , 30.000)
NOW YOU CAN ALSO PUBLISH YOUR ARTICLE ONLINE.
SUBMIT YOUR ARTICLE/PROJECT AT articles@pharmatutor.org
Subscribe to Pharmatutor Alerts by Email
FIND OUT MORE ARTICLES AT OUR DATABASE
FITNESS PLOTS
Graph 6: Fitness Plot between the experimental [-Log MIC (µM)] and Predicted Activities [-Log MIC (µM)] for 3D-model [Training Set (red spots) and test set (blue spots)].
Actual and predicted activity with residual of best 3D model
GRID OF 3D MODEL
Figure 3: Distribution of point in the SW kNN-MFA
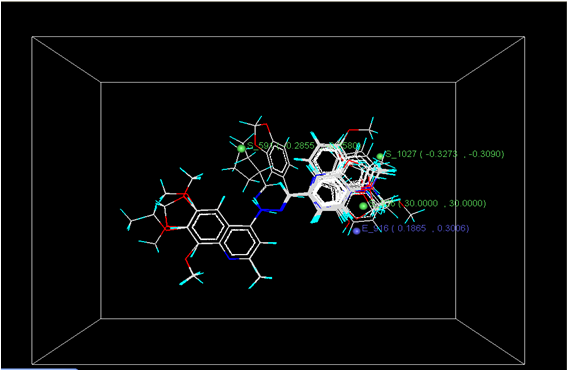
Figure 4: Distribution of point in the SW kNN-MFA
Actual and predicted activity with residual of best 3D model
Table13: Actual and predicted activities [MIC(µM)] with residual values for the 33 training set compounds of best 3D model
|
Compound No. |
Actual (-Log MIC) |
Predicted (-Log MIC) |
Residual(-Log MIC) |
|
02 |
-0.9912 |
-0.88261 |
-0.10859 |
|
03 |
-0.7242 |
-1.12513 |
0.40093 |
|
04 |
-0.4313 |
-0.6812 |
0.2499 |
|
05 |
-0.9867 |
-0.98942 |
0.00272 |
|
06 |
-0.6901 |
-0.49112 |
-0.19898 |
|
07 |
-1.0718 |
-1.13115 |
0.05935 |
|
08 |
0.2218 |
-0.05025 |
0.27205 |
|
09 |
0.2218 |
-0.05218 |
0.27398 |
|
10 |
-0.9777 |
-0.66894 |
-0.30876 |
|
12 |
-0.3424 |
-0.22104 |
-0.12136 |
|
14 |
-1.2900 |
-0.6812 |
-0.6088 |
|
15 |
-0.6627 |
-0.81884 |
0.15614 |
|
16 |
-0.6627 |
-1.00686 |
0.34416 |
|
17 |
-0.9542 |
-1.0624 |
0.1082 |
|
18 |
-1.0086 |
-0.97666 |
-0.03194 |
|
19 |
-0.3802 |
-0.87359 |
0.49339 |
|
20 |
-1.2900 |
-0.96652 |
-0.32348 |
|
21 |
-1.0453 |
-1.17322 |
0.12792 |
|
22 |
-0.6812 |
-0.94955 |
0.26835 |
|
23 |
-0.6812 |
-0.49896 |
-0.18224 |
|
24 |
-0.9731 |
-1.12008 |
0.14698 |
|
25 |
-1.0530 |
-1.20197 |
0.14897 |
|
27 |
-0.6812 |
-0.75903 |
0.07783 |
|
30 |
-0.9590 |
-0.81479 |
-0.14421 |
|
31 |
-0.6812 |
-1.12593 |
0.44473 |
|
32 |
-0.4149 |
-0.66712 |
0.25222 |
|
33 |
-0.9684 |
-0.99921 |
0.03081 |
|
34 |
-0.9684 |
-0.85657 |
-0.11183 |
|
35 |
-0.6532 |
-0.50932 |
-0.14388 |
|
36 |
-0.9190 |
-1.00707 |
0.08807 |
|
37 |
-1.2855 |
-1.06092 |
-0.22458 |
|
38 |
-0.602 |
-0.7832 |
0.1812 |
|
39 |
-1.0253 |
-0.80485 |
-0.22045 |
Table14: Actual and predicted activities [MIC(µM)] with residual values for the 07 test set compounds of best 3D model
|
Compound No. |
Actual (-Log MIC) |
Predicted (-Log MIC) |
Residual(-Log MIC) |
|
01 |
-1.2848 |
-1.17767 |
-0.10713 |
|
11 |
-0.9777 |
-0.81692 |
-0.16078 |
|
13 |
-0.9867 |
-1.00805 |
0.02135 |
|
26 |
-1.2900 |
-1.0202 |
-0.2698 |
|
28 |
-0.9684 |
-0.81525 |
-0.15315 |
|
29 |
-0.6720 |
-0.85806 |
0.18606 |
|
40 |
-0.7242 |
-0.81508 |
0.09088 |
DESIGNING
Table15: Predicted activity of new designed compound in 2D
|
S. NO. |
Compound Name |
Predicted Activity -Log MIC |
Predicted Activity MIC(µM) |
|
1 |
DKK01 |
-0.67461 |
4.7272 |
|
2 |
DKK02 |
-0.54627 |
3.5177 |
|
3 |
DKK03 |
-0.73593 |
5.4441 |
|
4 |
DKK04 |
-0.57979 |
3.8000 |
|
5 |
DKK05 |
-0.39087 |
2.4596 |
|
6 |
DKK06 |
-0.26616 |
1.8456 |
|
7 |
DKK07 |
-0.51992 |
3.3107 |
|
8 |
DKK08 |
0.329093 |
0.4687 |
|
9 |
DKK09 |
-0.89714 |
7.8911 |
|
10 |
DKK10 |
-0.4269 |
2.6723 |
|
11 |
DKK11 |
-0.39342 |
2.4741 |
|
12 |
DKK12 |
-0.26248 |
1.8301 |
|
13 |
DKK13 |
-0.48011 |
3.0207 |
|
14 |
DKK14 |
0.772158 |
0.1689 |
|
15 |
DKK15 |
1.365823 |
0.0430 |
Table16: Predicted activity of new designed compound in 3D with calculated steric & electrostatic property
|
S. NO. |
Compound Name |
E_916 (0.1865, 0.3006) |
S_591 (-0.2851, -0.2580) |
S_1027 (-0.3273, -0.3090) |
S926 (30.000, 30.000)
|
Predicted Activity -Log MIC |
Predicted Activity MIC(µM) |
|
1 |
DKK01 |
-1.19949 |
-0.2565 |
-0.22524 |
30 |
-0.84583 |
7.01180 |
|
2 |
DKK02 |
10 |
-0.22817 |
-0.27298 |
4.189866 |
-0.62987 |
4.26451 |
|
3 |
DKK03 |
0.517635 |
-0.25499 |
-0.07742 |
30 |
-0.54761 |
3.52866 |
|
4 |
DKK04 |
10 |
-0.22787 |
-0.14582 |
2.562889 |
-0.62932 |
4.2591 |
|
5 |
DKK05 |
10 |
-0.22864 |
-0.27554 |
3.172638 |
-0.62952 |
4.26108 |
|
6 |
DKK06 |
0.989038 |
-0.24101 |
-0.16989 |
30 |
-0.8571 |
7.1961 |
|
7 |
DKK07 |
10 |
-0.22923 |
3.22547 |
2.737347 |
-0.78574 |
6.10576 |
|
8 |
DKK08 |
10 |
-0.22839 |
-0.22197 |
7.05001 |
-0.6306 |
4.2716 |
|
9 |
DKK09 |
-7.79945 |
-0.22989 |
2.232916 |
2.162859 |
-0.54971 |
3.5457 |
|
10 |
DKK10 |
-10 |
-0.22943 |
-0.22222 |
4.31465 |
-0.53175 |
3.4021 |
|
11 |
DKK11 |
-10 |
-0.22873 |
3.033786 |
3.564285 |
-0.54488 |
3.5065 |
|
12 |
DKK12 |
-10 |
-0.228 |
-0.30503 |
3.339467 |
-0.52993 |
3.3878 |
|
13 |
DKK13 |
-10 |
-0.22882 |
-0.16832 |
3.96551 |
-0.53123 |
3.3980 |
|
14 |
DKK14 |
-1.09875 |
-0.24208 |
-0.29391 |
30 |
-0.84561 |
7.0082 |
|
15 |
DKK15 |
10 |
-0.22778 |
-0.41179 |
-1.06399 |
-0.62837 |
4.2498 |
Conclusion
On the basis 2DQSAR & 3DQSAR study we have designed some new molecules. All designed compound showed good anti-tubercular activity (predicted activity). The predicted activity of designed compound DKK8 (MIC=0.4687), DKK14 (MIC=0.1689), and DKK15 (MIC=0.0430), in 2D were found to be most active as compare to the compound reported in the series reported in table 4.1. While in 3D the predicted activity of designed compound DKK8 (MIC=4.2716), DKK14 (MIC=7.0082), and DKK15 (MIC=4.2498), were found as equipotent with the compound reported in the series.
REFERENCES
1. C. Dye, S. Scheele, P. Dolin, V. Pathania, M. C. Raviglione, J. Am. Med. Assoc. 282 (1999) 677-686.
2. World Health Organization, Tuberculosis Fact Sheet. (2006) 104.
3. S. Eswaran, V. A. Airody, N. S. Shetty, Synthesis and antimicrobial activities of novel quinoline derivatives carrying 1,2,4-triazole moiety , Eur. J. of Med. Chem. (2009).
4. A. Marco, Loza-Mejía, Synthesis, cytotoxic activity, DNA topoisomerase-II inhibition, molecular modeling and structure–activity relationship of 9- anilinothiazolo[5,4-b]quinoline derivatives, Bioorg. Med. Chem. 17 (2009) 3266-3277
5. M. Sharma, V. Chaturvedi, Substituted quinolinyl chalcones and quinolinyl pyrimidines as a new class of anti-infective agents. Eur. J. of Med. Chem. 44 (2009) 2081-2091
6. W. Maixner, P. Stephen, Long Pharmacological effects of 2-aminotetralins, octahydrobenzo[f]quinolines and clonidine on the isolated guinea pig ileum Eur. J. of Pharmacology. 71 (1981) 475-482
7. Halehatty R. Prakash Naik, Halehatty S. Bhojya Naik, Synthesis of novel benzo[h]quinolines: Wound healing, antibacterial, DNA binding and in vitro antioxidant activity, Eur. J. of Med. Chem., 44( 2009) 981-989.
8. D. E. Ryono, J. Lloyd, M. A. Poss , Orally active prodrugs of quinoline-4-carboxylic acid angiotensin II receptor antagonists, Bioorg. Med. Chem. Let. 4 (1994) 201-206.
9. P. Palit, P. Paira, A. Hazra, Phase transfer catalyzed synthesis of bis-quinolines: Antileishmanial activity in experimental visceral leishmaniasis and in vitro antibacterial evaluation, Eur. J. of Med. Chem. 44 (2009) 845-853
10. Koneni V. Sashidhara, A. Kumar, M. M. Khan, Antidyslipidemic and antioxidative activities of 8-hydroxyquinoline derived novel keto-enamine Schiffs bases, Eur. J. of Med. Chem. 44 (2009) 1813-1818
11. A.B.A. El-Gazzar, H. N. Hafez, G.A.M. Nawwar, New acyclic nucleosides analogues as potential analgesic, anti-inflammatory, anti-oxidant and anti-microbial derived from pyrimido[4,5-b]quinolines, Eur. J. of Med. Chem. 44 (2009) 1427-1436.
12. Z. G. Luo, C. C. Zeng, Synthesis of 6-sulfamoyl-4-oxoquinoline-3-carboxylicacid derivatives as integrase antagonists with anti-HIV activity Chin. Chem. Lett. 20 (2009) 789-792
13. Sandra Gemma, Luisa Savini, Development of antitubercular compounds based on a 4-quinolylhydrazones. Bioorg. Med. Chem. 17 (2009) 6063-6072.
14. VLifeMDS3.5; Molecular Design Suite, Vlife Sciences Technologies Pvt. Ltd., Pune, India, (2004) (vlifesciences.com).
NOW YOU CAN ALSO PUBLISH YOUR ARTICLE ONLINE.
SUBMIT YOUR ARTICLE/PROJECT AT articles@pharmatutor.org
Subscribe to Pharmatutor Alerts by Email
FIND OUT MORE ARTICLES AT OUR DATABASE