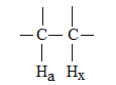
Q.5.(c) In NMR spectroscopy, explain shift correlation spectra- COSY and its application in simplifying complex HNMR spectra.
Ans.5. (c) COSY (Correlation SpectroscopY): COSY is a method of two-dimensional spectroscopy and also known as H-H correlation spectroscopy. In a COSY experiment, the chemical shift range of the proton spectrum is plotted on both axes.
[adsense:336x280:8701650588]
COSY TECHNIQUE:
When a splitting pattern obtained for a particular proton and interpret it in terms of the numbers of protons located on adjacent carbons, we are using only one of the ways in which NMR spectroscopy can be applied to a structure proof problem. We may also know that a certain proton has two equivalent protons nearby that are coupled by with a J value of 4 Hz. Another nearby proton coupled with a J value of 10 Hz, and three others nearby are coupled by 2 Hz. This gives a very rich pattern for the proton we are observing, but we can interpret it, with a little effort, by using a tree diagram. Selective spin decoupling may be used to collapse or sharpen portions of the spectrum in order to obtain more direct information about the nature of coupling patterns. However, each of these methods can become tedious and very difficult with complex spectra. What is need is a sample, unbiased, and convenient method for relating coupled nuclei.
COSY EXPERIMENT:-
The pulse sequence for a 1H COSY experiment contains a variable delay time t1 as well as an acquisition time t2.. The experiment is repeated with different values of t1, and the data collected during t2 are stored in the computer. The value of t1 is increased by regular, small interval for each experiment, so that the data that are collected consist of a series of FID patterns collecting during t2 each with a different value of t1.
To identify which protons couple to each other, the coupling interaction is allowed to take place during t1. During the same period, the individual nuclear magnetization vectors spread as a result of spin coupling interactions. These interactions modify the signal that is observed during t2. Unfortunately, the mechanism of the interaction of spin in a COSY experiment is too complex to be described completely in a simple manner.
A pictorial description must suffice.
Consider a system in which two protons are coupled to each other
An initial relaxation delay and a pulse prepare the spin system by rotating the bulk magnetization vectors of the nuclei by 90º. At this point, the system can be described mathematically as a sum of terms, each containing the spin of only one of the two protons. The spin then evolves during the variable delay period (called t1). In other words, they precess under the influences of both chemical shift and mutual spin-spin coupling. This precession modifies the signal that we finally observe during the acquisition time (t2). In addition, mutual coupling of the spins has the mathematical effect of converting some of the single-spin terms to products, which contain the magnetization components of both nuclei. The product terms are the ones we will find most useful in analysing the COSY spectrum.
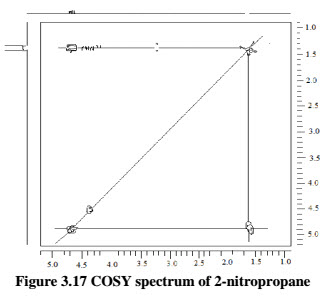
For example- In the COSY spectrum of 2-nitropropane molecules expect to observe coupling between the protons on the two methyl groups and the proton at the methane position.

In figure 1.14 of COSY spectrum of 2-nitropropane, first thing to note about the spectrum is that the proton NMR spectrum of the compound being studied is plotted along both the horizontal and vertical axes, and each axis is calibrated according to the chemical shift values (In parts per million).
Complex Proton spectra
A ‘non-invasive’ way to determine the no. of hydroxyl protons (and their multiplicity) in a molecule is to determine the spectrum in d6-DMSO, in as near neutral conditions as possible. This solvent usually contains traces of water which resonate near 3.4 ppm. The normal spectrum is recorded and stored in the spectrometer’s computer memory and a second spectrum is similarly stored, but this time obtained with simultaneous irradiation of the water signal. In the latter spectrum, the OH protons have been removed by transfer of saturation from the water signal. The readily displayed difference spectrum (A-B) therefore contains only the signals due to the water peak and to the various OH peaks (which, at ‘neutral pH’, are in slow exchange with each other and with the water peak). Note that the disadvantage of DMSO as a solvent is that it is subsequently not easily completely removed from the sample.