

About Authors:
Keyur B.ahir, Emanual M. Patelia*, Falgun A.Mehta
Department of Pharmaceutical Chemistry and Analysis,
Indukaka Ipcowala College of Pharmacy,
New Vallabh Vidyanagar – 388121, Gujarat, India.
*ricky.emanual@gmail.com
Abstract:
A simple, precise, rapid, selective, and economic reversed phase high-performance liquid chromatography (RP-HPLC) method has been established for simultaneous analysis of A Phenomenex C18 (250´4.6 mm i.d) chromatographic column equilibrated with mobile phase 0.02M Potassium dihydrogen o-phosphate/acetonitrile (55/45, v/v) adjusted to pH 6.5 with Triehtylamine (1% v/v) was used. Mobile phase flow rate was maintained at 1 ml/min and effluents were monitored at 278 nm. The sample was injected using a 20 ml fixed loop, and the total run time was 10 min. Experimental conditions such as pH of mobile phase, column saturation time, selection of wavelength, etc. were critically studied and the optimum conditions were selected. The retention time for PCM, DMP and TMD were 3.76 min, 5.18 min and 4.28 min, respectively. The calibration curve for DMP, PCM and TMD was found to be linear in the range of 0.2 - 1 mg/ml, 6.5 – 32.5 µg/ml and 0.75 – 3.75 mg /ml with a correlation coefficient of 0.9998, 0.9976 and 0.9974. The detection limits for PCM, DMP and TMD were 20 ng/ml, 1.06 ng/ml and 2 ng/ml, respectively, while quantitation limits were 60 ng/ml, 3.23 ng/ml and 6 ng/ml, respectively. This HPLC procedure is economic, sensitive, and less time consuming than other chromatographic procedures. It is a user-friendly and importance tool for analysis of combined tablet dosage forms.
Reference Id: PHARMATUTOR-ART-1552
1 Introduction
PCM (PCM; N-[4-hydroxyphenyl] ethanamide; Figure 1b) is a widely used analgesic and antipyretic for the relief of fever, headaches, and other minor aches and pains, and is a major ingredient in numerous cold and flu remedies. In combination with nonsteroidal anti-inflammatory drugs (NSAIDs) and opioid analgesics, paracetamol is used also in the management of severe pain (such as postoperative pain) [1]. Tramadol Hcl (TMD; (+/-) cis-2-[(Dimethylamino) methyl]-1-(3-methoxyphenyl) cyclohexanol hydrochloride Figure 1c) is a centrally acting analgesic, having agonist actions at the μ-opioid receptor and affects reuptake at the noradrenergic and serotonergic systems. TMD is a compound with mild and delayed μ-agonist activity [2]. Domperidone (DMP; 5-chloro-1-[1-[3-(2-oxo-2, 3-dihydro-1H-benzimidazol-1- yl) propyl]-piperidin-4-yl]-1, 3-dihydro-2H-benzimidazol-2-one; Figure 1a) used as antiemetic drug.
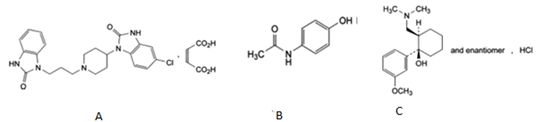
Figure 1 Structure of domperidone (a)paracetamol (b) and (c) tramadol HCl
PCM is official in Indian Pharmacopoeia. This pharmacopoeia suggests titrimetric and UV spectrophotometric assay method for PCM in bulk and tablet formulations. DMP is official in Indian Pharmacopoeia where assay is described by titrimetric method. Tramadol is official in Indian Pharmacopoeia. This pharmacopoeia suggests titrimetric (potentiometric) assay method for tramadol in bulk. Literature survey revealed that various analytical methods like spectrophotometric [3-6], HPLC [7-14], GC [15] and HPTLC [16-19] have been reported for the determination of TMD, PCM and either individually or combination with some other drugs, but no HPTLC method was reported for simultaneous estimation of TMD and PCM and domperidol in combined dosage forms. Many methods [20], [21], [22], [23], [24], [25], [26], [27] have been described in the literature for the determination of domperidol and pracetamol, individually. The analytical methods like HPLC [28] and HPTLC [29] for determination of domperidol and PCM in combined dosage form has been reported. The RP HPLC [30] method has been reported for estimation of TMD, PCM and Domperidol in tablet formulation. The review of literature prompted us to develop an accurate, selective and precise simultaneous method for the estimation of TMD, PCM and DMP in combined dosage forms.
[adsense:468x15:2204050025]
2 Experimental
2.1 Chemicals and Materials
TMD, PCM and DMP were procured from Cadila pharmaceuticals, Ahmedabad. Ethyl Acetate, Toluene, Ammonia and n-Butanol were used as solvents to prepare the mobile phase. All the reagents used were of Analytical reagent grade (CHEMDYES CORPORATION, Ahmedabad, india) and used without further purification. Tablet formulation A (Tramazac - PD, Zydus Cadila Healthcare Ltd., Ahmedabad, India) and Tablet formulation B (RAMCET-D sundyota numandis pharma. Ahmedabad., India) containing labeled amount of 325 mg PCM, 37.5 mg TMD, and 10 mg DMP were procured from local market.
2.2 Chromatographic Conditions
A Phenomenex C18 (250´4.6 mm i.d) chromatographic column equilibrated with mobile phase 0.02M Potassium dihydrogen o-phosphate/acetonitrile (55/45, v/v) adjusted to pH 6.5 with Triehtylamine (1% v/v) was used. Mobile phase flow rate was maintained at 1 ml/min and effluents were monitored at 278 nm. The sample was injected using a 20 mL fixed loop, and the total run time was 10 min.
2.3 Sample Preparation
To determine the content of PCM, DMP and TMD in combined dose tablet formulation twenty tablets of each brand were weighed. Average weight was calculated, the tablets are crushed and powder equivalent to about 325 mg PCM, 10 mg DMP and 37.5 TMD was transferred to 100.0 ml volumetric flask, 20.0 ml of methanol was added and content of the flask were ultrasonicated for 30 minutes, volume was made up to the mark with methanol. The solution was mixed and filtered through Whatman filter paper No. 41. From the filtrate, 1.0 ml was diluted to 100 ml with methanol. Appropriate volume of the aliquot was transferred to a 10 ml volumetric flask and the volume was made up to the mark with the mobile phase to obtain a solution containing DMP (0.6 µg/ml), PCM (19.5µg/ml) and TMD (2.25 µg/ml) were applied to HPLC and analyzed for PCM, DMP and TMD content using the proposed method as described earlier. The possibility of interference from other components of the tablet formulation in the analysis was studied. From the developed chromatogram Rt values were determined.
Preparation of standard solution
PCM (325 mg), DMP (10 mg) and TMD (37.5 mg) were accurately weighed and transferred to 100 ml volumetric flask and dissolved in few ml of methanol and sonicate it for 15 minutes. Volumes were made up to the mark with methanol to yield a solution containing 100 mg/ml of DMP, 3250 mg/ml 375 mg/ml.
2.4 Method Validation
The developed method was validated for linearity and range, specificity, accuracy, precision, Limit of detection, Limit of quantitation, robustness and solution stability as per ICH guidelines.
2.4.1 Linearity and Range
Linearity of the method was evaluated by constructing calibration curves at five concentration levels over a range of 0.2 – 1 µg/ml of DMP, 6.5 – 32.5 µg/ml of PCM and 0.75 – 3.75 µg/mlof TMDrespectively. The calibration curves were developed by plotting peak area versus concentration (n = 6).
2.4.2 Specificity
The specificity of the method was ascertained by analyzing PCM, DMP and TMD in presence of excipients like talc, polyethylene glycol, lactose and micro-crystalline cellulose were used for tablet formulations. The bands of PCM, DMP and TMD were confirmed by comparing Rt values and respective spectra of sample with those of standards. The peak purity of PCM, DMP and TMD was assured by comparing the chromatogram.
2.4.3 Accuracy (% Recovery)
The accuracy of the method was determined by calculating recoveries of PCM, DMP and TMD by method of standard additions. Known amount of DMP (80%, 100%, 120%), PCM(80%, 100%, 120%) and TMD (80% , 100% , 120%) were added to a pre quantified sample solution, and the amount of PCM, DMP and TMD were estimated by measuring the peak areas and by fitting these values to the straight-line equation of calibration curve.
2.4.4 Method Precision (Repeatability)
The instrumental precision studies were carried out by estimating response of 3 different concentrations of DMP (0.2, 0.6, 1 µg/ml) PCM (6.5, 19.5, 32.5µg/ml) and TMD (0.75, 2.25, 3.75 µg/ml) six times and results are reported in terms of relative standard deviation.
2.4.5 Intermediate Precision (Reproducibility)
The intra-day and inter-day precision studies were carried out by estimating the corresponding responses 3 times on the same day and on 3 different days for three different concentrations of DMP (0.2, 0.6, 1 µg/ml), PCM (6.5, 19.5, 32.5µg/ml) and TMD (0.75, 2.25, 3.75 µg/ml), and the results are reported in terms of relative standard deviation.
2.4.6 Limits of Detection (LOD) and Limits of quantitation (LOQ)
The limit of detection (LOD) is defined as the lowest concentration of an analyte that can reliably be differentiated from background levels. Limit of quantification (LOQ) of an individual analytical procedure is the lowest amount of analyte that can be quantitatively determined with suitable precision and accuracy. LOD and LOQ were calculated using following equation as per ICH guidelines.LOD = 3.3 ×σ /S; LOQ = 10 ×σ /S; Where sis the standard deviation of y-intercepts of regression lines and S is the slope of the calibration curve.
2.4.7 Robustness
Robustness of the method was studied by changing the flow rate of the mobile phase from 1 ml/min to 0.9 ml/min and 1.1 ml/min. Using 1.1 ml/minflow rate, retention time for PCM, DMP and TMD were observed to be 2.96 min, 4.18 min and 3.68 min respectively and with 0.9 flow rate, retention time for PCM, DMP and TMD were found to be 3.83, 6.12 and 5.46 min respectively without affecting resolution of the drug. When a mobile phase composition was changed to 0.02 M KH2PO4/acetonitrile (65/35 v/v; pH 6.5) by increasing percentage of buffer the retention time for PCM, DMP and TMD were observed to be 4.84 min, 6.18 min and 5.28 min respectively. When a mobile phase composition was changed to 0.02 M KH2PO4/acetonitrile (35/65 v/v; pH 6.5) by increasing percentage of acetonitrile the retention time for PCM, DMP and TMD were observed to be 2.86 min, 4.38 min and 3.18 min respectively The assay result of both the drug was found to be more than 98%.
2.4.8 Solution Stability
The solutions at analytical concentration DMP ( 1 µg/ml), PCM ( 32.5µg/ml) and TMD (3.75 µg/ml)were prepared and stored at room temperature for 24 h and analyzed at interval of 0, 6, 12 and 24 h for the presence of any band other than that of PCM, DMP and TMD and the results were simultaneously compared with the freshly prepared PCM, DMP and TMD standard solution of the same concentration in the form of change in %RSD of the response obtained.
2.5 Application of Validated Method to Pharmaceutical Formulation
To determine the content of PCM, DMP and TMD in combined dose tablet formulation twenty tablets of each brand were weighed. Average weight was calculated, the tablets are crushed and powder equivalent to about 325 mg PCM, 10 mg DMP and 37.5 TMD was transferred to 100.0 ml volumetric flask, 20.0 ml of methanol was added and content of the flask were ultrasonicated for 30 minutes, volume was made up to the mark with methanol. The solution was mixed and filtered through Whatman filter paper No. 41. Appropriate volume of the aliquot was transferred to a 10 ml volumetric flask and the volume was made up to the mark with the mobile phase to obtain a solution containing 0.6 µg/ml of DMP, 19.5 µg/ml of PCM and 2.25 µg/ml of TMD given in Table 5.13, Figure 5.6. The solution was sonicated for 10 min. It was injected as per the above chromatographic conditions and peak areas were recorded. Thus the validated method was used for analysis of PCM, TMD and DMP in their combined tablets dosage form (Brand A and B).
3 Results and Discussion
3.1 Method Development and Optimization of Chromatographic Conditions.
The mobile phase 0.02 M KH2PO4/acetonitrile (55/45 v/v) total pH adjusted to 6.5 using triethylamine was found to be satisfactory and gave three symmetric and well-resolved peaks for PCM, DMP and TMD. The retention time for PCM, DMP and TMD were 3.76 min, 5.18 min and 4.28 min, respectively. The resolution between PCM, DMP and TMD was found to be 2.4, which indicates good separation of three of the compounds17. The asymmetric factors for PCM, DMP and TMD were 1.32, 1.29 and 1.14, respectively. The mobile phase flow rate was maintained at 1 ml/min. Overlaine UV spectra of both the drugs showed that PCM, DMP and TMD absorbed appreciably at 278 nm, so detection was carried out at 278 nm
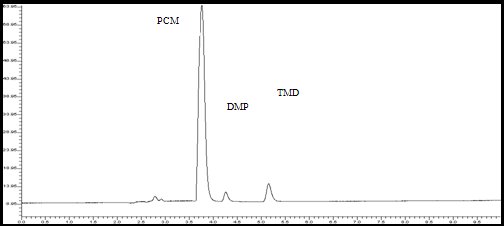
Figure 2 : Chromatogram of standard solution of PCM (0.6 µg/ml), DMP (19.6 µg/ml) and TMD (2.25 µg/ml) using phosphate Buffer /Acetonitrile (55/45 v/v) (pH 6.5).
3.2 Validation of the Method
3.2.1 Linearity
Linearity of the method was evaluated by constructing calibration curves at five concentration levels over a range of 0.2 – 1 µg/ml of DMP, 6.5 – 32.5 µg/ml of PCM and 0.75 – 3.75 µg/mlof TMDrespectively. The calibration curves were developed by plotting peak area versus concentration (n = 6).
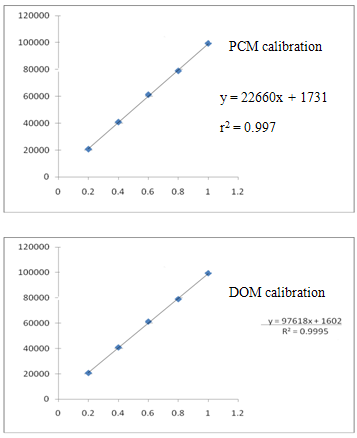
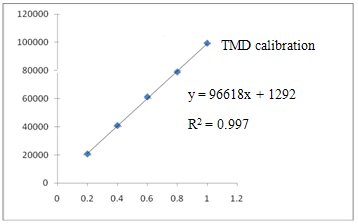
Figure 3:-Calibration plot of PCM, DMP and TMD by the developed HPLC method.
3.2.2 Specificity
The specificity of the method was ascertained by analyzing PCM, DMP and TMD in presence of excipients like talc, polyethylene glycol, lactose and micro-crystalline cellulose were used for tablet formulations. The bands of PCM, DMP and TMD were confirmed by comparing Rt values and respective spectra of sample with those of standards. The peak purity of PCM, DMP and TMD was assured by comparing the chromatogram.
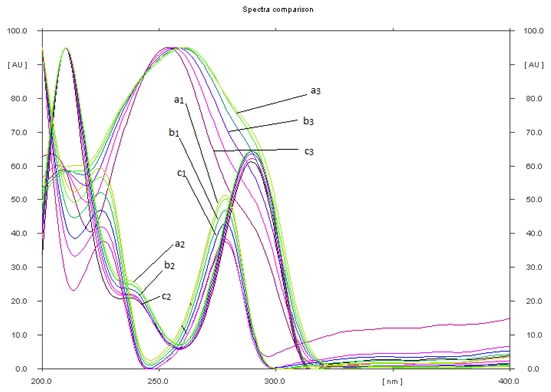
Figure 4 UV-Spectral comparison of TMD, DMP and PCM. (a1, a2 and a3), bulk of TMD, DMP and PCM, (b1, b2 and b3) tablet formulation A and TMD, DMP and PCM, (c1 ,c2 and c3) tablet formulation B respectively.
Table 1
Peak purity correlation results of PCM, DMP and TMD in two formulations at peak start, middle and end using PDA detector (WATERS HPLC, MODEL NO. 1752)
|
Sample |
Correlation of center and slope spectra |
|
|
r (s, m) |
r (m, e) |
|
|
PCM |
0.991 |
0.998 |
|
PCM tablet formulation A |
0.997 |
0.997 |
|
PCM tablet formulation B |
0.995 |
0.996 |
|
DMP |
0.998 |
0.995 |
|
DMP tablet formulation A |
0.996 |
0.996 |
|
DMP tablet formulation B |
0.996 |
0.995 |
|
TMD |
0.995 |
0.998 |
|
TMD tablet formulation A |
0.996 |
0.997 |
|
TMD tablet formulation B |
0.998 |
0.996 |
3.2.3 Accuracy
The accuracy of the method was determined by calculating recoveries of PCM, DMP and TMD by method of standard additions. Known amount of DMP (80%, 100%, 120%), PCM(80%, 100%, 120%) and TMD (80% , 100% , 120%) were added to a pre quantified sample solution, and the amount of PCM, DMP and TMD were estimated by measuring the peak areas and by fitting these values to the straight-line equation of calibration curve. (Table 2).
Table 2 Results from accuracy study.
|
||||||||||||||||||||||||||||||||||||||||||||||||||||||||||||||||||||||||||||||||||||||||||||||||||||||||||||||||||||||||||||||||||||||
3.2.4 Precision
The intra-day and inter-day precision studies were carried out by estimating the corresponding responses 3 times on the same day and on 3 different days for three different concentrations of DMP (0.2, 0.6, 1 µg/ml), PCM (6.5, 19.5, 32.5µg/ml) and TMD (0.75, 2.25, 3.75 µg/ml), and the results are reported in terms of relative standard deviation. The instrumental precision studies were carried out by estimating response of 3 different concentrations of DMP (0.2, 0.6, 1 µg/ml) PCM (6.5, 19.5, 32.5µg/ml) and TMD (0.75, 2.25, 3.75 µg/ml) six times and results are reported in terms of relative standard deviation.(Table 3).
3.2.5 Limits of detection (LOD) and Limits of Quantification (LOQ)
The limit of detection (LOD) is defined as the lowest concentration of an analyte that can reliably be differentiated from background levels. Limit of quantification (LOQ) of an individual analytical procedure is the lowest amount of analyte that can be quantitatively determined with suitable precision and accuracy. LOD and LOQ were calculated using following equation as per ICH guidelines. Table 3.
|
|||||||||||||||||||||||||||||||||||||||||||||||||||||||||
Table 3 Summary of validation parameters of developed HPLC method.
NOW YOU CAN ALSO PUBLISH YOUR ARTICLE ONLINE.
SUBMIT YOUR ARTICLE/PROJECT AT articles@pharmatutor.org
Subscribe to Pharmatutor Alerts by Email
FIND OUT MORE ARTICLES AT OUR DATABASE
a = Limit of detection
3.2.6 Robustness
Acceptable %RSD values obtained after making small deliberate changes in the developed
HPTLC method indicate that the method is robust for the intended purpose (Table 4).
Table 4:- Results from the robustness study of method


.png)