

{ DOWNLOAD AS PDF }
ABOUT AUTHORS:
Rohit A. Patil, Rajendra C. Doijad, Pravin D.Lade, Pournima S. Sankpal
Department of Pharmaceutical Chemistry,
Shree Santkrupa College of Pharmacy,
Ghogaon, Karad (M.S.) India
rohitpharma3250@gmail.com
ABSTRACT:
Simple, sensitive and specific spectrophotometric method were developed and validated for quantification of CAPECITABINE (CAP) by difference spectroscopy. CAP exhibits a substantial difference in absorbance in the two solvents that is in 0.01 N HCL and 0.01 N NAOH at 295 nm. Beer’s law was obeyed in the concentration range of 1 to 20 µg ml-1for CAP. Results of tablet analysis showed standard deviation in the range of 98.42 to 101.95 % for CAP which indicate repeatability of the method. The results indicated excellent recoveries ranging from 98.45 to 101.70 % for CAP with a mean of 99.12 %. Recoveries obtained do not differ significantly from 100% showed that there was no interference from the common excipients used in the tablet formulation indicating accuracy and reliability of the method.
INTRODUCTION:
Combinations of two or more drugs in the pharmaceutical dosage forms are very much useful in multiple therapies. Market survey revealed that, day by day new drugs and their combination with another drugs are being introduced in market as they have more patient compliance than a single drug. The analytical chemistry hence has challenge in developing the methods for their analysis with the help of number of analytical techniques which are available for the estimation of the drugs and their combination from dosage forms.
Capecitabine (CAP) [N4-pentoxycarbonyl- 5-deoxy-5-fluorocytidine] is an anticancer prodrug of 5-fluorouracil (5-FU) that was designed to undergo preferential conversion to 5-FU within tumors (1-3). 5-FU has also been widely used as an anticancer agent in the chemotherapy of solid tumors but its efficacy is limited by dihydropyrimidine dehydrogenase catalyzed formation of dihydro-5-fluorouracil. Since it lacks selectivity toward tumor cells, 5-FU also exhibits significant toxicity. Prodrug of 5-FU have been developed to improve efficacy and to reduce side effect and toxicity (4-5). For example, Tegafur [5-fluoro-1-[(RS)-tetrahydrofuran-2-yl]-pyrimidine-2, 4-(1H, 3H)-Dione] maintains an effective 5-FU concentration over a longer period while Doxifluridine [5_deoxy-5-fluorouridine] achieves some selectivity toward tumors (6-7). However, both prodrugs still show adverse effects, such as diarrhoea after oral and intravenous administration. CAP was developed to reduce such adverse effects while improving the selectivity toward tumours. (8) Literature survey revealed several methods based on techniques viz. HPLC- UV, HPLC- MS, LC- MS, LC- MS –MS, GCMS and MS- MS for its determination in human plasma and pharmaceutical dosage forms. (9-16) however there is no method reported for the detection of CAP in bulk and pharmaceutical formulation by UV spectrophotometry. The aim of present work is to find out a simple, sensitive, specific, spectrophotometric method developed for the detection of CAP in bulk drug and pharmaceutical formulation.
Hence, on the basis of literature survey it was thought to develop a precise, accurate, simple, reliable and less time consuming difference UV-Spectrophotometric method for estimation of Capecitabine in capsule/tablet formulations.
EXPERIMENTAL:
Apparatus:
The instrument used for the present study was ShimadzuUV-Visible double beam Spectrophotometer with 1 cm matched pair quartz cell and spectral bandwidth of 2 nm.
Reagents and materials:
CAP was obtained as a gift sample from Naprod Life Sciences, Boisar India. HCL and NaOH were purchased from Loba fine India. Double distilled water was used throughout the experiment in a tablet dosage form containing CAP were purchased from local commercial sources.
Standard solution-
selection of common solvent:
0.01 N HCL and 0.01 N NAOH was selected as a common solvent for developing spectral characteristics of drug. The selection was made after using different acids and bases and their different normalities.
preparation of standard drug solution:
Standard stock solution containing capecitabine (CAP)was prepared by dissolving 10 mg of CAP separately in 50 ml of 0.01 N HCL and 0.01 N NaOH sonicated for 5 min. and then final volume of both the solutions was made up to 100 ml with same solvents to get stock solution containing 100 µg ml -1 of CAP in 0.01 N HCL and 0.01 N NaOH in two different 100 ml volumetric flasks.
determining of sampling wavelength for simultaneous analysis:
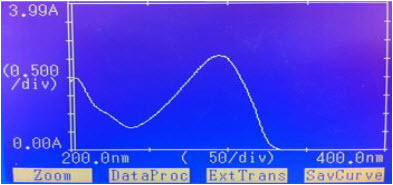
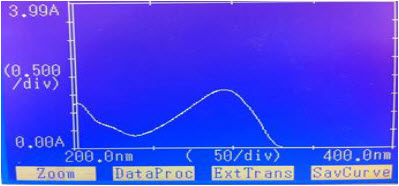
By appropriate dilution of two standard drug solutions with 0.01 N HCL and 0.01 N NaOH solutions containing 10 µg ml-1 of CAP were scanned separately in the range of 200-400 nm to determine the wavelength of maximum absorption for the drug. The difference spectrophotometric method developed for analysis of Capecitabine and one wavelength was selected for estimation of CAP from the overlain spectra as shown as”Fig.1”and “Fig.2” The wavelength selected for the estimation of drug was 295 nm.
“Figure No.1”: Spectra of CAP in 0.01 N HCL
“Figure No.2”: Spectra of CAP in 0.01 N NAOH
Selection of method and wavelengths:
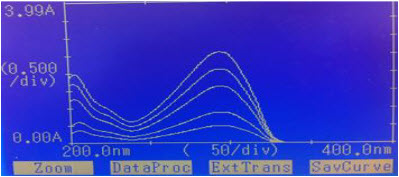
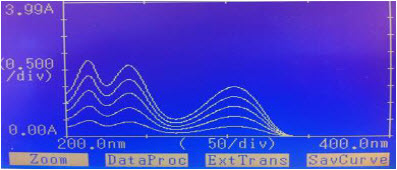
Difference spectrophotometric method is used for determination of CAP. The wavelength was selected for estimation of CAP from the overlain spectra as shown in “figure No.3”and “figure no. 4”
“Figure No.3”: Overlain Spectra of CAP in different concentration 0.01N HCL
“Figure No.4”: Overlain Spectra of CAP in different concentration 0.01N NaOH
CAP was estimated by recording the absorbance difference in 0.01 N HCL and 0.01 N NaOH at 295 nm and results are shown in Table No.1.
TableNo.1: Absorbance Values for Calibration Curve of CAP at 295nm
|
S. No. |
Concentration (µg/ml) |
Absorbance |
|
1. |
5 |
0.205 |
|
2. |
10 |
0.390 |
|
3. |
15 |
0.570 |
|
4. |
20 |
0.753 |
|
5. |
25 |
0.905 |
Procedure for plotting calibration curve:
From standard stock solution of drug five working standard solutions prepared and scanned in the wavelength range of 200-400 nm. The appropriate aliquots of drug were pipetting out from standard stock solution of the drug in 0.01 N HCL and 0.01 N NaOH into series of 10 ml volumetric flask. The volume was made up to get solution of concentration 5,10,15,20 and 25 of CAP in both 0.01 N HCL and 0.01 N NaOH separately. Calibration curve was constructed at wavelengths 295 nm by recording absorbance difference between two solvents against concentration of drug. CAP obeyed Beer’s law in the concentration range of 1to20µg ml-1.By using quantitative modes of instrument slope, intercept and correlation coefficient values for calibration curve was obtained.
“Figure No.5”: calibration curve for Capecitabine
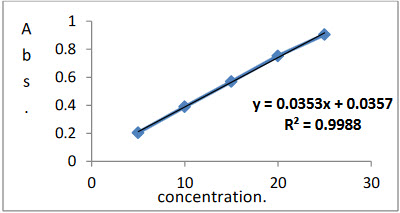
Factor: A = 0.0357
B = 0.0353 Coefficients: = 0.998
The concentration of CAP was calculated by using formula Abs = A + B * C, where A = 0.0357, B = 0.0353, C = concentration of CAP and correlation coefficient for CAP was 0.998and results of analysis of laboratory sample shown in Table No. 2.
Table No.2: Results of Analysis of Laboratory Samples:
|
Analyte |
% Concentration estimated* (Mean ± S. D.) |
R.S.D. |
|
CAP |
99.77± 1.437 |
1.44 |
*Average of nine determinations;S.D.: standard deviation.R.S.D.: relative standarddeviation.
analysis of tablet formulation:
Marketed tablet formulations containing500 mg of CAPwas analyzed by this method. From the triturate of 20 tablets, an amount equivalent to 10 mg of CAP was weighed and transferred to 100 ml volumetric flask. The contents of the flask were dissolved in the 50 ml of the 0.01 N HCL and 0.01 N NaOH separately with the aid of ultra-sonication for 10 min. The solution was filtered through Whatmann filter paper no. 41 and then final volume of the solution was made up to 100 ml with same solvents to get a stock solution containing 100 µg ml -1 of CAP in 0.01 N HCL and 0.01 N NaOH. The concentration of each analyte was determined with the equations obtained from calibration curve. The results of tablet analysis after replicate determinations (n = 5) is shown in Table No.3.
Table No.3: Results of Tablet Analysis:
|
Analyte |
Label claim (mg) |
%Label claim estimated* (Mean ± S. D.) |
R.S.D. |
|
CAP |
500 |
99.73± 1.451 |
1.45 |
* Average of nine determinations; S.D.: standard deviation. R.S.D.: relative standard deviation.
Recovery studies:
Accuracy and sensitivity of analysis was determined by performing recovery studies by spiking different concentrations of pure drug in the preanalyzed tablet sample. Results of recovery studies indicated that the method is rapid, accurate and reproducible. The recovery obtained after replicate determinations (n=5) is shown in Table No.4
Table No.4: Results of Recovery Study:
|
Analyte |
Label claim (mg) |
%Label claim estimated* (Mean ± S. D.) |
R.S.D. |
|
CAP |
500 |
99.22 ± 1.0792 |
1.09 |
* Average of nine determinations; S.D.: standard deviation
Method validation:
The proposed method was validated according to ICHQ1A (R2)guidelines for validation of analytical procedures in order to determine accuracy, precision, repeatability, robustness, linearity, range, sensitivity, limit of detection and quantitation17.and results are shown in Table No. 5 to 10.
Table No.5: Results of Repeatability:
|
Analyte |
Label claim (mg) |
Tablet Analysis %Label claim estimated* (Mean ± S.D.) |
R.S.D. |
|
CAP |
500 |
100.56 ± 0.6482 |
0.6521 |
* Average of nine determinations; S.D.: standard deviation. R.S.D.: relative standard deviation.
Table No.6: Results of Intraday Precision:
|
|
% Label claim estimated* (Mean ± S.D.) |
R.S.D. |
|
CAP |
CAP |
|
|
T-1 |
100.12±1.2864 |
1.2938 |
|
T-2 |
100.31±1.3159 |
1.3686 |
|
T-3 |
100.56±1.2372 |
1.2561 |
*Average of nine determinations; S.D: standard deviation. R.S.D.: relative standard deviation.
Table No.7: Results of Interday Precision:
|
Day |
% Label claim estimated* (Mean ± S.D.) |
R.S.D. |
|
CAP |
CAP |
|
|
Day -1 |
100.36±1.2435 |
1.2542 |
|
Day -2 |
100.50±1.2918 |
1.2958 |
|
Day -3 |
100.18±0.9628 |
0.9565 |
* Average of nine determinations; R.S.D., Relative Standard Deviation.
Table No.8 Limit of Detection and Limit of Quantitation:
|
Name of Drug |
LOD μg/ml |
LOQμg/ml |
|
CAP |
0.037 |
0.072 |
* Average of six determinations; R.S.D., relative Standard Deviation.
Table No.9: Results of robustness (using methanol solution):
|
Analyte |
Label claim(mg) |
Tablet Analysis% Label claim estimated*(Mean ± S.D.) |
R.S.D. |
|
CAP |
150 |
99.341.1490 |
1.29 |
* Average of nine determinations; R.S.D., relative Standard Deviation.
Table No.10: Optical characteristics:
|
Parameters |
Values for CAP |
|
Beer’s law limit (μg/ml) |
1-20 |
|
Correlation coefficient |
0.998 |
|
Regression equation(y*) |
|
|
Slope (B) |
0.0353 |
|
Intercept (A) |
0.0357 |
Y= A + B*C, where C is the concentration in µg/ml and Y is absorbance unit
RESULT AND DISCUSSION:
The proposed method for simultaneous estimation of CAP utilizes the spectrum mode of analysis of Shimadzu UV1601 spectrophotometer. CAP exhibits a substantial difference in absorbance in the two solvents that is in 0.01 N HCL and 0.01 N NAOH at 295 nm so determination of CAP by difference spectroscopic method was thus attempted. Beer’s law was obeyedin the concentration range of 1 -20 µg ml -1for CAP. Interlay and intradaystudies showed high degree of repeatability of an analytical method under normal operating conditions. Results of tablet analysis showed standard deviation in the range of 98.42 to 101.95 % for CAP which indicate repeatability of the method. The accuracy of the method was determined by investigating the recovery of the drugs using spiked concentrations of the standard drug.
The results indicated excellent recoveries ranging from 98.45 to 101.70 % for CAP with a mean of 99.12 %.
Recoveries obtained do not differ significantly from 100% showed that there was no interference from the common excipients used in the tablet formulation indicating accuracy and reliability of the method. Precision for tablet analysis was determined by analysis of tablets containing CAP. Lower limit of detection for CAP was found to be 0.037 µg ml -1 Limit of quantitation was found to be 0.072 µg ml -1
CONCLUSION:
The proposed method for different spectrophotometric estimation of CAP was found to be simple, accurate and reproducible for routine estimation of CAP in tablet formulation. The recoveries obtained 98.45 to 101.70 % for drug which do not differ significantly from 100 %. There were no interferences from common excipients used in the formulation indicating accuracy and reliability of the method. Recoveries obtained do not differ significantly from 100% showed that there was no interference from the common excipients used in the tablet formulation indicating accuracy and reliability of the method.
REFERENCES:
1. Jemal A et al; Cancer Statistics; Cancer J Clin.; 2009; 59(4); 225-249
2. Herman J.M.; Analysis of Fluorouracil-Based Adjuvant Chemotherapy and Radiation after pancreatic oduodenectomy for Ductal Adenocarcinoma of the pancreas; Journal of Clinical Oncology; 2008; 26(21); 3503-3510
3. VanCutsem E.; A phase IB dose-escalation study of Erlotinib, Capecitabine and Oxaliplatin in Metastatic Colorectal Cancer Patients; Ann Oncology; 2008; 19(2); 332-339
4. Neoptolemos J.P.; A Multicenter, International, Open-Label, Randomized, Controlled Phase III trial of adjuvant 5-fluorouracil/folinic acid (5-fu/fa) versus Gemcitabine (gem) in patients with Restricted Pancreatic Ductal Adenocarcinoma; Journal of Clinical Oncology; 2009; 27(18s); LBA4505
5. Yanagisawa K.F.; Antitumor activity of Erlotinib in combination with Capecitabine in Human Tumor Xenograft Models; Cancer ChemotherPharmacol.; 2006; 57(5); 693-702
6. Twelves C.; Erlotinib in combination with Capecitabine and Docetaxel in patients with Metastatic Breast Cancer: a dose- escalation study; European Journal of Cancer; 2008; 44(3); 419-426
7. Besnard T; Optimized blood sampling with cytidine deaminase inhibitor for improve analysis of Capecitabin Metabolites; Journal of Chromatography B Analyst Technology Biomed Life Sciences; 2008; 870(1); 117-120
8. Eloubeidi. M.A.; Phase I study of Capecitabine with concomitant radiotherapy for patients with locally advanced Pancreatic Cancer: expression analysis of genes related to outcome; Journal of Clinical Oncology; 2005; 23(34); 8679-8687.
9. Zufia L.; Simple Determination of Capecitabine and its metabolites by Liquid Chromatography with Ultraviolet Detection in a single injection; Journal of chromatography B; 2004; 809(1); 51- 58
10. Sylvie M.; Simultaneous Determination of Capecitabine and its metabolites by HPLC and Mass Spectrometry for Preclinical and Clinical studies; Journal of chromatography B; 2005; 826(1-2); 232-237
11. Wang S; Development of a sensitive and selective LC/MS/MS method for the determination of α-fluoro-β-alanine-5-fluoro uracil and Capecitabine in human plasma; Journal of chromatography B; 2005; 265; 32-37
12. Xu Yan; Liquid Chromatography-Mass Spectrometry method for the analysis of the anti-cancer agent Capecitabine and its nucleoside metabolites in human plasma; Journal of chromatography B; 2003; 783(1), 273- 285
13. Desmoulin F.; Isolaton of an unknown metabolite of Capecitabine, an oral 5-fluorouracil prodrug, and its identification by Nuclear Magnetic Resonance and Liquid Chromatography-Tandem Mass Spectrometry as a glucuroconjugate of 5’- deoxy-5-fluorocytidine, namely 2’-(β-Dglucuronic acid)-5’-deoxy-5-fluorocytidine; Journal of chromatography B; 2003; 792(2); 323-332
14. Gutens G.; Hyphenated Techniques in Anticancer Drug Monitoring II. Liquid Chromatography-Mass Spectrometry and Capillary Electrophoresis; Journal of chromatography A; 2002; 976(1-2); 239-247
15. Patil P.S., More H.N.; Difference spectroscopic estimation of Enalapril maleate from tablet dosage form; International journal of Research in Pharmaceutical and Biomedical Sciences; 2011; 2(2); 629-633
16. Sankpal Poournima., Doijad Rajendra, Suryawanshi Gayatri, Patil Priyanka, Pathan Aasma; Simple Quantitative Method Development and Validation of Capecitabine in Pure Form and Pharmaceutical Dosage Forms by UV-Spectroscopy; 2012 (1).
17. ICH guideline Q2 (R1); Validation of Analytical Procedures: Text and Methodology; 2005
REFERENCE ID: PHARMATUTOR-ART-2394
|
PharmaTutor (Print-ISSN: 2394 - 6679; e-ISSN: 2347 - 7881) Volume 4, Issue 3 Received On: 16/09/2015; Accepted On: 29/09/2015; Published On: 01/03/2016How to cite this article: Patil RA, Doijad RC, Lade PD, Sankpal PS; Difference spectrophotometric estimation of Capecitabine from tablet dosage form; PharmaTutor; 2016; 4(3); 17-21 |
NOW YOU CAN ALSO PUBLISH YOUR ARTICLE ONLINE.
SUBMIT YOUR ARTICLE/PROJECT AT editor-in-chief@pharmatutor.org
Subscribe to Pharmatutor Alerts by Email
FIND OUT MORE ARTICLES AT OUR DATABASE


.png)