

About Author: V. Ranjith Kumar*, Chintalapti Sujitha
* Department of Pharmaceutical Analysis,
Priyadarshini college of Pharmaceutical Sciences,
Chowdaryguda, Narapalli, Ghatkesar (Mo),
RR-District-501301. AP-INDIA.
Reference ID: PHARMATUTOR-ART-1062
Abstract
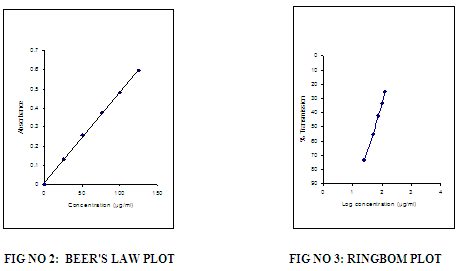
A simple, accurate, cost effective and reproducible spectrophotometric method has been developed for the estimation of Sitagliptine in bulk and pharmaceutical dosage form. Visible spectrophotometric method, which is based on measurement of absorption at maximum wavelength 540 nm. The accuracy of the methods was assessed by recovery studies and was found to be ranging from 99.5-101.5 .The developed method was validated with respect to linearity, accuracy (recovery), precision and specificity. Beers law was obeyed in the concentration range of 25-125 µg/ml having line equation y = 0.026x + 0.016 with correlation coefficient of 0.999. Results of the analysis were validated statistically and by recovery study.
Introduction
Like vildagliptin, sitagliptine is an inhibitor of the enzyme dipeptidylpeptidase - 4, an enzyme responsible, among other roles, for the degradation of the incretin hormone glucagon-like peptide-1 (GLP-1 insulinotropin), which plays a role in regulating insulin secretion. It is used in the treatment of type 2 diabetes mellitus, as monotherapy or as dual therapy with metformin, a sulfonylurea, or a thiazolidinedione. Triple therapy using sitagliptin with metformin and a sulfonylurea may be given if dual therapy is inadequate. Sitagliptin is given as the phosphate, but doses are in terms of the base 128.5 mg of sitagliptine phosphate is equivalent to about 100 mg of sitagliptine. The usual oral dose is the equivalent of 100 mg of sitagliptine once daily, as monotherapy or in combination. When given with metformin in a combination preparation, sitagliptine may be given in 2 divided doses. The dose of sulfonylurea may need to be lowered when used with sitagliptine. Sitagliptine may be taken with or without food. Dosage should be adjusted in patients with renal impairment.
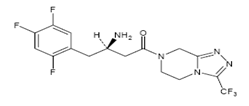
Chemical structure of Sitagliptine
Adverse effects reported with sitagliptin include upper respiratory-tract infections, headache, and nasopharyngitis. Hypersensitivity reactions including anaphylaxis, angioedema, urticaria, rash, and Stevens-Johnson syndrome have also been reported.
EXPERIMENTAL DETAILS
Instruments used
A Systronics Double beam UV visible spectrophotometer 2201 with 1 cm matched quartz cells was used for all spectral and absorbance measurements. A systronics digital pH meter was used for all pH measurements.
SPECTROPHOTOMETRIC METHOD DEVELOPED FOR THE ASSAY OF SITAGLIPTINE (STG) IN BULK FORMS
Preparation of standard drug solution
About 100mg Sitagliptine was dissolved in small quantity of water in a separating funnel containing 10ml of 10% sodium carbonate add 10ml of chloroform to the above solution allow separating and collecting the chloroform layer and evaporate it to dryness and then make up to 100ml with acetone.
Preparation of Reagents
All the chemicals and reagents used were of analytical grade and solutions were prepared in double distilled water. The procedures for preparation of the various reagents were mentioned below Table No.1
Table No.1- REAGENT PREPARATION
|
S.No |
Reagent |
Preparation |
|
1 |
2,3dichloro5,6dicyano-p benzoquinone(DDQ) |
Dissolve 400mg of DDQ in a mixture of 20 ml of 1,4 dioxane and 40 ml of acetone and make up to 100 ml with acetone. |
|
2 |
Na2CO3
|
About 1 g of sodium carbonate was accurately weighed and dissolved in 10 ml of distilled water. |
Recommended procedures:
Based on the results obtained in different trials described under results and discussion in this chapter the following procedures were recommended for the determination of STG in bulk and pharmaceutical dosage formulations.
For bulk samples
Aliquots of working standard solution of Sitagliptine ranging from 0.25-1.25ml were transferred in to a series of 10ml volumetric flasks. To these 1ml of DDQ reagent was added. The total volume was adjusted to 10ml with acetone. The absorbance of the yellow colored chromogen was measured at 440 nm against reagent blank and the amount of Sitagliptine present in the sample was computed from its calibration curve. The optical characteristics are summarized in Table no.2
Table No.2: ABSORPTION MAXIMA
|
Reagent/Solvent |
: |
2,3dichloro5,6dicyano-p benzoquinone(DDQ) |
|
Chemical principle involved |
: |
Molecular Salt Formation |
|
λ max |
: |
440nm |
|
Beer’s Law Limits |
: |
25-125µg/ml |
RESULTS AND DISCUSSION
Spectral Characteristics
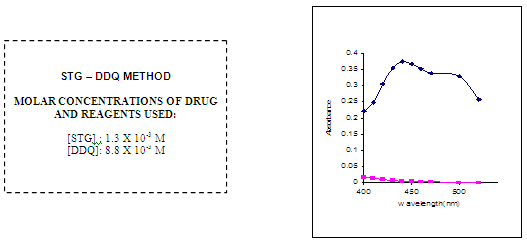
In order to ascertain the optimum wavelength of maximum absorption (λmax), the spectra were scanned in the wavelength region of 360-800 nm against a corresponding reagent blank.
The reagent blank absorption spectrum of each method was recorded against solvent employed in each proposed method. The absorption spectra’s, calibration curves and Ring-bom12 plots of the proposed methods are graphically represented in figures 1 to 3.
Optical characteristics
For each method the optical characteristics such as absorption maximum, Beer’s law limits, molar absorptive, sandell’s sensitivity and photometric range were presented in Table no.3. The absorption spectras of the systems are illustrated as figures 1 to 3.
Precision
The precision of each one among thirteen proposed visible spectrophotometric methods were ascertained separately from the absorbance values obtained by actual determination of six replicates of a fixed amount of STG in total solution. The % RSD and p range of errors (at 95% and 99 %) were calculated for the proposed methods and are presented in Table.No 3.
Accuracy
The accuracy of these methods were ascertained by comparing the results obtained with the proposed and reference methods in the case of Bulk formulations and are presented in Table no.4.
Recovery studies
Recovery studies were conducted by analyzing each pharmaceutical formulation by the proposed methods. Known amounts of pure drug was weighed and then added to each of the previously analyzed samples and the total amount of the drug was once again determined by all the proposed methods.
FIG NO 1:ABSORPTION SPECTRA
OPTICAL CHARACTERISTICS, REGRESSION DATA AND PRECISION OF THE PROPOSED METHODS FOR SITAGLIPTINE (STG)
Table No. 3.
|
PARAMETERS |
RESULTS |
|
λmax (nm) |
540 |
|
Beer’s law limit(µg/ml) |
25-125 |
|
Sandell’s sensitivity (µg/cm2/0.001 abs. unit) |
0.088 |
|
Molar absorptivity(litre.mole-1.cm-1) |
0.59×10⁴ |
|
Regression equation(Y*) |
y = 0.026x + 0.016
|
|
Slope(b) |
0.3816 |
|
Intercept(a) |
0.1908 |
|
Correlation Coefficient(r) |
0.9987 |
|
%Relative standard deviation** |
0.74 |
|
%Rangeof error** |
0.1 |
|
0.05 Significance level |
0.618 |
|
0.01 Significance level |
0.910 |
Y* = a + bx, where Y is absorbance and x is concentration of Sitagliptine in µg/ml.
** Average of six determinations
Table No. 4. Determination of Accuracy by percentage recovery method
|
Amount added (mg) |
Proposed Method |
% recovery by proposed methods**±S.D |
||
|
Amount found* (mg) ±S.D |
t (value) |
F (Value) |
||
|
50 |
49.74 ±0.012 |
0.676 |
1.441 |
99.51 ±0.69 |
|
100 |
100.04 ±0.016 |
0.341 |
1.611 |
100.1±0.75 |
**Average ± standard deviation of six determinations, the t and F- values refer to comparison of the proposed method with reference method.
Theoretical values at 95 % confidence limits t = 2.571 and F = 5.05.
**Average of five determinations
CONCLUSION:
The developed method was found to be simple, sensitive, accurate, precise, reproducible, and can be used for routine quality control analysis of Sitagliptine in bulk and pharmaceutical formulation.
REFERENCES:
1. Mortia M.R, Berton D., Boldin R., Journal of chromatography B, 2008; 862:132-139
2. Indian Pharmacopoeia, Vol. II, Government of India, New Delhi, 2007, 1290.
3. Sweetman, S.C., Martindale, the Extra pharmacopoeia, 34th ed. London:pharmaceutical Press,2004,435.3, and 1129. 2.
4. A.F.M. El Walily., Korany, M.A., Gindy, M.F., J.Pharmaceut.Biomed.Anal.17, 1998, 435.
5. Sevgi K., J.Pharmaceut.Biomed.Anal; 46 (2008) 295–302.


.png)