

 About Authors:
Rakesh Bhatia*
School of Pharmaceutical Sciences,
Department of Pharmaceutical Chemistry,
Jaipur National University,
Jaipur-302025 (Rajasthan), India
*rakesh.mpharm1304@yahoo.com
Abstract
Chemical synthesis data and their biological screening have provided a vast amount of experimental data. As a result of that, availability of large amount of biological data information through molecular biology has made drug discovery and development a more complex method. To combat these problems, Quantitative structure-activity relationships (QSAR) emerged as a very useful tool in drug design. QSAR has been applied extensively and successfully over several decades to find predictive models for activity of bioactive agents. QSAR have brought revolution in drug discovery process by thedevelopment of mathematicalrelationships linking chemical structures and pharmacological activity in quantitative manner of series of compounds. Description of the molecular structure, electronic orbital reactivity and the role of structural and steric components has been the subject of mathematical and statistical analysis. Computational drug design method in QSAR is a rapidly growing field which is now a very important component in the discipline of medicinal chemistry. Virtual filtering and screening of combinatorial libraries have recently gained attention as methods complimenting the high-throughput screening and combinatorial chemistry. These chemoinformatic techniques rely heavily on quantitative structure-activity relationships (QSAR) analysis, a field with established methodology and successful history.By characterize a specific aspect of a molecule that is numbers containing structural information derived from the structural representation used for molecules under study called “Molecular descriptors” to find appropriate representations of the molecular structure of drug compoundsto obtain the structure-activity relationships in which these theoretical and computational methods are based, the ability to predict physicochemical, pharmacokinetic and toxicological properties of these leads are becoming increasingly important in reducing the number of expensive methods and late development failures. Thus thereby, QSAR certainly decreases the number of compounds to be synthesized by easing the selection of the most promising candidates. This review seeks to provide a review on role of molecular descriptors in the drug design in QSAR.
Reference Id: PHARMATUTOR-ART-1330
Introduction
The main paradigm of medicinal chemistry is that biological activities, as well as physical, physicochemical and chemical properties, of organic compounds depend on their molecular structure [1, 2]. Based on this paradigm Crum-Brown and Fraser published the first quantitative structure activity relationship in 1868 [3]. Despite the great advances produced in theoretical drug design even today this paradigm is guiding the discovery of new lead compounds [4-6].QSAR (Quantitative Structure–Activity relationships) thus have been applied for decades in the development of relationships among physicochemical properties of chemical substances and their biological activities to obtain a reliable mathematical and statistical model for prediction of the activities of new chemical entities. QSAR have helped the scientists in the development of mathematicalrelationships linking chemical structures and pharmacological activity in quantitative manner of series of compound.The fundamental principal underlying the QSAR is that the differences in structural properties are responsible for the variations in biological activities of the compounds. In the classical QSAR studies, affinities of ligands to their binding sites, inhibition constants, rate constants, and other biological end points, with atomic, group or molecular properties such as lipophilicity, polarizability, electronic and steric properties (Hansch analysis) or with certain structural features (Free-Wilson analysis) have been correlated. QSAR certainly decreases the number of compounds to be synthesized by simplifying the selection of the most promising candidates. However, the most traditionally used method of drug discovery is the mass screening. It consists on massively screening of chemicals on a battery of biological assays. A recent advance in this field is the use of robotics to screen thousand to millions of compounds in an automated form. This technology is known today as high-throughput screening (HTS) [7-9]. With combinatorial chemistry, it allows for synthesis and rapid activity assessment of vast number of small-molecule compounds [10, 11]. With the increasing of experience by using these technologies, the focus has shifted from screening through large, diverse molecule collections to more rationally designed libraries [12].Virtual screening [13]of chemical libraries has emerged as a complementary approach to HTS [14, 15]. By this means, computational techniques are used to select a reduced number of potentially active compounds from large available chemical or combinatorial libraries called structural databases. The main objective of this approach is to discriminate potent candidate molecules from inactive or less potent molecules.The computer-aided drug discovery(CADD) approach offers an alternative to the realworld of synthesis and screening [16]. It “involves all computer-assisted techniques used to discover, design andoptimize compounds with desired structure and properties” [17]. This approach has advanced rapidly over the pastdecade [18], and has played a key role in the development of a number of drugs that are now on the market or are inclinical trials.It has reduced the cost of synthesis and bioassays which are made only after exploring the initial concepts with computational models.Molecular descriptorsare “terms that characterize a specific aspect of a molecule” [17].Molecular descriptors are numerical values that characterize properties of molecules. Molecular descriptors encoded structural features of molecules as numerical descriptors vary in complexity of encoded information and in compute time. This review article will focus on the different descriptors of QSAR approaches employed within the current drug discovery process to construct predictive structure-activity relationships.
1. QSAR METHOD
The QSAR method involves recognition that a molecule (organic, peptide, protein, etc.) is really a three-dimensional distribution of properties. The most important of these properties are steric (e.g. shape and volume), electronic (e.g. electric charge and electrostatic potential) and lipophilic properties (how polar or non-polar the sections of molecular are, usually exemplified by the log of the n-octanol-water partition coefficient, log P). Scientists are used to visualizing mainly steric properties of molecules. However, molecules look different when viewed in electrostatic or lipophilic space (Figure 1).
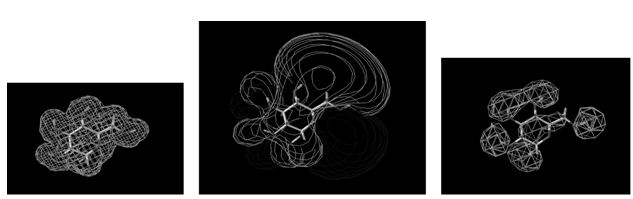
Figure 1: A smallorganic molecule (glucopyranose) viewed in steric (left), electrostatic (centre) and lipophilic (right) space.
The QSAR method (and analogously quantitative structure-toxicity relationships (QSTR) and Quantitative structure-property relationships (QSPR)) involves several key steps:
1. Converting molecular structures into mathematical descriptors that encapsulate the key properties of the molecules relevant to the activity or property being modeled.
2. Selecting the best descriptors from a larger set of accessible, relevant descriptors.
3. Mapping the molecular descriptors into the properties, preferably using a model-free mapping system in which no assumptions are needed as to the functional form of the structure–activity relationships. These relationships are often complex, unknown and non-linear.
4. Validating the model to determine how predictive it is, and how well it will generalize to new molecules not in the date set used to generate the model (the training set).
The relationship among molecular structure and some biological response, BR (e.g. IC50, LD50, and ED90) can be expressed as: [19]
Log (BR) = f (x1, x2,…., xN)
Where, f is usually an unknown complex, non-linear function, and x1, … , xN are molecular descriptors. Building of a QSAR model via the four steps outlined above involves finding the best form of function f.
NOW YOU CAN ALSO PUBLISH YOUR ARTICLE ONLINE.
SUBMIT YOUR ARTICLE/PROJECT AT articles@pharmatutor.org
Subscribe to PharmaTutor Alerts by Email
FIND OUT MORE ARTICLES AT OUR DATABASE
2. GENERAL SCHEME OF A QSAR STUDY
The chemoinformatic methods used in building QSAR models can be divided into three groups:
(i) Isolating descriptors from molecular structure.
(ii) Choosing those informative in the context of the analyzed activity and
(iii) Finally, using the values of the descriptors as independent variables to define a mapping that correlates them with the activity in question.
2.1. Generation of Molecular Descriptors from Structure
The small-molecule compounds are defined by their structure, encoded as a set of atoms and covalent bonds between them.
First, the biological activity should not be clearly stated, this information has to be obtained from the structure. Various rationally designed molecular descriptors make more noticeable different chemical properties clearly mentioned in the structure of the molecule. Only those properties may correlate more directly with the activity. Such properties range from physicochemical and quantum-chemical to geometrical and topological features.
The second reason stated use and development of molecular descriptors, stems from the paradigm of feature space prevailing in statistical data analysis. Most methods employed to predict the activity requires as input numerical vectors of features of uniform length for all molecules. Chemical structures of compounds are diverse in size and nature and as such do not fit into this model directly. To find a way this problem, molecular descriptors convert the structure to the form of well-defined sets of numerical values.
2.2. Selection of Relevant Molecular Descriptors
Many applications are capable of generating hundreds or thousands of different molecular descriptors. Large number of descriptors also effects interpretability of the final model. This has the negative effects on several aspects of QSAR analysis. To handle these problems, a wide range of methods for automated narrowing of the set of descriptors to the most informative ones are used in QSAR analysis.
2.3. A diagrammatic representation of the Descriptors to Activity
After the calculation and selection of relevant molecular descriptors, the final task of creating a function among their values and the analyzed activity remains.These include linear or non-linear ones, and many methods for carrying out the training to obtain the best function.
3. VARIOUS DESCRIPTORS USED IN QSAR
3.1. MOLECULAR DESCRIPTORS: Properties of molecules are characterized by numerical values called molecular descriptors. Molecular descriptors encoded structural features of molecules as numerical descriptors. Vary in complexity of encoded information and in compute time. These are truly structural descriptors because they are based only on the two-dimensional representation of a chemical structure.
Molecular descriptors can be of diverse types. It is categorized into fragment descriptors, involving properties of sections of molecules, and whole molecule descriptors, based on the properties of the intact molecule.
3.1.1. FRAGMENT DESCRIPTORS: The very earliest descriptors used in QSAR were of this type. QSAR was performed using substituent constants such as hydrophobic constants π, molar refractivity MR, Hammett constants σ and several other, less well-known constants. The recent explosion in the number of molecular descriptors to a certain degree is due to the ease by which they may be generated by computational methods, such as molecular orbital calculations [20-22]. There has also been a focus on developing fragment descriptors that are very computationally efficient. The reason is that rapid searching for leads in large chemical libraries (databases of real chemical compounds) or virtual libraries (databases of chemically reasonable molecules that have not yet been synthesized) require efficient information-rich descriptors. Surprisingly simple descriptors can yield useful models. For example, molecules may be represented simply by counting the numbers of atoms of specific elemental type, with specific numbers of connections (a measure of atomic hybridization). A current trend is to employ fragment descriptors based on important molecular properties such as hydrophobic (e.g. Aromatic rings), hydrogen bond donors (e.g. amines), hydrogen bond acceptors (e.g. carbonyls), positive charges (e.g. NH4+) and negative charges (e.g. PO3-). The rational for this was first described by Andrews and coworkers [23]. Other fingerprint and general fragment based methods such as molecular holograms [24, 25] generalize this approach of breaking molecules into fragments. Another important class of fragment-based descriptors, the Vander wall’s surface area descriptors (VSA) has been reported by Labute to have attributes that make them widely applicable QSAR descriptors [26]. VSA descriptors are derived by adding together the vander walls surface area contributions of atoms exhibiting a given property (chosen from steric, electrostatic and lipophilic properties) within a given binned property range. Linear combinations of VSA descriptors correlate well with most commonly used descriptors. Fragment- based descriptors have advantages of being computationally efficient and independent of molecular confirmation or 3D structure.
3.1.2. WHOLE MOLECULE DESCRIPTORS:They typically capture information on molecular size and lipophilicity through properties such as the molecular weight or molecular volume and log of the octanol-water partition coefficient (log P). The relationship between log P and some biological responses was often inverse parabolic, in which a maximum in the biological response occurred at some optimum log P value. The explanation for this relationship was that it described the partitioning of drug molecules into biological membranes. An important class of whole molecule descriptors is the topological descriptors [27-31].These involve treating molecules as topological objects where atoms become the vertices, and bonds the edges, of a molecular graph.
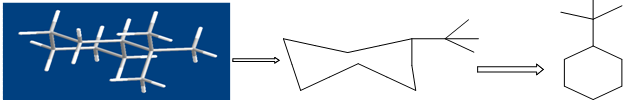
Figure shows the conversion of a molecular structure into a molecular graph. Three- dimensional structure (left), two-dimensional, hydrogen suppressed structure (centre) and hydrogen- suppressed molecular graph (right).
Topological indices are 2D descriptors based on graph theory concepts. These indices have been widely used in QSAR studies. They help to differentiate the molecules according mostly to their size, degree of branching, flexibility, and overall shape. The most widely known descriptors are those that were originally proposed by Randic [32] and extensively developed by Kier and Hall [33]. The strength of this approach is that the required information is embedded in the hydrogen- suppressed framework and thus no experimental measurements are needed to define molecular connectivity indices. For each bond the Ckterm is calculated. The summation of these terms then leads to the derivation of X, the molecular connectivity index for the molecule.
Ck = (δi δj)-0.5 where δ = σ - h
δ is the count of formerly bonded carbons and his the number of bonds to hydrogen atoms.To correct for differences in valence, Kier and Hall proposed a valence delta (δv)term to calculate valence connectivity indices [34].
Molecular connectivity indices have been shown to be closely related to many physicochemical parameters such as boiling points, melting points, dipole moment, solubility, molar refraction, polarizability, and partition coefficients [35, 36].
Recently, descriptors derived from Eigen values of molecular matrices derived from graphs have shown promise in generating descriptors useful for QSAR [37-39] and for molecular diversity purposes (e.g., characterization of chemical libraries and databases, and for design of optimally diverse combinatorial libraries. Modified adjacency matrices describe how atoms in a molecule are connected. They provide a means of combining the molecular properties with topological information encoding the way a molecule is connected.
Figure below is showing an example of a modified adjacency matrix. Diagonalisation of these matrices provides Eigen value descriptors. A modification of this Eigen value approach has been particularly useful in the description of molecular diversity (dissimilarity between molecules).
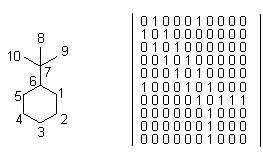
Conversion of molecule into an adjacency matrix. Off-diagonal elements are 1 if the two atoms are bonded, 0 if not.
NOW YOU CAN ALSO PUBLISH YOUR ARTICLE ONLINE.
SUBMIT YOUR ARTICLE/PROJECT AT articles@pharmatutor.org
Subscribe to PharmaTutor Alerts by Email
FIND OUT MORE ARTICLES AT OUR DATABASE
4. Brief description of some descriptors is [40]:
Molecular descriptors map the structure of the compound into a set of numerical or binary values representing various molecular properties that are deemed to be important for explaining activity. Two broad families of descriptors can be distinguished, based on the dependence on the information about 3D orientation and conformation of the molecule.
4.1. 2D-QSAR Descriptors
1. Constitutional Descriptor
Molecular weight, no. of atoms, no. of non-H atoms, no. of bonds, no. of heteroatoms, no. of multiple bonds (nBM), no. of aromatic bonds, no. of functional groups (hydroxyl, amine, aldehyde, carbonyl, nitro, nitroso, etc.), no. of rings, no. of circuits, no of H-bond donors, no of H-bond acceptors, no. of Nitrogen atoms (nN), chemical composition, sum of Kier-Hall electro topological states (Ss), mean atomic polarizability (Mp), number of rotable bonds (RBN), mean atomic Sanderson electro negativity (Me), etc. Total number of atoms in the molecule. Numbers of atoms of certain chemical identity (C, H, O, N, F, etc.) in the molecule. Numbers of certain chemical groups and functionalities in the molecule. Total number of bonds in the molecule. Numbers of single, double, triple, aromatic or other bonds in the molecule. Number of rings, number of rings divided by the total number of atoms. Number of six membered aromatic rings. Molecular weight and average atomic weight.
2. Geometrical Descriptor
Descriptors using the atomic coordinates (x, y, z) of molecules are therefore called Geometricaldescriptors.Examples: vander Waals volume, molecular surface, polar surface etc,as a consequence they usually depend on the conformation. 3D petijean shape index (PJI3), Gravitational index, Balaban index, Wiener index, etc.
3. Quantum Mechanical Descriptor
Highest occupied Molecular Orbital Energy (HOMO) , Lowest Unoccupied Molecular Orbital Energy (LUMO), Most positive charge (MPC), Least negative charge (LNC), Sum of squares of charges (SSC), Sum of square of positive charges (SSPC), Sum of square of negative charges (SSNC), Sum of positive charges (SUMPC), Sum of negative charges (SUMNC), Sum of absolute of charges (SAC), Total dipole moment (DMt), Molecular dipole moment at X-direction (DMX), Molecular dipole moment at Y-direction (DMY), Molecular dipole moment at Z direction (DMZ), Electronegativity (χ= -0.5 (HOMO-LUMO)), Electrophilicity (ω= χ2/2 η), Hardness (η = 0.5 (HOMO+ LUMO)) and Softness (S=1/ η).
4. Functional Group Descriptor
Number of total tertiary carbons (nCt), Number of H-bond acceptor atoms (nHAcc), number of total hydroxyl groups (nOH), number of unsubstituted aromatic C (nCaH), number of ethers (aromatic) (nRORPh), etc.
5. Chemical Descriptor
Log P (Octanol-water partition coefficient), Hydration Energy (HE), Polarizability (Pol), Molar refractivity (MR), Molecular volume (V) and Molecular surface area (SA).
6.Substituent Electronic Descriptors
RMSQ (Root mean square error of charges), SPQ (Sum of positive charges), SNQ (Sum of negative charges), RMSDM (Root mean square of dipole moments at any Cartesian coordinate direction), TDM (Total dipole moment), FRMS (Root mean square force that any atom in constituent molecule sees right before the optimization), FMAX (Maximum force on molecule), HOMO (Highest occupied molecular orbital), LUMO (Lowest unoccupied molecular orbital), HD (Hardness), SOF (Softness), EPH (Electrophilicity) and EN (Electronegativity).
7.Topological Descriptors
Descriptors derived from the configuration of the molecules (covalent bonding pattern). Topological indices are 2D descriptors based on graph theory concepts. Since no coordinates of atoms are used, they are in general conformationally independent, despite containing topological information about the molecule. These indices have been widely used in QSAR studies. They help to differentiate the molecules according mostly to their size, degree of branching, flexibility, and overall shape e.g., In Molecular Connectivity indices, branching index is the sum of the bond connectivity’s over all bonds in the molecule and Weiner indices Counts the number of bonds among pairs of atoms and sums the distances among all pairs.A sp3 hybridized carbon has got four valences, a sp2 carbon only three.Thus the ratio of the actual branching degree to the theoretically possible branching degree can be used as descriptor as it is related to the saturation.
4.2. 3D-QSAR Descriptors
The 3D-QSAR methodology is much more computationally complex than 2D-QSAR. Several steps are involves to obtain numerical descriptors of the compound structure.
1. The conformation of the compound has to be determined either from experimental data or molecular mechanics and then refined by minimizing the energy [41, 42].
2. The conformers in dataset have to be uniformly aligned in space.
3. The space with immersed conformer is probed computationally for various descriptors.
4. Some methods independent of the compound alignment have also been developed.
4.2.1. Alignment-Dependent 3D-QSAR Descriptors
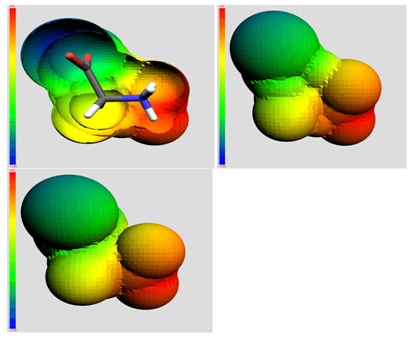
4.2.1.1. Comparative Molecular Field Analysis
The Comparative Molecular Field Analysis (CoMFA) [43] uses electrostatic (Coulombic) and steric (vander Waals) energy fields defined by the inspected compound. The aligned molecule is placed in a 3D grid. In each point of the grid lattice a probe atom with unit charge is placed and the potentials (Coulomb and Lennard-Jones) of the energy fields are computed. Then, they serve as descriptors in further analysis, typically using partial least squares regression.
4.2.1.1.1. DRAWBACKS AND LIMITATIONS OF CoMFA
Despite of offering many advantages over classical QSAR and good performance in various practicable applications, CoMFA has several limitations as given below [44-46]:
1. Uncertainty in selection of compounds and variables.
2. Fragmented contour maps with variable selection procedures.
3. Hydrophobicity not well-quantified.
4. Cut-off limits used.
5. Low signal to noise ratio due to many useless field variables.
6. Imperfections in potential energy functions.
7. Various practicable problems with PLS.
8. Applicable only to in vitrodata.
9. Since the time of its origin in 1988, numerous applications of the CoMFA method in different fields have been published [47]. Several data set have been investigated; the first being the binding affinity of the steroid data set [48] for human corticosteroid-binding globulins (CBG) and testosterone-binding globulins (TBG). Many successful endeavors of CoMFA approach in the areas of enzyme highly sensitive to bioactive conformation, different binding modes of ligands, alignment rules and number of components.
10. Too many adjustable parameters like overall orientation, lattice placement, step size, probe atom type etc.
4.2.1.2. Comparative Molecular Similarity Indices Analysis
The Comparative Molecular Similarity Indices (CoMSIA) [49] is similar to CoMFA in the aspect of atom probing throughout the regular grid lattice in which the molecules are immersed. The similarity between probe atom and the analyzed molecule are calculated. Compared to CoMFA, CoMSIA uses a different potential function, namely the Gaussian-type function which allows for accurate information in grid points located within the molecule. Steric, electrostatic, and hydrophobic properties are then calculated; hence the probe atom has the unit hydrophobicity as additional property.
4.2.2. Alignment-Independent 3D-QSAR Descriptors
4.2.2.1. Comparative Molecular Moment Analysis
The Comparative Molecular Moment Analysis (CoMMA) [50] uses second-order moments of the mass distribution and charge distributions. The moments relate to center of the mass and center of the dipole. The CoMMA descriptors include principle moments of inertia, magnitudes of dipole moment and principle quadrupole moment. Furthermore, descriptors relating charge to mass distributions are defined, in other words, magnitudes of projections of dipole on principle moments of inertia and displacement between center of mass and center of dipole.
4.2.2.2. Weighted Holistic Invariant Molecular Descriptors
The Weighted Holistic Invariant Molecular (WHIM) [51, 52] and Molecular Surface WHIM [53] descriptors provide the invariant information by employing the principle component analysis (PCA) on the centered co-ordinates of the atoms constituting the molecule. This transforms the molecule into the space that captures the most variance. In this space, several statistics are calculated and serve as directional descriptors, including variance, proportions, symmetry and kurtosis. By combining the directional descriptors, non-directional descriptors are also defined. The contribution of each atom can be weighted by a mass, vander Waals volume, atomic electronegativity, atomic polarizability, electrotopological index of Kier and Hall and molecular electrostatic potential.
Grid-Independent Descriptors [54]
It utilizes probing of the grid with specific probes. The regions showing the most favorable energies of interaction are selected, provided that the distances between the regions are large and the probe-based energies are encoded in a way independent of the molecule's arrangement.
VolSurf
The VolSurf [55, 56] works similar to GRIND for e.g., hydrophobic interactions or hydrogen bond acceptor or donor groups. The resulting lattice boxes are used to compute the descriptors relying on volumes or surfaces of 3D contours, defined by the same value of the probe molecule interaction energy. By using various probes and cut-off values for the energy, different molecular properties can be quantified. These include e.g., molecular volume and surface, and hydrophobic and hydrophilic regions.
NOW YOU CAN ALSO PUBLISH YOUR ARTICLE ONLINE.
SUBMIT YOUR ARTICLE/PROJECT AT articles@pharmatutor.org
Subscribe to PharmaTutor Alerts by Email
FIND OUT MORE ARTICLES AT OUR DATABASE
5. DESCRIPTOR SELECTION:
To build agood QSAR model, a minimal set of information-rich descriptors is required. The large number of possible indices creates several problems for the modeler [57, 58].
1. Many descriptors do not contain molecular information relevant to the problem.
2. Many descriptors are linearly dependant (contain essentially the same information).
3. Use of poor descriptors in QSAR yields poor and misleading models.
4. Including too many descriptors in the model, even if they contain relevant information, can result in over fitting of the model, and loss of ability of the model to generalize to unseen molecules.
5. Many methods of screening this large pool of potential descriptors for relevant ones can lead to chance correlations (correlations that arise by chance because so many descriptors have been tried in models). In other words, if many random numbers are generated as potential descriptors (which clearly do not contain any useful molecular information), and various subsets of these are used to build models, apparently significant models can arise by chance.
The earliest method of variable selection used stepwise regression. This was integrated with the model-building process and involved stepwise addition (or backwards elimination) of descriptors according to a statistical test, to find the best model. Another widely used variable reduction method is principle components analysis (PCA). This involves creating a smaller set of new orthogonal descriptors from linear combinations of the original descriptors and using these to generate QSAR models.
The 2D- Versus 3D-QSAR Approach
Studies show that assumption of superiorness of 3D approaches to 2D in drug design may not always hold. For example, the results of conventional CoMFA may often be non-reproducible due to dependence of the outputs' quality on the orientation of the rigidly aligned molecules on user's terminal [59, 60]. Such alignment problems are typical in 3D approaches and even though some solutions have been proposed, the unambiguous 3D alignment of structurally diverse molecules remains a difficult task. Moreover, the distinction between 2D- and 3D-QSAR approaches is not a crisp one, especially when alignment independent descriptors are considered. This can be observed when comparing the BCUT with the WHIM descriptors. Both employ a similar algebraic method, i.e., solving an Eigen problem for a matrix describing the compound the connectivity matrix in case of BCUT descriptors and covariance matrix of 3D co-ordinates in case of WHIM. There is also a deeper connection between 3D-QSAR and one of 2D methods, the topological approach. It stems from the fact that the geometry of a compound often depends on its topology. An elegant example was provided by Estrada et al., who demonstrated that the dihedral angles of biphenyl as a function of the substituents attached to it can be predicted by topological indices [61]. Along the same line, a supposedly typically 3D property, chirality, has been predicted using chiral topological indices [62], constructed by introducing an adequate weight into the topological matrix for the chiral carbons.
MODERN QSAR
We have discussed traditional QSAR, now termed 2D-QSAR and 3D-QSAR. The QSAR relations were determined using logic about important parameters and had to rely on statistical correlations of structural descriptors with biological activities. There were some significant limitations with using the QSAR relations developed to predict better drugs. Today, 3D-QSAR uses model computational methods and technologies such as statistical correlation, machine learning, and 3D visualization, yielding rational for computer assisted drug design. There are software products that enable the design and construction of the QSAR models in an optimal fashion.
APPLICATIONS
QSAR has been applied extensively and successfully over several decades to find predictive models for activity of bioactive agents. It has also been applied to areas related to discovery and subsequent development of bioactive agents: distinguishing drug-like from non-drug like molecules [63], drug resistance [64], toxicity prediction [65-70], physicochemical properties prediction (e.g. water solubility, lipophilicity) [71], gastrointestinal absorption [72], activity of peptides [73], data mining [74], drug metabolism [75] and prediction of other pharmacokinetic and ADME properties [76, 77]. Clearly the number of potential applications for structure-property modeling, in the most general case, is extensive and growing daily. Improved molecular descriptors, based on a better understanding of which molecular attributes are most important for a given property being modeled, and increasing use of genetic and artificial intelligence methods will raise QSAR to even greater levels of usefulness than the current high level.
CONCLUSION
Despite of several limitations, it has a now been globally apprehended by the contemporary drug discovery community that QSAR, based on well-established principals of statistics, is intrinsically a valuable and viable medicinal chemistry tool whose application domain range from explaining the structure-activity relationships quantitatively and retrospectively, to endowing synthetic guidance leading to logical and experimentally testable hypotheses. The development of QSARs in last 40 years has evolved both in terms of descriptor generation and data analysis. It involves the mathematical and statistical analysis of SAR-data which helps to reduce the number of educated guesses in molecular modification.QSAR is thus a scientific achievement and an economic necessity to reduce empiricism in drug design to ensure that every drug synthesized and pharmacologically tested should be as meaningful. A basic understanding of QSAR concepts is essential for most people, across a diverse range of skills.
REFERENCES
[1] Grover M, Singh B, Bakshi M, Singh S. Pharm. Sci. Technol. Today 2000; 3: 28.
[2] Grover M, Singh B, Bakshi M, Singh S. Pharm. Sci. Technol. Today 2000; 3: 50.
[3] Crum-Brown A, Fraser TR. Trans. R. Soc. Edinburg 1868-9; 25: 151.
[4] Balbes LM, Mascarella SW, Boyd DB. vol. 5, pp. 337-378: In; Reviews in Computational Chemistry, Lipkowitz KB, Boyd DB, Editors, VCH Publishers, Inc. New York, 1994.
[5] Peet NP. Mod. Drug Discov 2000, March, 21.
[6] Parril AL, Reddy MR (Eds.). Rational Drug Design: Novel Methodology and Practical Applications. ACS: Washington, 1999.
[7] Devlin JP (Ed.). High Throughput Screening. Marcel Dekker: New York 2000.
[8] Kniaz D. Mod. Drug. Discov 2000; 67.
[9] Ladd B. Mod. Drug. Discov 2000, January/February, 46.
[10] Bleicher KH, Boehm HJ, Mueller K, Alanine AI. Nat. Rev. Drug Discov 2003, 2, 369-378.
[11] Gershell LJ, Atkins JH. Nat. Rev. Drug Discov 2003; 2: 321-327.
[12] Goodnow R, Guba W, Haap W. Comb. Chem. High Throughput Screen 2003; 6: 649-660.
[13] Walters WP, Stahl MT, Murcko MA. Drug Discovery Today 1998; 3: 160.
[14] Venkatesh S, Lipper RA. J. Pharm. Sci 2000; 89: 145.
[15] Hann M, Green R. Curr. Opin. Chem. Biology 1999; 3: 379.
[16] Hann M, Green R. Curr. Opin. Chem. Biology 1999; 3: 379.
[17] Van de Waterbeemd H, Carter RE, Grassy G, Kubinyi H, Martin YC, Tute MS, Willett P. Ann. Rep. Med. Chem 1998; 33: 397.
[18] Ooms F. Curr. Med. Chem 2000; 7: 141.
[19] Hansch C, Fujita TP. A Method for the correlation of biological activity and chemical structure. J. Am. Chem. Soc 1964; 86: 1616-1626.
[20] Warne MA, Nicholson JK. Quantitative structure-activity relationships (QSAR’s) in environmental research. Part II. Molecular orbital approaches to property calculation. Prog. Environ. Sci 2000; 2 (1): 31-52.
[21] Karelson M, Lobanov VS, Katritzky AR. Quantum-chemical descriptors in QSAR/QSPR studies. Chem. Rev 1996; 96 (3): 1027-1043.
[22] Carbo-Dorca R, Amat L, Besalu E. Quantum mechanical origin of QSAR: theory and applications. Theochem 2000; 504: 181-228.
[23] Andrews PR, Craik DJ, Martin JL. Functional group contributions to drug-receptor interactions. J. Med. Chem 1984; 27: 1648- 1657.
[24] Tong W, Lowis DR, Perkins R. Evaluation of quantitative structure-activity relationship methods for large-scale prediction of chemicals binding to the estrogen receptor. J. Chem. Inf. Comput. Sci 1998; 38: 669-677.
[25] Winkler DA. Holographic QSAR of benzodiazepines. Quantitative structure-activity relationship 1998; 17: 224.
[26] Labute P. A widely applicable set of molecular descriptors. J. Mol. Graph. Mod 2000, 18: 464-477.
[27] Randic M. On computation of optimum parameters for multivariate analysis of structure-property relationship. J. Comp. Chem 1991; 12 (8): 970-980.
[28] Balaban AT. A personal view topological indices for QSAR/QSPR. QSPR/QSAR Stud. Mol. Descriptors 2001; 1-30.
[29] Devillers J. New trends in QSAR modeling with topological indices. Curr. Opin. Drug Discovery Development 2000; 3 (3): 275-279.
[30] Estrada E. Novel strategies in the search of topological indices. Topol. Indices Relat. Descriptors QSAR/ QSPR 1999; 403-453.
[31] Bonchev D. Overall connectivity and topological complexity. A new tool for QSPR/QSAR. Topol. Indices Relat. Descriptors QSAR/ QSPR 1999; 361-401.
[32] Randic M. Journal of American Chemical Society 1975; 97: 6609-6615.
[33] Hall LH, Kier LB. J. Pharm. Science 1977; 66: 642.
[34] Kier LB, Hall MH. J. Pharm. Science 1983; 72: 1170.
[35] Kier LB, Hall LH. Molecular Connectivity in Chemistry and Drug Research. Academic Press, New York/London 1976.
[36] Hall LH, Kier LB. J. Pharm. Sci. 1975; 64: 1978.
[37] Burden FR. A chemically intuitive molecular index based on Eigen values of a modified adjacency matrix. J. Chem. Inf. Comput. Science 1997; 16: 309-314.
[38] Stanton DT. Evaluation and use of BCUT descriptors in QSAR and QSPR studies. J. Chem. Inf. Comput. Science 1999; 39: 11-20.
[39] Randic M, Vracko M, Novic M. Eigen values as molecular descriptors QSPR/ QSAR Stud. Mol. Descriptors 2001; 147-211.
[40] Fassihi A, Sabet R. QSAR Study of p56lck Protein Tyrosine Kinase Inhibitory Activity of Flavonoid Derivatives Using MLR and GA-PLS. Int. J. Mol. Science 2008; 9: 1876-1892.
[41] Guner OF. Curr. Top. Med. Chem., 2002; 2: 1321-1332.
[42] Akamatsu M. Curr. Top. Med. Chem 2002; 2: 1381-1394.
[43] Cramer RD, Patterson DE, Bunce JDJ. Am. Chem. Soc 1988; 110: 5959-5967.
[44] Hopfinger AJ, Tokarski JS. Three-Dimensional Quantitative Structure-Activity Relationship Analysis, pp. 105-164: In; Practical Application of Computer-Aided Drug Design, Charifson PS, Editor, Marcel Dekker, Inc.: New York, USA, 1997.
[45] Oprea TI. 3D QSAR Modeling in Drug Design, pp. 571-616: In; Computational Medicinal Chemistry for Drug Discovery, Bultinck P, Winter HD, Langenaeker W, Tollenaere JP. Editors, Marcel Dekker, Inc.: New York, USA, 2004.
[46] Kim KH. Comparative molecular field analysis (CoMFA), 291-331: In; Molecular Similarity in Drug Design, Dean PM. Editor, Blackie Academic & Professional: Glasgow, UK, 1995.
[47] Kim KH. List of CoMFA References, 3: 316-338: In; 3D QSAR in Drug Design-Recent Advances, Kubinyi, H.; Folkers G, Martin YC. Editors, Kluwer Academic Publishers: New York, USA, 1998.
[48] Coats, E.A. The CoMFA Steroids as a Benchmark Dataset for Development of 3D QSAR Methods, 3: 199-213: In; 3D QSAR in Drug Design Recent Advances, Kubinyi H, Folkers G, Martin YC. Eds.; Kluwer Academic Publishers: New York, USA, 1998.
[49] Klebe G, Abraham U, Mietzner TJ. Med. Chem 1994; 37: 4130-4146.
[50] Silverman BD, Platt DE. J. Med. Chem 1996; 39: 2129-2140.
[51] Todeschini R, Lasagni M, Marengo EJ. Chemom 1994; 8: 263-272.
[52] Todeschini R, Gramatica P. Perspect. Drug Discov. Des 1998; 9-11: 355-380.
[53] Bravi G, Gancia E, Mascagni P, Pegna M, Todeschini R, Zaliani AJ. Comput. Aided Mol. Des 1997; 11: 79-92.
[54] Pastor M, Cruciani G, McLay I, Pickett S, Clementi SJ. Med. Chem 2000; 43: 3233-3243.
[55] Cruciani G, Crivori P, Carrupt PA, Testa B J. Mol. Struct.: THEOCHEM 2000; 503: 17-30.
[56] Crivori P, Cruciani G, Carrupt PA, Testa B J. Med. Chem 2000; 43: 2204-2216.
[57] Topliss JG, Edwards RP. Chance factors in studies of quantitative structure-activity relationships. J. Med. Chem 1979; 22 (10): 1238-1244.
[58] Manallack DT, Livingstone DJ. Artificial neural networks: Application and chance effects for QSAR data analysis. Med. Chem. Res 1992; 2: 181-190.
[59] Cho SJ, Tropsha A. J. Med. Chem 1995; 38: 1060-1066.
[60] Cho SJ, Tropsha A, Suffness M, Cheng YC, Lee KH. J. Med. Chem 1996; 39: 1383-1395.
[61] Estrada E, Molina E, Perdomo-Lopez, J. J. Chem. Inf. Comput. Sci 2001; 41: 1015-1021.
[62] De Julian-Ortiz JV, de Gregorio Alapont C, Rios-Santamarina I, Garcia Domenech R, Galvez JJ. Mol. Graphics Modell. 1998; 16: 14-18.
[63] Ajay, Walters WP, Murcko M. Can we learn to distinguish between “drug-like” and “non-drug-like” molecules? J. Med. Chem. 1998; 41: 3314-3324.
[64] Wiese M, Pajeva IK. Structure activity relationships of multidrug resistance reversers. Curr. Med. Chem 2001; 8(6): 685-713.
[65] Schultz TW, Seward JR. Health effects related structure-toxicity relationships- a paradigm for the first decade of the new millennium. Sci. Total Environ 2000; 249 (1-3): 73-84.
[66] Benigni R, Giuliani A, Franke R, Gruska A. Quantitative structure activity relationships of mutagenic and carcinogenic aromatic amines. Chem. Rev 2000; 100 (10): 3697-3714.
[67] Garg R, Karup A, Hansch C. Comparative QSAR: On the toxicology of the phenolic OH moiety. Crit. Rev. Toxicol 2001; 31 (2): 223-245.
[68] Bashir SJ, Maibach HI. Quantitative structure analysis relationships in prediction of skin sensitization potential. Biochem Modulation Skin React 2000; 61-64.
[69] Cronin MTD. Computational methods for the prediction of drug toxicity. Curr. Opin. Drug Discovery Dev 2000; 3 (3): 292-297.
[70] Freidig AP, Hermens JLM. Narcosis and chemical reactivity QSARs for acute fish toxicity. Quant.Struct. Activity Relat 2001; 19 (6): 547-553.
[71] Gombar VK, Enslein K. Assessment of n-octanol/water partition coefficient: When is the assessment reliable? J. Chem. Inf. Comput. Sci 1996; 36 (6): 1127-1134.
[72] Agatonovic-Kustrin S, Beresford R, Yusof A, Pauzi M. Theoretically derived molecular descriptors important in human intestinal absorption. J. Pharm. Biomed. Anal 2001; 25 (2): 227-237.
[73] Brusic, V, Bucci K, Schonbach C. Efficient discovery of immune response targets by cyclical refinement of QSAR models of peptide binding. J. Mol. Graph. Modell 2001; 19 (5): 405-411.
[74] Burden FR, Winkler DA. The computer simulation of high throughput screening of bioactive molecules. Mol. Model. Predict. Bioact. [Proceedings of the 12th European symposium on Quantitative structure activity relationships], 175-180.
[75] Lewis DFV. Structural characteristics of human P450s involved in drug metabolism: QSARs and lipophilicity profiles. Toxicology 2000; 144 (1-3): 197-203.
[76] Vedani A, Dobler M. Multidimensional QSAR in drug research: predicting binding affinities, toxicity and pharmacokinetic parameters. Prog. Drug Res 2000; 55: 105-135.
[77] Guba W, Cruciani G. Molecular field- derived descriptors for the multivariate modeling of pharmacokinetic data. Mol. Model. Predict. Bioact. [Proceedings of the 12th European symposium on Quantitative structure activity relationships], 89-94.
NOW YOU CAN ALSO PUBLISH YOUR ARTICLE ONLINE.
SUBMIT YOUR ARTICLE/PROJECT AT articles@pharmatutor.org
Subscribe to PharmaTutor Alerts by Email
FIND OUT MORE ARTICLES AT OUR DATABASE


.png)