

About Author:
Brijesh Borad,
The University of London Metropolitan University,
London, UK
borad_brijesh@yahoo.com
Abstract :-
Breast cancer is widely spreaded type of cancer in women and responsible for high number of cancer death in women. Taxol has been already approved to be used for breast cancer by FDA. There have been several studies on the anti tumor activities of Vitamin E Succinate (VES) as complementary and alternative medicine. In present study, we investigated the cytotoxic effect of taxol-VES combination on MCF-7 breast cancer cell lines in comparison with taxol alone. MCF-7 cells are preffered because of higher sensitivity to estogens. MCF-7 cells were sub cultured in according to specifications of aseptic conditions by incubating at 37οC and 5%CO2. Cells were seeded in 24 well plate with culture medium and different concentration of different drug regimen ( taxol alone, VES alone, taxol-VES combination) for 72hrs. Cell viability can be checked by MTT cell viability assay. MTT assay uses a MTT dye which acts as a substrate for viable cell reductase enzyme. This enzyme reduces MTT yellow dye to purple colour formazan which is in proportional to viable cell eventually. The intensity of purple colour was measured by measuring absorbances at 570nM using spectrophotometer. The results of the study were plotted as %cell viability Vs concentration for each of three drug regimen. IC50 values for each drugs were calculated. Graphical and statistical analysis of results concluded that taxol-MCF combination has more inhibitory effect on MCF-7 breast cancer cell lines when treated for 72hrs in comparison with taxol alone and statistical analysis had concluded that results were significant enough to accept clinically to use in stratagic breast cancer therapy management.
Reference Id: PHARMATUTOR-ART-1268
1. Introduction
Breast cancer is the second leading cause of cancer death exceeded only by lung cancer in women(Weiss M, 2008(a)).Breast cancer is an uncontrolled growth of breast cells. It is a result of mutations, or abnormal changes, in the genes responsible for healthy growth regulation of each cells. These changed cells gain the ability to keep dividing without control or order, producing more cells just like it and forming a tumour (Breast cancer research UK, 2009). A tumour can be benign (not dangerous to health) or malignant (has the potential to be dangerous). Malignant tumours are cancerous and if they left unchecked, they spread throughout to body (Wikipedia, 2010). Usually breast cancer either begins in the cells of the lobules which produces milk, or the ducts, the passage that passes milk from the lobules to the nipple (Merk Manual, 2010). Breast cancer is being screened by mammogram technology. Routine mamographic screening is an accepted standard for early detection of breast cancer detection (Weiss M, 2008(b)). The study of large groups of related individuals led to the identification of several breast cancer susceptibility genes, including BRCA1, BRCA2. Mutations in these genes account for all hereditary breast cancers (NCI, 2009). Now-a-days, there are many treatment options available for breast cancer like Surgery ( Lumpectomy, Mastectomy ) Radiation Therapy, Hormonal Therapy ( aromatase inhibitors, selective eastrogen receptor modulators, and estrogen receptor down regulators), targeted therapies (trastuzumab-monoclonal antibody), and at last but most widely used is chemotherapy and combination therapy of all of above (Breast cancer UK, 2009(b))Chemotherapy treatment uses medicine to weaken and destroy cancer cells in the body. Chemotherapy is used to treat early-stage invasive breast cancer to get rid of any cancer cells that may be left behind after surgery and advanced-stage breast cancer. In many cases, a combination of two or more medicines will be used as chemotherapy treatment for breast cancer. These Combinations are known as chemotherapy regimens. There is a list of drugs that are being used in chemotherapy. Standard chemotherapy regimens include Adriamycin and taxol (AT), Cytoxan, methotrexate and fluorouracil (CMF), and Flurouracil,adriamycin and cytoxan etc (Breast cancer.org, 2009) but out from these standard regimens the combination of my interest is Taxol and Vitamin-E succinate which I will discuss in later part of this study.
Paclitaxel (Taxol) is obtained from dried bark of plant Taxus brevifolia (Pacific yew tree) which is mound mostly in N.America, china, and Europe (21cecpharm, 2008) The twig of which is shown in figure 1.
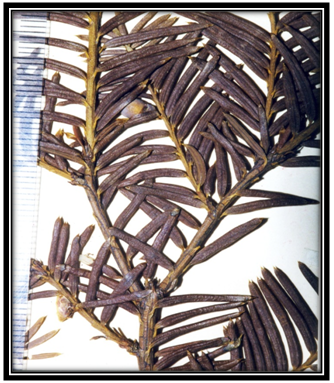
( Figure1:- Twig of Plant of Taxus brevifolia ) ( Wikipedia paclitaxel, 2010)
Taxol is in top of all anticancer drugs in the battle of we humans against cancer as it constitutes about 22 percentage of all major cancer chemotherapy drugs on the world market (chemocare, 2005). It is approved by the FDA to treat ovarian camcer in 1992 , breast cancer in 1994, and AIDS-related Kaposi sarcoma(National Cancer Institute, 2008). It is best to be used together with drug called cisplatin to treat advanced ovarian cancer and breast cancer. BMS (Bristol Mayers Squibb) is the pioneer for the development of taxol to its clinical use. BMS and Ivax have made billions of dollars with taxol. (National Cancer Institute,2008). It is clear colourless fluid that is given as as a chemotherapy infusion in early stage and metastatic breast cancer as a single or multiple drug regimen. Invivo and invitro study shows that B-subunit of microtubule heterodimer act as a target site for paclitaxel. Microtubules are a kind of cell skeleton and make up the organs of movement. However,when cell division is about to take place microtubules depolymerise back to tubulin and repolymerise to form the spindle of cell division. This spindle formation is necessary process for a cell to divide into two. In 1979, susan horwitz showed that taxol stimulates the formation of microtubules and prevents their depolymerization (Jordan M and Wilson L., April 2004) which is shown in figure2.
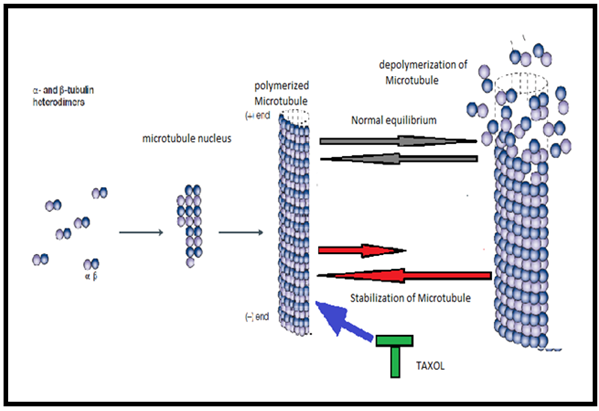
(Figure-2 Mechanism of action of Taxol, as it binds with microtubule it prevents its depolymerization) (Jordan M and Wilson L., April 2004)
So, it interrupts spindle formation process and eventually cell division process at the G2/M phase (Jordan M and Wilson L., april 2004)(Kumar N, 1981). Thus, it acts as an anticancer agent. The adverse drug reactions associated with taxol are peripheral neuropathy, mucositis, alopecia, neutropenia, cardiotoxicity, diarrhoea, and hypotension, reduction in WBC (Wikipedia paclitaxel, 2010). Paclitaxel undergoes transesterification in methanol, and it hydrolyzes in aqueous solutions. It is available as a white powder melting point of it is 213ºC. It is solubilize in eathanol and DMSO. The storage temperature is 2-8ºC. The price for paclitaxel powder in UK is 23.50 GBP for 1MG, 74GBP for 5MG and 255GBP for 25MG (Sigma Aldrich, 2010(a)). So, it is quite expensive drug. This thing ( Quite expensive) leads me to think that it should be used with other cheaper anticancer drug with different mechanism of action and with different pharmacological properties. There is a lot research study is going on with different forms of vitamin-E for its anticancer property. So, I think why not to go in deep with vitamin-E. Eventually, I found Vitamin-E succinate as second drug in combination with taxol for my study.
Vitamin E succinate (VES, α-TOS,RRR-α-tocopherol succinate) is the most potent antitumour analogue of vitamin E which is currently being charachterized for its chemopreventive and chemotherapeutic potential. Many groups have showed that VES inhibits cancer cell growth. The mechanism by which VES inhibits cell growth is not completely understood however it has been reported that this occurs by inducing apoptosis in cancer cells by mitochondrial destabilisation which is caused, most likely, by the detergent-like activity of VES. VES comprises a hydrophobic phytyl chain( hydrophobic domain) and the chargeable succinyl group (functional domain), separated by the bulky tocopheryl moiety(signalling domain). Due to tocopheryl moiety, the agent activates protein phosphatase-2A that, in turn, inhibits protein kinase C. This leads to hypophosphorylation of the antiapoptic protein bcl-2,with ensuing mitochondrial labilisation. The other mechanisms for inhibition of cell growth by VES includes DNA synthesis arrest, inhibition of angiogenesis, suppression of nuclear factor-kappa B activation, induced secretion and activation of transforming growth factor (TGF)-β. In addition, VES selectively damages only tumor cells without any toxic effects on normal cells or tissues For the last two decades, several studies have confirmed this observation in human breast cancer cell lines like MCF-7 cells. VES also increases the growth inhibitory effect of ionizing radiation therapy, biological modifiers and especially some chemotherapeutic agents ( may be Taxol!!!) on tumour cells, while protecting normal cells against some of their adverse reactions (Newzil J, 2003) (Albanes D and Heinonen OP et al 1996). The price for VES in UK is 21GBP for 100mg (Sigma Aldrich, 2010(b) ) (quite cheaper then taxol ).
MCF-7 is a breast cancer cell line ( as shown in figure 3 as a photograph) isolated from a 69 year old Caucasian women.
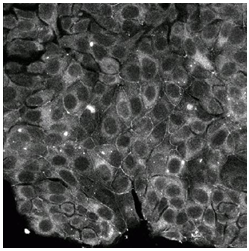
(figure 3 (A) Photograph of MCF-7 breast cancer cell lines ) ( MCF-7 cells, 2009)
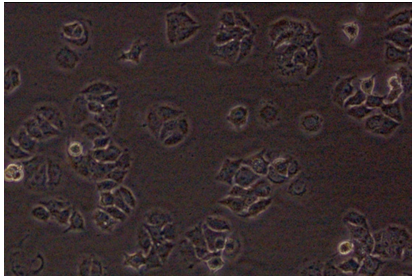
(figure 3(B) photograph of MCF-7 cells taken from this research experiment from inverted microscope of science centre, London Metropolitan University)
It is the shortform of Michigan Cancer Foundation, an organization in Detroit which is the pioneer for these cell lines. Herbert soule and co-workers of this organization has established this MCF-7 cell lines in 1973. Before to this event, there was no any mammary cell line that can survive more than few months. This invention of MCF-7 cells is the source of much of current knowledge about breast cancer. MCF-7 cell line is the first hormone-responsive breast cancer cell line. It has differential sensitivities to estrogens and anti-estrogens, differential expression of estrogens receptors and progesterone receptor, and differences in tumorigenicity and proliferation rates. Clinical studies have shown that increase in estrogens activity is associated with breast cancer. The addition of extradiol which is one of the fractions of estrogen to the medium of MCF-7 cells induces a proliferative response. The characteristics of MCF-7 cells like the estradiol-dependence for growth and low metastatic potential has led to the assumption that they represent an early adrenocarcinoma of breast. Thus,MCF-7 cell line are perfect model to study the progress of malignant cells as they can be subjected to appropriate endocrinologic and physiologic selective pressures for the derivation of variants with more progressed phenotypes. MCF-7 cells have ability to go through DNA fragmentation. There are apoptotic responses of MCF-7 cell line to the apoptosis inducing agents like tumour necrosis factor and anti-Fas antibody. The MCF-7 cells are also an excellent in vitro model for studying the mechanisms of chemo-resistance because of its susceptibility to apoptosis. In short, MCF-7 cell line is another useful cell line that can be used in various cancer research especially in breast cancer research. (MCF-7 cells, 2009)
Taxol and vitamin E succinatecombination was successfully tasted and reported previously for their inducing apoptosis and chemosensitivity in human bladder cancer cell lines and the result found was quite significant.(Kunimitsu K and Eiji K et al.,March 2009). As described earlier, taxol is quite expensive drug to be used clinically and breast cancer is widely diagnosed type of cancer amongst all in women. This certain matters make me stronger to study the cytotoxic effects of taxol-VES combination in breast cancer with the use of MCF-7 breast cancer cell lines and MTT assay.
Eventually, the aim of my study is to come out with a more cost and clinically effective drug regimen. Hypothesis for my study is “ To compare cytotoxic effects of taxol-VES combination regimen with taxol alone in MCF-7 breast cancer cell culture by MTT assay method.” So, in the out come of this study I can report if taxol-VES combination has significant difference as compared with taxol alone or not.
The method to check my hypothesis is MTT assay with the use of MCF-7 cells. MTT assay uses a MTT dye as a substrate of viable cell reductase enzyme. Cytotoxicity is measured by measuring absorbances of converted dye and measuring IC50 for each drug or drug combination. Thus, viability of cancer cells can be measured. Then comparative drug study is based on statistical analysis which is described in later part of this study.
NOW YOU CAN ALSO PUBLISH YOUR ARTICLE ONLINE.
SUBMIT YOUR ARTICLE/PROJECT AT articles@pharmatutor.org
Subscribe to Pharmatutor Job Alerts by Email
FIND OUT MORE ARTICLES AT OUR DATABASE
2.Materials and Methods:-
Cell lines and Chemicals:- MCF-7 breast cancer cells line was established in our laboratory and was kindly gifted by Dr.Bax ( course leader of pharmacology, London Metropolitan University). Taxol ( Paclitaxel ), Vitamin E Succinate, RPMI 1640 culture medium(2 X 500mL), Trypsin-EDTA solution(10mL), Streptomycin-penicillin solution(0.1mg/mL), new born calf serum, Phosphate buffered saline( 500mL ) and MTT ( (3-(4,5-dimethylthiazolyl-2)-2,5-diphenyltetrazolium bromide) dye were ordered from sigma Aldrich, UK and were kindly gifted by Dr.Bax. Hydrochloric acid (HCL) (50mL), DMSO, absolute iso-propranolol and all lab apparatus used were ordered from dispensary, science center, London Metropolitan University.
Stock Solution of Paclitaxel:- Paclitaxel is soluble in DMSO( Dimethyl sulfoxide).Quantity of Drug given 5mg ( 0.005gm ) which is equivalent to 5.86 x 10⁻⁶ mol.( because mole=weight in gm/ molecular weight and molecular weight of paclitaxel is 853.9gm/mol). If 1mol of drug in 1000mL gives 1M solution then 5.86 x 10⁻⁶ mol(5mg) in 5.86µL gives 1M solution so, 5mg of paclitaxel in 586µL of DMSO gave 10mM stock solution of taxol.
Clinically effective concentration range of taxol on MCF-7 breast cancer was found to be 0.1pM to 100µM and IC50 of paclitaxel was found 90nM from previous study. (Merlin J and Barberi M. 2003)
Several dilution of paclitaxel (3 µM, 1 µM, 0.3 µM,0.1 µM, 0.03 µM, 0.01 µM, 0.003 µM) were made from above made paclitaxel stock solution. All diluted drug solution were kept in sterile tube marked with concentration on it at 2-3ºC in refrigerator.
Stock solution of Vitamin E succinate:- Vitamin E succinate is soluble in ethanol. Molecular weight for VES is 530.78. So, 0.053gm of Vitamin E succinate in 1mL of ethanol gave 0.1M stock solution of vitamin E succinate.
IC 50 of vitamin E succinate was found 20µM. (Newzil J, 2003) .So, Severaldilutions for Vitamin E succinate ( 300 µM, 100 µM,30 µM,10 µM, 3 µM, 1 µM ) were made from above made stock solution and were kept in refrigerator at 2-4ºC in marked sterile tube.
Cell growth (Cell subculture ) method:- This was done to get sufficient amount required to complete research study. MCF-7 breast cancer cells were first subcultured aseptically and kept in incubator for growth as decribed follow. All the aseptic work was done in safety cabinet with laminar airflow. The old culture medium full of cell waste materials from cell flask was discarded into bio-waste beaker( which was finally destroyed by bleaching tablet) without touching flask neck. Cell culture flask was rinsed twice with phosphate buffered saline to remove old medium completely. Trypsin (0.3mL) and PBS ( 3mL ) were added into flask to detach adherent cells. These detached cell were collected in eppendorf tube. Flask was rinsed again with PBS to get remaining cells from the flask. Eppendorf tube with cell suspension (14mL) in PBS was prepared ready for centrifugation at 1200 RPM speed for 5 minute and water as a balance tube. After completion of centrifugation, supernatant was discarded and bottom cell mass was resuspended in 3mL of complete culture medium ( which was previously made by mixing RPMI 1640 medium ( 500mL ), 10% new born calf serum ( 50mL) and 5mL penicillin-streptomycin solution ). 1mL of this resuspended cell suspension(3mL) was transferred to each of three new sterile cell culture flask( 75cm3 ). These all 3 flask were provided with 25mL of complete culture medium to get set for grow in identical growing conditions like 37ºc, 5% CO2 in incubator for two days. The culture medium was changed three times a week. (Caymanchem.,2010).
Cell cytotoxicity / Cell viability /MTT Assay :-
The tetrazolium salt MTT was used to test the capacity of the drug in growth inhibition of MCF-7 cells. As described earlier, MCF-7 cells were collected from one of three flask by trypsin detachment and centrifugation method. These collected cells were resuspended into 100mL of culture medium. Each mL of this suspension was seeded aseptically in each well of sterile 24 well plate to get four of this same kind of 24 well plate seeded with 1ml of cell suspension. These all four plate were then incubated for 24 hour, at 37ºC, 5% CO2 . After 24hr incubation, old medium was discarded and new medium(1 mL in each well) was added and drug (10µL)( Paclitaxel, Vitamin E succinate or VES- paclitaxel combination ) available in different diluted concentration ( described earlier) were added in a duplicate protocol ( one concentration drug in two well ) and shown in a below figure 4 in three of four plate.
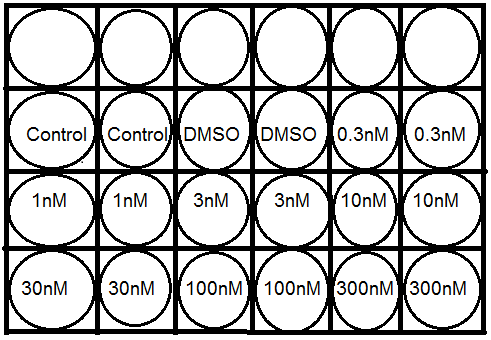
(Figure 4:- Distribution of different concentration of taxol in 24 well plate in duplicate protocol, First two well named control has no drug solution in i.e 0 nM)
Two wells of 24 were kept without adding any drug solution and two well were kept with adding only DMSO solution as controlled for study. These three 24 well plate seeded with MCF-7 cells in a culture medium and different concentration drug solutions was left for 72 hrs in incubator at 37ºC and 5% CO2. (Caymanchem.,2010).
MTT stock solution was made by adding 5mg of MTT dye in 10mL of DMSO.
MTT working solution was made from MTT stock solution ( 5mg/mL ) by diluting 10ml of stock solution with 100mL of culture media. This MTT working solution ( 0.5mg/mL ) was added in each well of three 24 well plate and were left for incubation for 3 hrs.
Making of acidic isopropanol ( 0.04M ) :- 25mL of 1M HCL was dilutes to 100mL with absolute isopropanol solution to give 0.04M acidic isopropanol required to solubilize converted purple dye.
After incubation, old culture medium was discarded and 1mL of acidic isopropanol was added in each well for all three 24 well plate to make purple dye soluble by mixing cell lines thoroughly with acidic dye solution. These purple dye solutions from each well were collected in a separate sterile tube with marked concentrations on it. These all colour solutions were transferred in a cuvette turn by turn and absorbance at 570nm was measures in spectrophotometer.
This, above described method, was repeated for all 3 drug regimen i.e paclitaxel and vitamin E succinate alone and taxol - vitamin E succinate combination. For the taxol –VES combination, IC50 of VES was calculated and each well was pre-treated with IC50 concentration of Vitamin E succinate and after 15minute of incubation again each well was treated with previously used different concentration of taxol. The method was then repeated as described above.
After obtaining absorbance for each drug concentration for all the three regimen therapy, results were ploted as % cell viability (% absorbance ) Vs Concentration of drug ( Taxol, Vitamin E Succinate, and Taxol-VES combination ). From the each graph IC50 of drug can be calculated. This is an important measure to check comparative effectiveness of different drugs under study.
Statistical analysis:-
Each data presents mean of three 24 well plate Data were analysed by independent sample t-test using SPSS statistics 17 program. Result of this analysis is shown in result section and is discussed in discussion part of this study work.
NOW YOU CAN ALSO PUBLISH YOUR ARTICLE ONLINE.
SUBMIT YOUR ARTICLE/PROJECT AT articles@pharmatutor.org
Subscribe to Pharmatutor Job Alerts by Email
FIND OUT MORE ARTICLES AT OUR DATABASE
3. Results:-
Absorbance of all the 3 plate well solutions for all the 3 experiment ( 3 drug regimen to be tested ) were measured and recorded in the tables below.
Cytotoxicity of Taxol and Vitamin E succinate:- We concluded dose and time –response studies on the on the proliferation of MCF-7 breast cancer cells in vitro to determine the effects of Taxol and VES on breast cancer growth. After 72 hr of incubation, both Taxol and VES inhibited cell growth in a dose-dependenmanner in MCF-7 breast cancer cell lines which can be cleared from figure 5 (A, B, C)
Absorbances recorded for taxol are shown in table below
|
Concentration (Paclitaxel) |
Absorbance( cell viability ) |
%cell viability |
|||
|
1 |
2 |
3 |
Average |
||
|
0µM |
0.268 |
0.28 |
0.298 |
0.282 |
100% |
|
0.003 µM |
0.249 |
0.2 |
0.22 |
0.223 |
79% |
|
0.01 µM |
0.256 |
0.19 |
0.188 |
0.211 |
74.82% |
|
0.03 µM |
0.178 |
0.160 |
0.162 |
0.166 |
58.86% |
|
0.1 µM |
0.134 |
0.140 |
0.122 |
0.132 |
46.80% |
|
0.3 µM |
0.118 |
0.120 |
0.092 |
0.110 |
39.00% |
|
1 µM |
0.096 |
0.12 |
0.092 |
0.102 |
36.17% |
|
3 µM |
0.066 |
0.60 |
0.048 |
0.058 |
20.56% |
|
DMSO |
0.245 |
0.290 |
0.284 |
0.267 |
94.68% |
(Table 1):-Measured absorbance(cell viability) and % cell viability for Paclitaxel at 570nm in spectrophotometer of a MTT assay drug solution for all three 24 well plate)
|
Concentration (VES) |
Absorbance( cell viability ) |
%cell viability |
|||
|
1 |
2 |
3 |
Average |
||
|
0 µM |
1.2 |
1.314 |
1.47 |
1.328 |
100% |
|
1 µM |
1.09 |
1.023 |
0.95 |
1.021 |
76.88% |
|
3 µM |
0.97 |
0.995 |
0.877 |
0.947 |
71.31% |
|
10 µM |
0.834 |
0.730 |
0.794 |
0.786 |
59.18% |
|
30 µM |
0.782 |
0.652 |
0.718 |
0.717 |
53.99% |
|
100 µM |
0.50 |
0.558 |
0.438 |
0.498 |
37.50% |
|
300µM |
0.254 |
0.29 |
0.154 |
0.232 |
17.46% |
|
Ethanol |
1.194 |
1.08 |
1.30 |
1.191 |
89.96% |
( Table 2) :- Measured absorbance(cell viability) and % cell viability for Vitamin E Succinate at 570nm in spectrophotometer of a MTT assay drug solution for all three 24 well plate )
Measured absorbance of the MTT assay final purple colour solution indicates cell viability after treatment with drug. So, we can say that it is the indirect measure for cytotoxicity of drug. Percentage cell viability will give us more clear idea to compare cytotoxicity of different drug regimen because IC50 of drug is much easier to calculate from graph of % cell viability Vs concentration. IC 50 is the half maximal inhibitory concentration and is a measure of effectiveness of a compound in inhibiting biological function. This measure indicates how much of a particular drug is needed to inhibits a given biological process by half ( Wikipedia IC50, 2010).The below figures are the graphs for % cell viability vs Concentration.
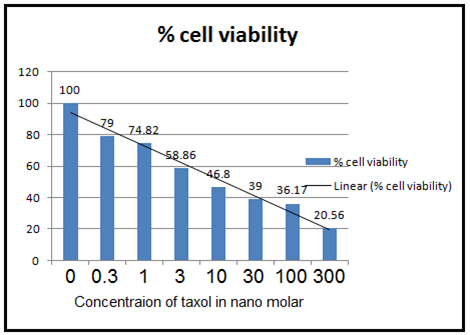
(Figure 5 (A) :- Cell viability measured by MTT assay for Paclitaxel. It shows cytotoxicity of paclitaxel on MCF-7 cell lines which are treated with different concentration described in table 1 of paclitaxel for 72 hrs. Graph is % cell viability against concentration of taxol. )
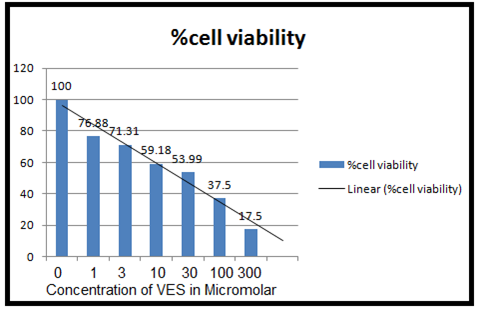
(Figure 5 (B) :- Cell viability measured by MTT assay for VES. It shows cytotoxicity of Vitamin E succinate on MCF-7 cell lines which are treated with different concentration described in table 2 of VES for 72 hrs. Graph is % cell viability against concentration of VES. )
From the above graph, it is clear that IC50 for paclitaxel is 8.9 nM and IC 50 for Vitamin E Succinate is 25µM. This IC50 of VES was used for the taxol-VES combination regimen experiment.
Eventually, IC 50 of all the 3 regimen ( Taxol, VES, Taxol-VES combination) can be compared to find out most effective regimen for MCF 7 breast cancer cell i.e lower the IC 50 of the drug more effective the drug in comparison to other
Cytotoxicity of Taxol- VES combination:- The measured absorbances of the MTT assay for this Taxol-VES combination are recorded in table below
|
Concentration (25 µM VES + Paclitaxel) |
Absorbance( cell viability ) |
%cell viability |
|||
|
1 |
2 |
3 |
Average |
||
|
0µM |
0.989 |
0.982 |
0.998 |
0.989 |
100% |
|
0.003 µM |
0.924 |
0.810 |
0.742 |
0.825 |
83.41% |
|
0.01 µM |
0.756 |
0.698 |
0.589 |
0.681 |
68.85% |
|
0.03 µM |
0.500 |
0.410 |
0.402 |
0.437 |
44.18% |
|
0.1 µM |
0.458 |
0.340 |
0.322 |
0.373 |
37.71% |
|
0.3 µM |
0.218 |
0.220 |
0.292 |
0.243 |
24.57% |
|
1 µM |
0.196 |
0.112 |
0.192 |
0.166 |
16.78% |
|
3 µM |
0.050 |
0.060 |
0.048 |
0.052 |
5.25 % |
|
DMSO |
0.934 |
0.999 |
0.922 |
0.951 |
96.51% |
( Table 3:- Measured absorbance(cell viability) and % cell viability for Paclitaxel + 25µM Vitamin E Succinate (IC50 of VES)) at 570nm in spectrophotometer of a MTT assay drug solution for all three 24 well plate.
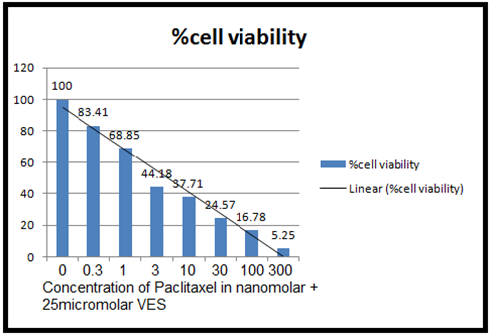
(Figure 5 (C) :- Cell viability measured by MTT assay for Taxol-VES combination. It shows cytotoxicity of paclitaxel-Vitamin E succinate on MCF-7 cell lines which are pre- treated with IC50 concentration of VES (25µM) and then treated with different concentration described in table 1 of paclitaxel for 72 hrs. Graph is % cell viability against concentration of taxol-VES combination. )
From the figure 5(C) IC50 of taxol- Vitamin E succinate combination is 2 nM.
Now, it is time to move on our hypothesis of our study i.e to compare cytotoxicity of taxol and taxol-VES combination and it can be cleared by comparing % cell viability vs concentration graph for both regimen ( taxol and taxol-VES combination ) which is shown below. Figure 6 is the most important figure to conclude our study aim and it is discussed in discussion section of this work.
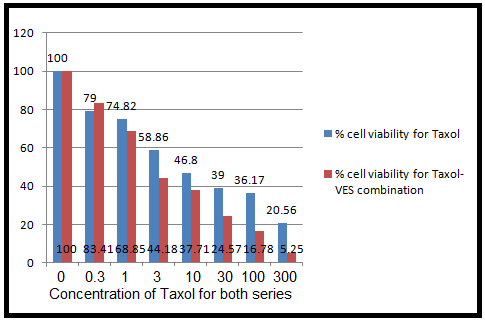
( Figure 6: Comparative cytotoxic effects of taxol-VES combination therapy and taxol therapy alone on MCF-7 breast cancer cell lines treated for 72 hrs. The graph is %cell viability against concentration for appropriate drug therapy )
Independent Sample T-test:- The raw data result format is submitted in appendix. Levene’s test for equality of variances is not significant because P-Value is 0.426 >>>0.05. So, t-test can be applied to given data set. Q-Q plot shows normal distribution of data. Box plot has no outliers so data is not skewed i.e it is normally distributed which is required for any statistical analysis.
Hypothesis for the test is there is no significant difference between these two therapy ( taxol-VES combination and Taxol alone). i.e mean value of cell viability (absorbance)for both therapies are same μ1=μ2. P value for T-test at 95 percentage of confidence interval is P=0.02<<<0.05. So, our hypothesis for the test is rejected which indicates there is significant difference between these two drug therapy. More specifically, it is analysed in discussion.
NOW YOU CAN ALSO PUBLISH YOUR ARTICLE ONLINE.
SUBMIT YOUR ARTICLE/PROJECT AT articles@pharmatutor.org
Subscribe to Pharmatutor Job Alerts by Email
FIND OUT MORE ARTICLES AT OUR DATABASE
4. Discussion:-
Breast cancer is one of the most aggressive tumours characterized by a high rate of early systemic dissemination. Patients with metastatic breast cancer are routinely treated with systemic chemotherapy such as adriamycin and taxol (AT) regimen, particularly in the setting of unresectable, diffusely metastatic, measurable disease; however, the response rates remain inadequate and this regimen is too costlier in daily clinical use. Despite continuous efforts to identify and develop even more effective and more cheaper chemotherapies for advanced breast cancer, not all patients with advanced disease will respond to therapy. Therefore, a new stategy that includes the enhancement of cytotoxicity and reduction of side effects would be a very important breakthrough in the management of advanced breast cancer.
In present study, we first evaluated the cytotoxic effect of taxol and Vitamin E Succinate alone and Taxol-VES combination in MCF-7 cells. All of three drug regimen inhibited MCF-7 breast cancer cells proliferation in dose- and time-dependent manner in vitro. These findings are compatible with previously published studies for above drugs on MCF-7 cells. This can be concluded from results obtained from study.
MTT assay method principle is based on cell viability assay. Each cells contains mitochondrial reductase enzyme which is only active in viable cells. MTT dye is yellow coloured substance. It act as a substrate for this reductase enzyme. So, this enzyme cause reduction of MTT yellow dye and converts it to purple,insoluble formazan dye. This can be make solubilized with acidic isopropanol. As enzyme can remain active only in viable cells, viability of cells can be measured by measuring colour change of dye solution. The colour of final solution can be measured by spectrophotometer and this absorbance is a measure of cell viability or cell cytotoxicity(Caymanchem.,2010).
From the results tables (1), (2), (3) and figure 5 (A, B, C) and 6, it can be cleared that taxol, Vitamin E Succinate and Taxol-VES combination shows inhibition in cell proliferation in dose dependent manner i.e increasing the dose of drug there is decrease in absorbance. DMSO and ethanol, solvents for drugs were also tested by MTT assay and they have minor inhibitory effect which can be concluded from result tables for drug so we can say thaat inhibitory effect was not due to solvents. Absorbance is measure of cell viability. More specifically, percentage cell viability was calculated which is easier measure to calculate IC50 of the each therapy. IC50 is very important measure for comparative study of all three therapies. Lower the IC50 for drug, more effective the drug is. IC50 for combination therapy (taxol-VES) is lowest in all three which is 2 nM quite lower than taxol (8.9nM ) and VES ( 25µM ). So, it can be concluded that Combination therapy is more effective as it is able to inhibit cell proliferation more effectively then drug alone. The figure 6 shows comparative study for taxol-VES combination and taxol and it clears that cell viability is higher for every concentration of taxol in comparison with taxol-VES combination.
Statistical analysis ( Independent T-test ) shows that there was significant difference at 95% confidence interval between two drug therapy ( taxol-VES combination and taxol alone). So, statistical analysis concludes that drug combination is much more effective to be use clinically. Graphical data also shows comparative more inhibitory effect of drug combination (taxol-VES) on MCF-7 cell proliferation in comparison with taxol alone. So, taxol-VES combination shows synergetic effect when gien for 72hrs which is more cost effective to use in daily clinical use.
One thing, It can be improve in methodology is cell detachment method from the cell culture flask during cell subculturing of MCF-7 cells. It was difficulty to detach all the cells from the flask by trypsin-EDTA. So, another method to detach and collect cells from flask should be developed in further study. Due to this, there was variability in cell concentration everytime which finally affects results as well. Another improvement, which is important to be do use cell protein measurement instead of measuring cell concentration by MTT assay. The reason for this is that some cells are bigger in size ( high amount of protein ) and some cells are smaller in size ( lower amount of protein ) . Bigger cells can make more and complex tumour as compared with smaller. So, we can not measure the development stage of cells by MTT assay method. So, I think that to measure cell protein is better way to measure cell cytotoxicity of drug.
5. Conclusion:- To the best of my knowledge, this is the first report to check if cytotoxic effect of Taxol-VES combination is more effective than taxol alone in MCF-7 breast cancer cell lines by MTT assay. The results demonstrate that taxol-VES combination has significant synergistic/additive effects. It has synergistic extent to extent to be accepted for logical therapeutic strategy for breast cancer.
6. Further work:- More further work can be done on this research study by improving methodology and measuring more criteria needed to calculate cell viability . For example, Measurement of cell protein after applying drug therapy instead of cell concentration by assay. Cell detachment method can be improved rather using trypsin-EDTA to collect all the cell mass adhered to cell culture flask. MCF-7 cells are only cancer cells so we cannot measure effects of drug on normal body cells. So, a method can be developed which uses both cancerous cells and normal body cells as well to check effect of drug on normal body cells.
Reference:-
1. Albanes D and Heinonen OP et al (1996).Tocopherol and b-carotene supplements and lung cancer incidence in the a-tocopherol, b-carotene cancer prevention study: effects of base-line characteristics and study compliance. J Natl Cancer Inst 88: 1560–1570.
2. Breast cancer research UK. (2009(a)). The Breast and Lymphatic system. Available: cancerhelp.org.uk/type/breast-cancer/about/the-breasts-and-lymphatic-system#nodes. Last accessed 12 august 2010.
3. Breast cancer.Org. (2009). Chemotherapy medicines. Available: breastcancer.org/treatment/chemotherapy/medicines.jsp. Last accessed 23 August 2010.
4. Cancer Reserach UK. (2009(b)). Breast cancer treatment.Available: cancerhelp.org.uk/type/breast-cancer/treatment/which-treatment-for-breast-cancer. Last accessed 23 August 2010.
5. Caymanchem. (2010). MTT cell proliferation assay.Available: caymanchem.com/pdfs/10009365.pdf. Last accessed 28 august 2010.
6. Chemocare. (2005). Chemotherapy drug-Paclitaxel.Available: chemocare.com/bio/paclitaxel.asp . Last accessed 24 august 2010.
7. Jordan M and Wilson L. (april 2004). Microtubule as a target for anticancer drug. Nature Reviews cancer. 4 (1), p253-265.
8. Kumar, N. (1981). ‘Taxol-induced polymerization of purified tubulin.’ Journal of Biological Chemistry 256, no. 20, 10435-10441.
9. Kunimitsu K and Eiji K et al. (March 2009). Vitamin E succinate induced apoptosis and enhanced chemosensitivity to paclitaxel in human bladder cancer cells in vitro and in vivo. The Official Journal of Japanese Cancer Association. 101 (1), p216-223.
10. MCF-7 cells. (2009). MCF-7 cells. Available: mcf7.com/. Last accessed 25 august 2010.
11. Merk Manual. (2008). Pathology of breast cancer. Available: merck.com/mmpe/print/sec18/ch253/ch253e.html. Last accessed 13 August 2010.
12. Merlin J and Barberi M. (2003). In vitro comparative evaluation of trastuzumab (Herceptin®) combined with paclitaxel (Taxol®) or docetaxel (Taxotere®) in HER2-expressing human breast cancer cell lines. Annals of oncology. 13 (10), p1743-1748.
13. National cancer institute. (2008). Success story-taxol. Available: dtp.nci.nih.gov/timeline/flash/success_stories/S2_Taxol.htm. Last accessed 24 august 2010.
14. NCI. (2009). BRCA1 and BRCA2: Cancer Risk and Genetic Testing. Available: cancer.gov/templates/doc.aspx?viewid=ABCB7812-A132-4E78-A532-F002C92FA9B9#1. Last accessed 21 august 2010.
15. Newzil J. (2003). Vitamin E succinate and cancer treatment: a vitamin E prototype for selective antitumour activity. British Journal of Cancer. 89 (10), 1822-1826.
16. Sigma aldrich. (2010)(b) . Vitamin E succinate. Available: sigmaaldrich.com/catalog/Lookup.do?N5=All&N3=mode+matchpartialmax&N4=vitamin+E+succinate&D7=0&D10=vitamin+E+succinate&N1=S_ID&ST=RS&N25=0&F=PR. Last accessed 25 august 2010.
17. Sigma aldrich. (2010)(a). Paclitaxel. Available: sigmaaldrich.com/catalog/ProductDetail.do?lang=en&N4=T7402|SIGMA&N5=SEARCH_CONCAT_PNO|BRAND_KEY&F=SPEC. Last accessed 24 august 2010.
18. Weiss M. (2008(a)). Breast cancer Available: breastcancer.org/symptoms/understand_bc/what_is_bc.jsp. Last accessed 12 august 2010.
19. Weiss M. (2008(a)). Breast cancer Available: breastcancer.org/symptoms/understand_bc/what_is_bc.jsp. Last accessed 18 august 2010.
20. Wikipedia (2010). Breast cancer classification. Available: en.wikipedia.org/wiki/Breast_cancer. Last accessed 12 august 2010.
21. Wikipedia IC50. (2010). IC50 value. Available: en.wikipedia.org/wiki/IC50. Last accessed 28 august 2010.
22. Wikipedia Paclitaxel (2010). Paclitaxel total synthesis. Available: wikipedia.org/Paclitaxel . Last accessed 24 august 2010.
23. 21cecpharm. (2008). Taxol-a billion dollar molecule.Available: 21cecpharm.com/px. Last accessed 23 August 2010.
NOW YOU CAN ALSO PUBLISH YOUR ARTICLE ONLINE.
SUBMIT YOUR ARTICLE/PROJECT AT articles@pharmatutor.org
Subscribe to Pharmatutor Job Alerts by Email
FIND OUT MORE ARTICLES AT OUR DATABASE


.png)